Multi-Perspective Analysis of News Articles using
Machine Learning Algorithms
Vaibhav Khatavkar
Research Scholar and Assistant Professor
Department of Computer Engineering, College of Engineering, Pune, MS, India
Makarand Velankar
Assistant Professor Department of Information Technology,MKSSS’s Cummins College of Engineering, Pune, MS,
India
Parag Kulkarni,
PhD Founder,Iknowlation Research Labs Private Limited, Pune, MS, India
ABSTRACT
Nowadays, many machine learning algorithms are evolving. It is a very difficult task to select a particular algorithm for a specific problem. A multi-perspective analysis of the given input data has to be performed to select a particular algorithm. In this study a case study has been taken for selecting an algorithm for the classification of news articles. Multi-perspective analysis is performed on the data using various machine learning algorithms namely Random Forest Classifier, Decision tree, AdaBoostClassifier, SVM with Linear SVC and SVM with NuSVC. For the multi perspective analysis, features from the dataset are extracted and standard metrics are used. The metrics used are Kappa, Accuracy, F-measure, Recall, and Precision. For the BBC news standard dataset, SVM Linear SVC proves to be effective because its classification rate is 96% and false positive rate is 0.75%.
Keywords
Machine Learning, Multi Perspective analysis, Classification, Document Analysis
1.
INTRODUCTION
Machine Learning is applied in solving many problems like Intrusion Detection Systems[1], Mobile Class Prediction [2], music analytics [3] etc. In today's era, machine learning plays an important role in data analysis for which choosing an appropriate algorithm is important. To analyze data, multi-perspective analysis of data is to be performed. Further depending on the features of the data, machine learning is chosen. There are two broad domains of machine learning algorithms: supervised and unsupervised. The top 10 machine learning algorithms are given in [4]. Article stated in [4] also states the algorithm to be applied to a particular scenario. Depending on the scenario, the top 10 classifiers are as given below:
1. Naive Bayes Classifier Algorithm 2. K Means Clustering Algorithm
3. Support Vector Machine (SVM) Algorithm 4. Apriori Algorithm
5. Linear Regression 6. Logistic Regression 7. Artificial Neural Networks 8. Random Forests
9. Decision Trees 10. Nearest Neighbors
According to [5], depending on the dimension of the data to be classified, time to classify and features to be labeled, the top 5 classifiers finalized are:
1. Random Forest 2. Naive Bayes 3. Nearest Neighbor 4. Decision Tree 5. SVM
Pereira et. al. in [6] made an attempt to evaluate machine learning algorithms in order to analyze Functional magnetic resonance imaging (fMRI) data. The train and test data was image data which was converted to vectors. The dimension vector of these images is large. To reduce the dimension of image vector for processing, feature selection and dimension reduction techniques are used. The classifiers used for analysis were Logistic Regression (LR), Linear SVM, Linear Discriminant analysis (LDA) and Gaussian Naive Bayes (GNB). The methods used for evaluation were accuracy, searchlight, activity and ANOVA. The application of these methods on the classifiers (LR, SVM, LDA and GNB) the researchers found that LR and SVM outperforms GNB in practice if considered voxel wise. Whereas, if the perspective is kept global to local classifiers then LDA is the chosen first, then LR, SVM and GNB because LDA is feasible with respect to tradeoff.
In [7], Khatavkar and Kulkarni explain various trends in document analysis in which vectorization of data is focused. However, this is not sufficient to select a particular algorithm. In [8], Khatavkar and Kulkarni explain efficiency of SVM on news dataset with respect to time. This motivates the researchers to have a multi-perspective analysis of text data using machine learning algorithms.
For experimentation, 5 algorithms namely Random Forest Classifier, Decision tree, AdaBoostClassifier, SVM with Linear SVC and SVM with NuSVC have been used. These algorithms are prominently used in Machine Learning Toolkit Provided with Python named scikit-learn [9].
1. Random Forest Classifier: This classifier is built on an ensemble learning method for classification which gathers all types of decision trees at training time and classifies data based on the mode of the class.
2. Decision tree: It is a classifier which builds a tree-like structure based of probability of an event to happen based on its outcome, resource, cost and utility.
23 combination of various machine learning algorithms.
Based on the weights of other learning algorithms applied on the data, the prediction is boosted.
4. SVM with Linear SVC: It is Support Vector Classification with Linear Kernel.
5. SVM with NuSVC: It too is a Support Vector Classification which uses a parameter to control the number of support vectors. Typically, Kernel is Radial Basis Function.
2.
PROPOSED WORK
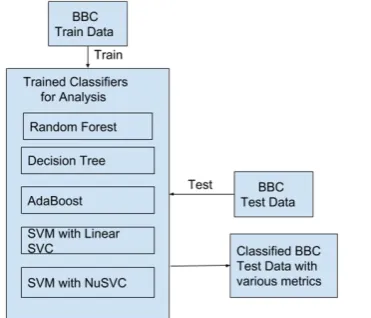
This work proposes to use different classifiers on Standard Text data.
The steps performed are as explained below: 1. Take input data for training classifiers,
2. Train the classifiers using various machine learning techniques,
3. Take the same input data for testing the trained classifiers,
4. Create a Confusion Matrix,
5. Calculate Kappa, F-measure, Recall, Precision and Accuracy of each classifier,
6. Calculate False Rate for each classifier.
3.
EXPERIMENTATION
Multi-perspective analysis is performed on BBC news dataset [10] using various machine learning algorithms namely Random Forrest Classifier, Decision tree, AdaBoostClassifier, SVM with Linear SVC and SVM with NuSVC.
BBC news dataset consists of 2225 documents divided into five categories namely business, sports, entertainment, politics and tech.
For multi-perspective analysis text features from the dataset were extracted which were 14788 words.
The total dataset was divided into two categories of train and test data. The train data consisted of 1780 documents whereas the test data consisted of 445 documents. A confusion matrix was created for this data when it was executed with various machine learning algorithms. The confusion matrix provided
[image:2.595.326.537.163.303.2]accuracy of the algorithm applied. Additionally, standard metrics like Kappa, F-measure, Recall and Precision were calculated. The sequence of best suited algorithms for classification of BBC news data was derived using standard metrics. Using confusion matrix, False Positives and Classification Rate were calculated and the derived sequence was verified.
Figure 2 : BBC Test Data
4.
RESULTS
Class 1, 2, 3, 4 and 5 represent 5 categories from the BBC news dataset. These are depicted in Figure 2. Class 1, class 2, class 3, class 4 and class 5 classified by various classifiers are shown in the confusion matrix generated for analysis. Standard metrics are calculated for Random Forrest Classifier, Decision tree, AdaBoostClassifier, SVM with Linear SVC and SVM with NuSVC.
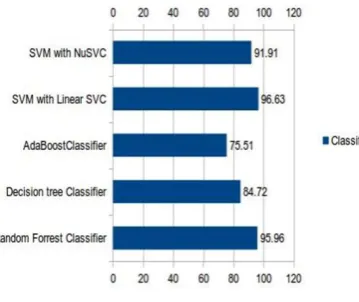
Table 1 depicts the metrics calculated on machine learning algorithms namely Random Forrest Classifier, Decision tree, AdaBoostClassifier, SVM with Linear SVC and SVM with NuSVC. According to F-measure and accuracy, the algorithms suitable for the classification of BBC news dataset are:
[image:2.595.316.541.464.679.2]1. SVM with linear SVC 2. Random Forrest Classifier 3. SVM with NuSVC 4. Decision Tree classifier 5. AdaBoostClassifier
Figure 3 :Comparison of Classifiers into Consideration and Standard Metrics
[image:2.595.66.252.552.711.2]The sequence can be visualized with the help of Figure 3 which shows a comparison of classifiers into consideration and standard metrics.
Table 1 : Classifiers and Standard Metrics used in Machine Learning Ra n d o m Fo rr est Cla ss ifi er De cisio n tr ee Cla ss ifi er Ada Bo o st Cla ss ifi er S VM with Lin ea r S VC S VM with NuS VC Kappa 0.948 9330 775 0.80716 41144 0.6880 60709 3 0.9575 24928 3 0.89753 36438 Accuracy 0.959 5505 618 0.84719 10112 0.7550 56179 8 0.9662 92134 8 0.91910 11236 F-measure 0.940 6779 7 0.81034 483 0.6590 9091 0.9732
1429 0.872
Precision 0.965 2173 9 0.81739 13 0.7565 2174 0.9478 2609 0.94782 609
Recall 0.952
7897 0.81385 281 0.7044 5344 0.9603 5242 0.90833 333
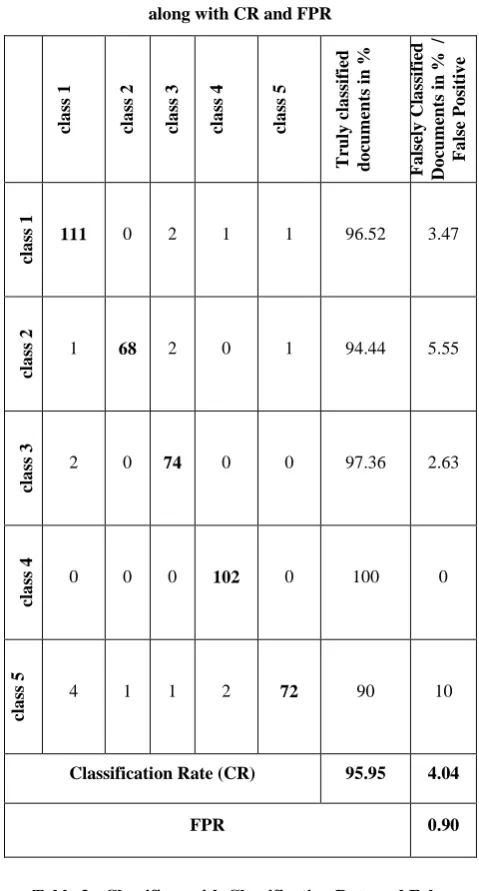
To verify the sequence of classifiers selection, an analysis of confusion was performed. Using Confusion Matrix generated for classifier, classification rate (CR) and false positive rate (FPR) was calculated. The confusion matrix for Random Forrest Classifier is shown in Table 2.
The truly classified documents in percentage for each
are calculated as given in Eq. (1). Falsely Classified Documents in percentage for each are calculated as given in Eq. (2). For each classifier, the classification rate is calculated in percentage as given in Eq. (3).
False Positive Rate (FPR) is calculated as given in Eq. (4).
… Eq. (1)
Where, is the number of documents classified as .
.. ..Eq. (2)
Where, Classified is the number of documents classified apart from .
………. Eq. (3)
………Eq. (4)
Using Eq. (1), (2), (3) and (4), CR and FPR were calculated which are tabulated in Table 3.
Table 3: Confusion Matrix for Random Forrest Classifier along with CR and FPR
cla ss 1 cla ss 2 cla ss 3 cla ss 4 cla ss 5 Tr u ly c la ss ifi ed d o cu m en ts in % Fa lse ly Cl a ss ifi ed Do cu m en ts i n % / Fa lse Po siti v e cla ss 1
111 0 2 1 1 96.52 3.47
cla
ss
2
1 68 2 0 1 94.44 5.55
cla
ss
3
2 0 74 0 0 97.36 2.63
cla
ss
4
0 0 0 102 0 100 0
cla
ss
5
4 1 1 2 72 90 10
Classification Rate (CR) 95.95 4.04
FPR 0.90
Table 3: Classifiers with Classification Rate and False Positive Rate Ran do m Fo rr e s t Cla s s ifi e r Dec is io n tree Cla s s ifi e r Ada Boos tCl a s s ifi e r SVM with Li ne a r SVC SVM with NuSVC Fa ls e Pos iti v e Rate
0.90 3.43 5.50 0.75 1.81
Cla s s ifi c a tio n Rate
[image:3.595.49.287.115.374.2]25
Figure 3 : Classification Rate
The comparison of various classifiers can be shown in graphs as illustrated in Figures 4 and 5. After the analysis of Table 3, Figures 3 and 4, one can derive at the following sequence for the classification of BBC news dataset:
1. SVM with linear SVC 2. Random Forrest Classifier 3. SVM with NuSVC 4. Decision Tree Classifier 5. AdaBoost Classifier
Figure 4 : False Positive Rate
The sequence is the same like the one which was derived using standard metrics namely F-measure and Accuracy. In [11], Lilimaet. al., stated the accuracy of their system for various algorithms; out of which Linear SVM gives 97.67% accuracy. Though the accuracy is increased the system performs stemming of the data which may lose context of the sentence. The system proposed in this paper, does not perform stemming so there is not data loss or loss of contextual information. The system proposed in this paper, gives 96.63% accuracy without performing stemming which is good.
5.
CONCLUSION
Table 4 summarizes the analysis carried out using standard metrics as well as with the calculation of Classification Rate and False Positive Rate of the classifiers. By using both the methods, the same sequence of classifiers is obtained for the BBC news dataset.
SVM with Linear SVC proved to be effective on the BBC news dataset for classification. When there is a large data to be analyzed, SVM with Linear SVC proves to be effective. i.e. the unsupervised approach proves to be good. The AdaBoostClassifier proves to have the lowest accuracy
because of very high FPR as well as low accuracy. Although Random Forrest Classifier shows a moderate performance, it consumes memory to store the intermediate state (typically trees) which also increases time for classification.
When a classifier has to be applied on a dataset, a multi-perspective analysis has to be performed. The analysis provides us a guideline to decide as to which classifier (i.e. machine learning algorithm) to be isselected to get good performance. Along with F-measure, False Positive Rate has to be considered too since False Positive Rate gives information about the percentage to which the classifier would go wrong. This is an important factor when one deals with the classification of real time and big data.
6.
ACKNOWLEDGMENTS
[image:4.595.311.546.288.766.2]We thank to all authorities of College of Engineering, Pune for their kind support and encouragement during the research.
Table 4: Summary of the Analysis for Various Classifiers Applied to BBC News Dataset
Ra
n
d
o
m
Fo
rr
est
Cla
ss
ifi
er
De
cisio
n
tr
ee
Cla
ss
ifi
er
Ada
Bo
o
stC
la
s
sifier
S
VM
with
Lin
ea
r
S
VC
S
VM
with
NuS
VC
K
a
p
p
a 0.948
9
0.807
1 0.6880 0.9575 0.8975
Ac
cu
ra
cy 0.959 5
0.847
1 0.7550 0.9662 0.9191
F
-m
ea
sure 0.940 6
0.810
3 0.6590 0.9732 0.872
Pre
cisio
n
0.965 2
0.817
3 0.7565 0.9478 0.9478
Re
ca
ll 0.952 7
0.813
8 0.7044 0.9603 0.9083
Co
rr
ec
tly
cla
ss
ifi
ed
d
o
cu
m
en
ts
o
u
t
o
f
4
4
5
Fa
lse
Po
siti
v
e
Ra
te 0.908 9
3.433
9 5.5043 0.7574 1.8179
Cla
ss
ifi
ca
tio
n
Ra
te 95.95 5
84.71
91 75.5056 96.6292 91.9101
7.
REFERENCES
[1] Habil Damania, Aditya Jagtap, Abhishek Jain, Chaitanya Chavan and Shraddha Khonde.(2018) “ MAIDEn: A Machine Learning Approach for Intrusion Detection using Ensemble Technique”. International Journal of Computer Applications 179(13):34-36, January 2018 [2] Muhammad Asim Zafar Khan, (2018) ,”Mobile Price
Class prediction using Machine Learning Techniques”, International Journal of Computer Applications 179(29):6-11, March 2018.
[3] Makarand Velankar, Parag Kulkarni, (2018) “Soft computing for music analytics”,International Journal of Engineering Applied Sciences and Technology Vol 3, issue 2.
[4] Top 10 Machine Learning Algorithms (Latest Update
made on May 11, 2018)
:https://www.dezyre.com/article/top-10-machine-learning-algorithms/202
[5] Top 5 classifiers (Last access on 1 November 2018):
https://stats.stackexchange.com/questions/7610/top-five-classifiers-to-try-first
[6] Francisco Pereira, Tom Mitchell, Matthew Botvinick, “Machine learning classifiers and fMRI:
A tutorial overview”, NeuroImageVolume 45, Issue 1, Supplement 1, March 2009, Pages S199-S209, :https://doi.org/10.1016/j.neuroimage.2008.11.007 [7] Khatavkar V., Kulkarni P. (2019), “Trends in Document
Analysis”. In: Balas V., Sharma N., Chakrabarti A. (eds) Data Management, Analytics and Innovation. Advances in Intelligent Systems and Computing, vol 808. Springer, Singapore.
[8] Khatavkar V., Kulkarni P. (2019), “Comparison of Support Vector Machines with and Without Latent Semantic Analysis for Document Classification”. In: Balas V., Sharma N., Chakrabarti A. (eds) Data Management, Analytics and Innovation. Advances in Intelligent Systems and Computing, vol 808. Springer, Singapore.
[9] SKlearnToolkit :http://scikit-learn.org/stable/
[10] BBC News Dataset : http://mlg.ucd.ie/datasets/bbc.html. [11] Lilima Pradhan, Neha Ayushi Taneja, Charu Dixit