AN EMPIRICAL STUDY OF
E-1
Gui Ren,
1Yann-Huang,
1
School of Business and Information Technology, Northwestern Polytechnic University, California, USA
2
Department of Bioenginering, Stanford University, California, USA
3
Department of Computer System Engineering, Northwestern Polytechnic Univerisity, California, USA
ARTICLE INFO ABSTRACT
This report was intended to investigate the effectiveness of innovativeness on online purchase intention in e
A number of path analyses were conducted to indicate the impact of different factors.
Copyright©2017, Gui Ren et al. This is an open access article distributed under the Creative Commons Att
distribution, and reproduction in any medium, provided the original work is properly cited.
INTRODUCTION
The objective of the present study is to investigate the factors that influence consumers’ purchase intentions during individual purchases online, to conduct an empirical investigation for a comprehensive understanding of the effects of factors influencing their purchase behavior, to make available managerial implications for the online retailing industry, and make a contribution to innovative product research. As previously mentioned, a great influence of innovativeness and segmentation strategies on consumers’ purchase intention was revealed. These findings may provide some insights on how to improve companies’ per
commerce contains outward-facing processes that affect
customers, suppliers and external partners. It includes sales, marketing, order taking, delivery, customer service, purchasing of raw materials and supplies for production and procurement of indirect operating-expense items such as office supplies and Jeyara, 2013). E-commerce involves new business models and the potential to gain new revenue or lose some existing revenue to new competitors. It involves three types of integration: a vertical integration of front
applications to existing transaction systems, a cross
integration of a company with web sites of customers, suppliers
*Corresponding author: Hiroshi Honda,
Department of Computer System Engineering, Northwestern Polytechnic Univerisity, California, USA
ISSN: 0975-833X
Article History:
Received 14th June, 2017 Received in revised form 12th July, 2017
Accepted 23rd August, 2017 Published online 29th September, 2017
Citation: Gui Ren, Yann-Huang, Jeng-Daw Wu, Yu statistical analysis”, International Journal of Current Research
Key words:
Statistical Analysis, E-commerce, Structural Equation Model, Management Strategies, Online Purchase, Path Analyses.
RESEARCH ARTICLE
-COMMERCE COMPANY BY USING STATISTICAL ANALYSIS
Huang,
1Jeng-Daw Wu,
2Yu-Chen Lo and *
,3Hiroshi Honda
Information Technology, Northwestern Polytechnic University, California, USA
Department of Bioenginering, Stanford University, California, USA
Department of Computer System Engineering, Northwestern Polytechnic Univerisity, California, USA
ABSTRACT
This report was intended to investigate the effectiveness of innovativeness
on online purchase intention in e-commerce by using structural equation model of statistical analysis. A number of path analyses were conducted to indicate the impact of different factors.
is an open access article distributed under the Creative Commons Attribution License, which distribution, and reproduction in any medium, provided the original work is properly cited.
bjective of the present study is to investigate the factors that influence consumers’ purchase intentions during their individual purchases online, to conduct an empirical investigation for a comprehensive understanding of the effects of factors influencing their purchase behavior, to make available managerial implications for the online retailing a contribution to innovative product research. As previously mentioned, a great influence of innovativeness and segmentation strategies on consumers’ purchase intention was revealed. These findings may provide some insights on how to improve companies’ performances.
E-facing processes that affect suppliers and external partners. It includes sales, marketing, order taking, delivery, customer service, purchasing of raw materials and supplies for production and procurement expense items such as office supplies (Sun commerce involves new business models and the potential to gain new revenue or lose some existing revenue to new competitors. It involves three types of rtical integration of front-end web site applications to existing transaction systems, a cross-business integration of a company with web sites of customers, suppliers
Northwestern Polytechnic
or intermediaries such as web
integration of technologies with modestly redesigned processes for order handling, purchasing or customer service
al., 1989). While e-business includes e
covers internal processes such as production, inventory management, product development, risk management, finance, knowledge management and human resources
E-business strategies are more complex, more focused on internal processes and are aimed at improvements in efficiency, productivity and cost savings
business enables an enterprise to reach the global customers. In an attempt to extend their sales platforms to a futuristic dimension, business houses have incorporated software that can run on platforms offered by the World Wide Web
al., 1990). According to the current theory, both e
and e-business address these processes in addition to managing technological infrastructure of databases, application servers, security tools, systems management and legacy systems (Fredriksson, 2013). And both involve the creation of new value chains between a company and its
suppliers as well as within the company itself. A wise company may decide to consolidate its gains and complete the work involved in its existing and largely separate e
CRM or supply-chain initiatives before making the big leap becoming an e-business (Agarwal and Prasad, According to e-marketer’s data research, in 2012 e sales topped $1 trillion for the first time in the history.
International Journal of Current Research
Vol. 9, Issue, 09, pp.56996-57001, September, 2017
Wu, Yu-Chen Lo and Hiroshi Honda, 2017. “An empirical study of e International Journal of Current Research, 9, (09), 56996-57001.
COMMERCE COMPANY BY USING STATISTICAL ANALYSIS
Hiroshi Honda
Information Technology, Northwestern Polytechnic University, California, USA
Department of Bioenginering, Stanford University, California, USA
Department of Computer System Engineering, Northwestern Polytechnic Univerisity, California, USA
This report was intended to investigate the effectiveness of innovativeness and management strategies commerce by using structural equation model of statistical analysis. A number of path analyses were conducted to indicate the impact of different factors.
ribution License, which permits unrestricted use,
or intermediaries such as web-based marketplaces, and an integration of technologies with modestly redesigned processes
for order handling, purchasing or customer service (Davis et
business includes e-commerce, it also covers internal processes such as production, inventory management, product development, risk management, finance, knowledge management and human resources (Davies, 2004). business strategies are more complex, more focused on internal processes and are aimed at improvements in efficiency,
productivity and cost savings (Bergeron et al., 1990). So,
e-business enables an enterprise to reach the global customers. In to extend their sales platforms to a futuristic dimension, business houses have incorporated software that can
run on platforms offered by the World Wide Web (Bergeron et
. According to the current theory, both e-commerce these processes in addition to managing technological infrastructure of databases, application servers, security tools, systems management and legacy systems . And both involve the creation of new value chains between a company and its customers and suppliers as well as within the company itself. A wise company may decide to consolidate its gains and complete the work involved in its existing and largely separate e-commerce, ERP, chain initiatives before making the big leap to Agarwal and Prasad, 1997). marketer’s data research, in 2012 e-commerce sales topped $1 trillion for the first time in the history. Among
INTERNATIONAL JOURNAL OF CURRENT RESEARCH
emerging economies, China's e-commerce presence continues to expand every year. With 384 million Internet users, China's online shopping sales rose to $36.6 billion in 2009, and one of the reasons that behind the huge growth has been the improvement in shoppers’ trust (China Internet Watch, 2014). The Chinese retailers have been able to help consumers feel more comfortable shopping online. China's cross-border e-commerce is also growing rapidly. E-e-commerce transactions between China and other countries increased 32% to 2.3 trillion yuan ($375.8 billion) in 2012 and accounted for 9.6% of China's total international trade. In 2013, Alibaba had an e-commerce market share of 80% in China (China Internet Watch, 2014). B2C e-commerce sales share increased from 27.9% to 39.7% in Asia-Pacific while in all other areas they did not decrease or increase much. Economists have theorized that e-commerce will lead to intensified price competition, as it increases consumers' ability to gather information about products and prices. Researchers have found the growth of online shopping also affecting the industry’s structure in two areas that have seen significant growth in commerce:
e-bookshops and travel agencies (Fredriksson, 2013). In general,
larger firms are able to use economies of scale and offer lower prices. The lone exception to this pattern has been the very smallest category of booksellers, shops with 1-4 employees, which appear to have withstood the trend. Online selling activities have been very experimental to date, without a sufficient amount of data generated to provide conclusive results. However, important issues have emerged that can be identified for the purpose of promoting future discussion and analyses. These issues vary according to the organization in question, the type of products it sells online, online selling patterns, online customer base, approach to online selling and resource expansions (Davies, 2004).
History
Hassan (Hassan and Stephen, 2005) describes segmenting as the process of dividing the market into segments based on customers’ characteristics and needs. The main segmenting activity consists of four parts: determining who the actual and potential customers are, identifying segments, analyzing the intensity of competitors in the market, and selecting the attractive customer segments. It is well known that a company is almost never alone in a market-- competitors have a great influence on a business’s motivation to enter a certain market. When there is a high intensity of competition, it is so hard to obtain a profitable market that a company may decide not to enter a certain market. The third step of segmenting is the first part of a competitor analysis. The need for segmenting a market often arises from the fact that no markets are homogeneous. For a given product, the market can be divided into different customer groups. Many e-commerce platforms adopted by Alibaba and Amazon will be compared and contrasted. In B2B e-commerce, Alibaba has solved the one problem Amazon can't. In the platform of Alibaba’s wholesale market, people everywhere can get access to the Chinese supply chain, through Alibaba.com and 1688.com. This means tinkerers, builders, entrepreneurs and small business operators can order custom motors and parts from Chinese factories without having to travel there, find a scout, and forge a relationship with a manufacturer before doing business. It opens up the world of Chinese suppliers to people who wouldn’t normally have access to it. They can now buy in bulk through Alibaba, which acts as a trusted third party, vouching
for the transaction (Min et al., 2008). Alibaba’s advantage
comes from its proximity to so many of the world’s
manufacturing assets (Chen et al., 2013). Alibaba’s wholesale
revenue in fiscal 2014 was $1 billion, versus $8 billion from its retail operations (China Internet Watch, 2014). The company processed a total of $296 billion’s worth of sales on its platform in its last full fiscal year. Different e-commerce strategies adopted by Alibaba and Amazon will be reviewed. Alibaba’s business model is not capital intensive. For their last reported financial years, Amazon (December 2014) and Alibaba (March 2015) both generated nearly $6 billion cash from operations. Amazon spent more than $4 billion of this cash in capital expenditure, which was primarily towards developing additional capacity for its operations. Of this, $500 million was spent towards internally used software and website development. Alibaba, on the other hand, spent only $769 million on capital expenditure in the fiscal year of 2014 (China Internet Watch, 2014). Since Alibaba’s capital expenditure is primarily on its technological platforms, it is much lower than that of Amazon.
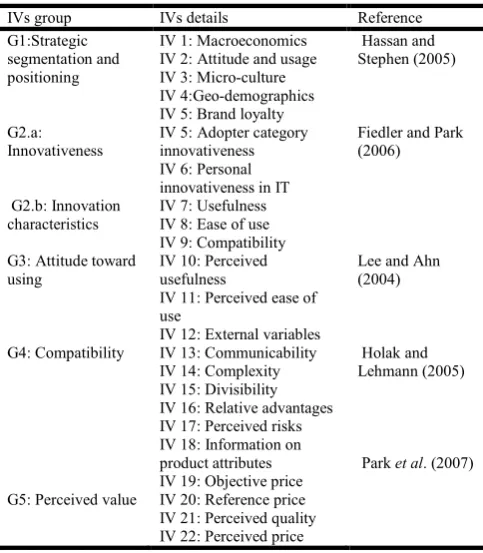
[image:2.595.312.554.367.644.2]Based on the foregoing literature review, a list of independent variables and depend variables has been identified and summerized on Table 1.
Table 1. Independent and Dependent Variables of the Present Study
IVs group IVs details Reference G1:Strategic
segmentation and positioning
IV 1: Macroeconomics IV 2: Attitude and usage IV 3: Micro-culture IV 4:Geo-demographics IV 5: Brand loyalty
Hassan and Stephen (2005)
G2.a: Innovativeness
G2.b: Innovation characteristics
IV 5: Adopter category innovativeness IV 6: Personal innovativeness in IT IV 7: Usefulness IV 8: Ease of use IV 9: Compatibility
Fiedler and Park (2006)
G3: Attitude toward using
IV 10: Perceived usefulness
IV 11: Perceived ease of use
IV 12: External variables
Lee and Ahn (2004)
G4: Compatibility
IV 13: Communicability IV 14: Complexity IV 15: Divisibility IV 16: Relative advantages IV 17: Perceived risks
Holak and Lehmann (2005)
G5: Perceived value
IV 18: Information on product attributes IV 19: Objective price IV 20: Reference price IV 21: Perceived quality IV 22: Perceived price
Park et al. (2007)
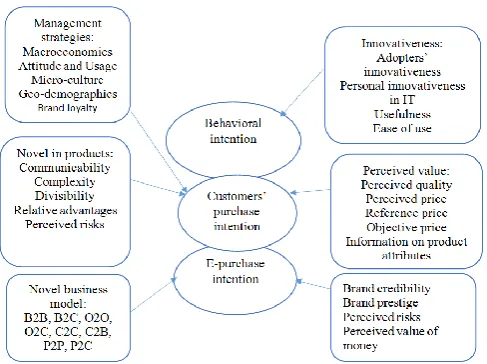
New Model
Figure 1. A Conceptual Model of E-Purchase Intention
Methods
Conceptual Model
As previously mentioned, in addition to the detected associations between the independent and dependent variable groups, it was assumed that there were some relationships among the variables in the existing models and those generated from the qualitative interviews, such as the novel business. This assumption has reflected in a new conceptual model in Figure 2.
Figure 2. A Conceptual Model of E-Purchase Intention
Quantitative Analyses: Structural Equation Modeling
An SEM with latent variables is composed of three sets of simultaneous equations, estimated concurrently: a measurement model (or sub-model) for the endogenous (dependent) variables, a measurement sub-model for the exogenous (independent) variables, and a structural sub-model, all of which are estimated simultaneously (Arbuckle and Wothke, 1995). This full model is seldom applied in practice. Generally, one or both of the measurement models are dropped. A SEM with a measurement model and a structural model is known as
SEM with latent variables (Brace et al., 2006). Alternatively,
one can have structural model without any measurement models, SEM with observed variables, or a measurement model alone (confirmatory factor analysis). In general, an SEM have any number of endogenous and exogenous variables.
SEM provides a test of the hypotheses more stringent than multiple regression analysis or path analysis as it enables the researcher to take account of complete information in a theoretical model and to search for appropriate models by the criteria provided by the goodness of fit in AMOS. The items for each dimension are averaged to create single indicators for each latent variable, considering the large number of parameters being estimated. Studies have shown that a corrected single-indicator model produces parameter estimates that are virtually identical to those produced by a pure latent-variable analysis (Featherman and Pavlou, 2003). An important distinction in SEM is one between direct effects and total effects. Direct effects are the links between a productive variable and the variable that is the target of the effect. Each direct effect corresponds to an arrow in a path (flow) diagram (Byrne, 2001). An SEM is specified by defining with direct effects are present and which are absent. With most modern SEM software, this can be done graphically by manipulating path diagrams. These direct effects embody the causal modeling aspect of SEM. Total effects are defined to be the sum of direct and indirect effects, where the latter represent the sum of all of the effects along the paths between the two variables that involve intervening variables (Ho, 2006). The total effects of the exogenous variables on the endogenous variables are sometimes knows as the coefficients of the reduced form equations.
The general SEM system is estimated by covariance (structure) analysis, whereby model parameters are determined such that the variances and covariance of the variables implied by model system are as close as possible to the observed variances and covariance of the sample. In other words, the estimated parameters are those that make the variance-covariance matrix predictable by the models as similar as possible to the observed variance-covariance matrix while respecting the constraints of the model (Byrne, 2001). Covariance analysis appears at first to be quite different from least-square-regression methods, but it can be viewed as an extension of least squares into the realm of latent variables, error-term covariance, and non-recursive models (i.e. models with feedback loops). In some simple cases, a covariance analysis is identical to least squares (Soper, 2010). As previously mentioned, variables with factor loadings lower than. 3 were deleted from the model. Six groups were explored for this study. A formal questionnaire was developed from the results of the pilot study. SPSS 22 and Amos 19 statistical software were adopted for data analyses. The questionnaires were fit for further inquiries. Six groups were explored for further inquiries. The conceptual model was revised, with 47 variables from interviews and literature reviews being retained for further inquiries. The conceptual model was revised, with 47 variables from interviews and literature reviews being retained for further inquiries. Since principal-components analyses are typically exploratory, the researcher must determine the appropriate number of components to retain. Four criteria are used in this decision making process:
Eigenvalue: Components with eigenvalues greater than 1
should be retained. This criteria is fairly reliable when the number of variables is < 30, when communalities are > .70, when the number of individuals is > 250, or when the mean communality is > = .60;
Variance: The researcher should retain components that
[image:3.595.40.284.410.573.2]Screen plot: The researcher should retain all components within the sharp descent, before eigenvalues level off. This criterion is fairly reliable when the number of individuals is > 250 and communalities are > .30.
Residuals: The researcher should retain the components
generated by the model if only a few residuals exceed .05. If several reproduced correlations differ, it may be necessary to include more components.
The appropriate number of components to retain has to be determined first and foremost. After that, the researcher must then interpret/name the components by evaluating the type of variables included in each factor, the strength of factor loadings, and the direction of factor loadings.
H1: The identified factors of innovativeness (adopted innovativeness, personal innovativeness in IT, usefulness, ease of use, compatibility), management strategies (macroeconomics, attitude and usage, micro-culture, geo-demographics), novel in products (communicability, complexity, divisibility, relative advantages, perceived risks), novel business model (B2B, B2C, O2O, O2C, C2C, C2B, P2P, P2C), reference value (brand credibility, brand prestige, perceived risks, perceived value of money) will contribute to e-purchase intention.
H2: There are relationships among adopted innovativeness, personal innovativeness in IT, usefulness, ease of use, compatibility and sustainability.
H3: There are relationships between novel performance (e.g.,
communicability, complexity, divisibility, relative
advantage, perceived risks) and sustainability.
H4: There are relationships between management strategies (e.g., macroeconomics, attitude and usage, micro-culture, geo-demographics) and sustainability.
H5: There are relationships between innovativeness (e.g., adopted innovativeness, personal innovativeness in IT, usefulness, ease of use, compatibility) and management strategies.
H6: There are relationships between novel performance (e.g.,
communicability, complexity, divisibility, relative
advantages, and perceived risks) and perceived value of quality, price, etc.
H7: There are relationships among perceived value of quality, price and management strategies.
H8: There are relationships among reference values (e.g., brand credibility, prestige, and loyalty to management strategies).
H9: There are relationships among perceived value of quality, price, reference value of brand credibility, prestige, loyalty, etc.
H10: There are relationships among perceived value, quality, price, validity, perceived language, perceived life cycle, and e-purchase intention.
H11: There are relationships between management strategies and e-purchase intention.
H12: There are relationships among reference values of brand credibility, prestige, value of money, and e-purchase intention.
Testing Hypothesis 2, for example, would involve the following:
Independent variables (IVs): Sustainability: sustainable
development, technological innovation, awareness.
Dependent variables (DVs): Adopted innovativeness,
personal innovativeness in IT, usefulness, ease of use, compatibility.
SEM path analysis
Since groups in factorial path are created by two or more factors or independent variables, it is important to determine if factors are interacting (working together) to affect the dependent variable. Typically, a line plot is created to graphically display any factor interaction. If lines overlap and crisscross, factor interaction is present. Although a line plot may reveal some factor interaction, the path results may show that the interaction is not statistically significant. Consequently, it is important to determine interaction significance using the F ratio and p level for the interaction generated from the factorial test. If factors significantly interact such that they are working together to affect the dependent variable, one cannot determine the effect that each separate factor has on the dependent variable by looking at the main effects. Although the main effects may be significant even when the factor interaction is significant, caution should be used when drawing inferences about the factors’ main effects. Effect size should also be
analyzed to determine the strength of such effects (Kim and
Benbasat, 2003). In summary, the first step in interpreting the factorial path results is to determine if an interaction is present among factors by looking at the F ratio and its level of significance for the interaction. From the foregoing tables and figures, it is clear that there is no significance, so the hypothesis had to be rejected.
H3: There exist relationships between novel performance (e.g., communicability, complexity, divisibility, relative advantages, and perceived risks) and sustainability. IVs: Sustainability (e.g., sustainable development, technology
innovation, awareness).
DVs: Novel performance (e.g., communicability, complexity, divisibility, relative advantages, perceived risks and sustainability).
The readers should note that the example of a results summary will not include these descriptive statistics due to space limitations. The overall regression results are summarized with the identified variables in the model: R ², R² adj, F and p values, with degrees of freedom. If a step approach has been utilized, one may need to report each step (R ², R² adj, R ² change, and level of significance for change) within a table. A summary of the regression model is presented in the table of model fit. In addition, bivariate and partial correlation coefficients between each predictor and the dependent variable are presented in the same table. Finally, one may need to report the B weight, beta weight, bivariate correlation coefficients and partial correlation coefficients of the predictors with the DC in a table. Alternatively, the researcher may report the prediction
equation, either standardized or unstandardized (Oppenheim,
1994).
RESULTS
respondents were approached through acquaintances. Although the sample was selected on a convenience basis, there were several benefits from this sampling technique. First, the rate of response was greater than that of a typical mail survey. Second, about two-thirds of the sample was not anonymous, and the dataset was controlled. The lack of anonymity was conducive to the quality of data while ensuring that the appropriate individuals in the industry would actually complete the survey. Third, to keep the present study manageable, the samples had to be restricted to manufacturing companies only. Furthermore, through Survey Company questionnaires were sent to the online shoppers, of whom 100 were online shop owners while another 100 were online customers. According to SurveyMonkey.com, drop-off surveys’ return rate with 40 questions is 8%-10%. Thus, 1,250 surveys were sent to randomly selected individuals. About 100-125 questionnaires were expected to be collected from online store owners and shoppers. Also conducted were face-to-face interviews with online shoppers who had experiences with both Alibaba and Amazon. On hundred questionnaires are expected to be collected from these respondents. Altogether, 223 online shoppers, owners, vendors, and managers at e-commerce companies were to be involved into this survey.
The KMO Test
Brace, Kemp, and Snelgar (2006) stated that the more responses are collected, the more likely they will be to underlie the measured variables and that the minimum and sensible sample size for an exploratory factor analysis is about 200. The number of effective questionnaires in the present study was 233, which was over the expected minimum. Therefore, the sample size for the present study was sufficient. The Kaiser-Meyer-Olkin index (KMO) is a test of the amount of variance
within the data that could be explained by the factors (Brace et
al., 2006). A KMO value of .5 is poor; .6 is acceptable while a
value closer to 1.0 is perfect. According to Kaiser (Kaiser,
1974), a KMO greater than .8 is ideal for EFA. In the present study, it was .912 (Table 2), which was suitable to conducting EFA. In addition, if a KMO value is greater than or equal to .5, and if the Barlett’s score is significant at p < .005, the tested variables are correlated, and the exacted principal factors are
considered valid and reliable (Hair et al., 1998).
Structural Equation Model and the Hypotheses
Initially, a researcher may test a model by using structural-equation and goodness-of-fit tests to determine if the variance-covariance structure in the data is consistent with what is specified in a conceptual model. Then, the alternative-models approach entails comparing two or more causal models to determine which has a better fit. Finally, the model-development approach is a combination of confirmatory and exploratory approaches. When a model is found to be deficient, the researcher may resort to an alternative model that is based on changes suggested by a combination of a substantive theory and SEM’s modification indexes. SEM has two advantages over a regression analysis. First, it can estimate the actual measurement errors through a confirmatory factor analysis
[image:5.595.172.436.350.392.2](CFA). Second, it accommodates in a one-path model multi-item scales as latent and multiple variables (Ho, 2006). In the present study, the first step toward testing the hypotheses is to examine the overall fit of the structural model as proposed. If this model did not show a good fit, individual regression paths could not be considered meaningful, and a better-fitting model would need to be identified. According to Arbuckle and Wothke (Arbuckle and Wothke, 1995), goodness-of-fit tests can help researchers determine if the model being tested should be accepted or rejected. These overall-fit tests cannot be used to prove that particular paths within the model are significant. If the model is accepted, the researcher will then go on to Table 2. KMO and Barlett’s Test in EFA
Kaiser-Meyer-Olkin measure of sampling adequacy .912 Bartlett's test of sphericity Approx. chi square 8207.425
df. 2103.000
Sig. .000
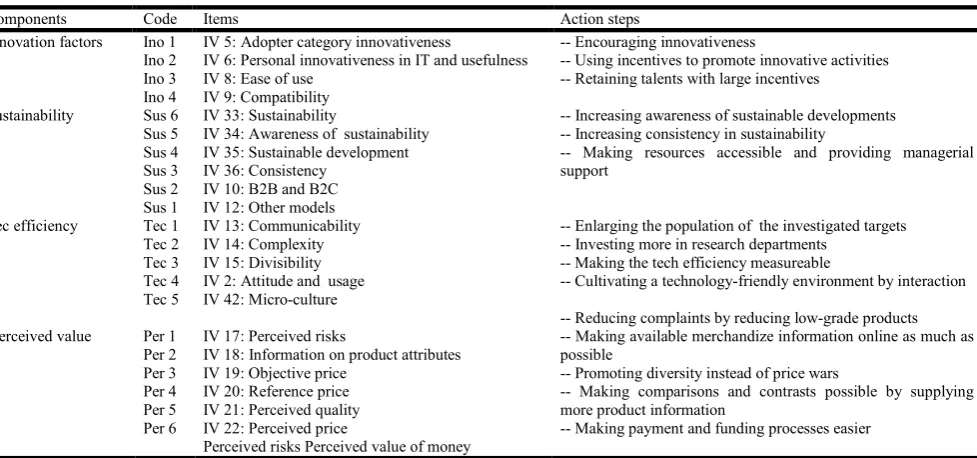
Table 3. A Summary of the Action Steps
Components Code Items Action steps Innovation factors
Ino 1 Ino 2 Ino 3 Ino 4
IV 5: Adopter category innovativeness
IV 6: Personal innovativeness in IT and usefulness IV 8: Ease of use
IV 9: Compatibility
-- Encouraging innovativeness
-- Using incentives to promote innovative activities -- Retaining talents with large incentives
Sustainability
Sus 6 Sus 5 Sus 4 Sus 3 Sus 2 Sus 1
IV 33: Sustainability
IV 34: Awareness of sustainability IV 35: Sustainable development IV 36: Consistency
IV 10: B2B and B2C IV 12: Other models
-- Increasing awareness of sustainable developments -- Increasing consistency in sustainability
-- Making resources accessible and providing managerial support
Tec efficiency
Tec 1 Tec 2 Tec 3 Tec 4 Tec 5
IV 13: Communicability IV 14: Complexity IV 15: Divisibility IV 2: Attitude and usage IV 42: Micro-culture
-- Enlarging the population of the investigated targets -- Investing more in research departments
-- Making the tech efficiency measureable
-- Cultivating a technology-friendly environment by interaction
Perceived value
Per 1 Per 2 Per 3 Per 4 Per 5 Per 6
IV 17: Perceived risks
IV 18: Information on product attributes IV 19: Objective price
IV 20: Reference price IV 21: Perceived quality IV 22: Perceived price
Perceived risks Perceived value of money
-- Reducing complaints by reducing low-grade products -- Making available merchandize information online as much as possible
-- Promoting diversity instead of price wars
-- Making comparisons and contrasts possible by supplying more product information
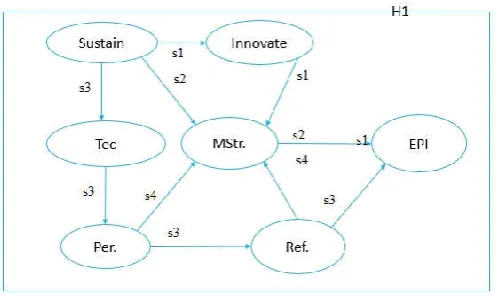
[image:5.595.59.548.421.650.2]interpret the path coefficients in it. At the second step, the ten hypotheses developed were tested using the standardized regression coefficients, which were preferable because they were independent of the units of measurement and were not affected by the choice of the identification constraints.
Figure 3. The Overall Model in Steps
Conclusion
This overall model and the four steps has provided answers for Research Question in the present study in Figure 3. The inter-correlations among the factors were determined by their direct, indirect and total effects. The four steps in Figure 5-1 were produced from the analyses of the inter-correlations among the identified factors. The effects of the four steps were accounted for when developing measuring scales of the impact of the various factors on e-purchase intention. A strong effect represents a close inter-correlation. The sequence of steps and variables shown in Table 3 will provide answers for different questions. The descending order of variables in the table was based on the discussion of all detailed models. Variables on the top layers of this table have a greater impact on e-purchase intention. A detailed analysis will be given in the following paragraphs. The present study has showed many important
implications to the research community, it has identified main
factors that will contribute to e-purchase intenion and provided an empirical rationale for managers to seriously consider these factors.
The present study was initially informed by the literature of purchase intention, has generated empirical support with a conceptual model that connects several factors and brought them to bear on behavioral intention. Moreover, the
interrelationships among the identified factors of
innovativeness (adopted innovativeness, personal
innovativeness in IT, usefulness, case of use, compatibility),
management strategies (macroeconomics, complexity,
divisibility, relative advantages, perceived risks), novel business model, reference value (brand credibility, brand prestige, perceived risks, perceived value of money) were further explored in the present. This report provides managers with meaningful information. Its results underlie a framework that encompasses the interrelationships among those important variables and help managers determiine which factors to focus on in efforts to enhance shoppers’ purchase intention. It will also bring to the attention of managers the interrelationships among the relevant factors that may be conductiveto marketing strategies targeting clients’ satisfaction.
REFERENCES
Agarwal, R. and Prasad, J. 1997. The role of innovation characteristics, and perceived voluntariness in the
acceptance of information technologies. Decision Sciences,
28(3), 557-582.
Arbuckle, J. L. and Wothke, W. 1995. AMOS 4.0 user's guide.
Chicago: Small Waters Corporation.
Bergeron, F., Rivard, S. and De Serre, L. 1990. Investigating
the support role of the information center. MIS Quarterly,
14(3), 247-259.
Brace, N., Kemp, R. and Snelgar, R. 2006. SPSS for
psychologists: A guide to data analysis using SPSS for
windows (2nd ed.). Mathwah, New Jersey: Lawrence
Erlbaum.
Byrne, B. N. 2001. Structural equation modeling with AMOS:
Basic concepts, applications and programming. Mahwah,
NJ: Lawrence Erlbaum Associates.
Chen J.C., Brandy W. Mariam, Wong L. 2013. Success of electronic commerce Web sites: A comparative study in two Countries, Information & Management 50, 344–355. China Internet Watch, 2014. A Glimpse at Chinese Internet
Giants’ 2013 Financial Statements Read more:
http://www.chinainternetwatch.com/7276/a-glimpse-at-chinese-internet-giants-2013-financial-statements/, Viewed Available on May 28, 2014.
Davies, B. P. 2004. E-Business. Palgrave, Basingstoke. 380-395, ISBN 1-4039-1348-X.
Davis, L. D., Bagoozzi, R. P. and Warshaw, P. R. 1989. User acceptance of computer technology: A comparison of two
theoretical models. Management Science, 35(8), 982-1003.
Featherman, M. S. and Pavlou, P. A. 2003. Predicting e-services adoption: A perceived risk facets perspective.
International Journal of Human-Computer Studies, 59,
451-474.
Fredriksson, T. 2013. Workshop on e-commerce, development
and SMEs: Conference on Trade and Development,
E-Marketer, 7, 24.
Hair, J. F., Anderson, R. E., Tatham, R. L. and Black, W. C.
1998. Multivariate data analysis with readings (5th ed.).
Englewood Cliffs, NJ: Prentice-Hall International.
Hassan and Stephen, 2005. Linking global market
segmentation decisions with strategic positioning options.
The Journal of Consumer Marketing, 22(2/3), 81-89.
Ho, R. 2006. Structural equation modeling: Handbook of
univariate and multivariate data analysis and interpretation
with SPSS. Boca Ration, FL: Chapman and Hall/CR
Kaiser, H. F. 1974. An index of factorial simplicity.
Psychological Measurement, 39(1), 31-35.
Kim, D. and Benbasat, I. 2003. Trust-related arguments in
Internet stores: A framework for evaluation. Journal of
Electronic Commerce Research, 4(2), 49-64.
Min, Q., Ji, S. and Qu, G. 2008. Mobile commerce user acceptance study in China: A revised UTAUT model.
Tsinghua Science & Technology, 13(3), 257-264.
Oppenheim, A. 1994. Questionnaire design, interviewing and
attitude measurement. Journal of Community and Applied
Social Psychology, 5(4), 371-372.
Soper, D. S. 2010. Statistics calculations. Retrieved, March 2012, from https:// www.daniesoper.com/statcalc/
Sun, Y. and Jeyara, A. 2013. Information technology adoption and continuance: A longitudinal study of individuals’
behavioral intentions. Information and Management, 50,
457-465.