ADVANCED MODEL PREDICTIVE TEMPERATURE CONTROL OF MULTIPHASE SYSTEM USING
*Bharathi, V., Avinash
Assistant Professor, EEE Department, Rajarajeswari College of Engineering, Bangalore
ARTICLE INFO ABSTRACT
In this paper a new technique that employs support vector machines (SVMs) and Gaussian mixture densities (GMDs) to create a
features. Future to rank the images according to how well they conform to the relevant features a feedback mechanism is also designed. The entire system is developed using LABVIEW
Finally the simulation results are presented to evaluate the performance of the proposed scheme.
Copyright © 2016 Bharathi et al. This is an open access article distributed under the Creative Commons Att distribution, and reproduction in any medium, provided the original work is properly cited.
INTRODUCTION
In many real world systems, large number of
constantly added to the database, requiring the algorithm to quickly tune itself to recent trends so it can serve queries more effectively. Moreover, the system need to be able to meet the demands of simultaneous queries from many users
paper the main aim is to built a algorithms intended to meet these requirements and give an extensive experiments evaluation. Initially a simple content based image retrieval (CBIR) system is designed. Automatic object recognition must be involved as CBIR requires the recognition of generic classes of objects. In this paper a LABVIEW based control of temperature for a process in a Plant makes it easier to develop and modify various control schemes for the process. Also a software based control shows that there is a high degree of convergence between the performances of the electronic hard wired PID controller, when both were utilized in closed temperature control. Hence it avoids any manual error due to hardwiring and also the designed parameter of cont
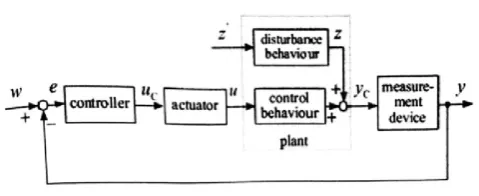
generalized block diagram of a closed loop system is given below:
*Corresponding author: Bharathi, V.
Assistant Professor, EEE Department, Rajarajeswari College of Engineering, Bangalore, India.
ISSN: 0975-833X
Article History: Received 24th October, 2015
Received in revised form 25th November, 2015
Accepted 09th December, 2015
Published online 31st January, 2016
Key words:
CBIR, SVM, GMD.
Citation: Bharathi, V., Avinash, C. M., Praveen M Koujalgi
system using lab- View technique”, International Journal of Current Research,
RESEARCH ARTICLE
ADVANCED MODEL PREDICTIVE TEMPERATURE CONTROL OF MULTIPHASE SYSTEM USING
LAB- VIEW TECHNIQUE
Avinash, C. M., Praveen M Koujalgi
and Praveen A Patil
Assistant Professor, EEE Department, Rajarajeswari College of Engineering, Bangalore
ABSTRACT
In this paper a new technique that employs support vector machines (SVMs) and Gaussian mixture densities (GMDs) to create a generative/discrimitive object classification techniques using local image features. Future to rank the images according to how well they conform to the relevant features a feedback mechanism is also designed. The entire system is developed using LABVIEW
Finally the simulation results are presented to evaluate the performance of the proposed scheme.
is an open access article distributed under the Creative Commons Attribution License, which distribution, and reproduction in any medium, provided the original work is properly cited.
In many real world systems, large number of images is constantly added to the database, requiring the algorithm to quickly tune itself to recent trends so it can serve queries more effectively. Moreover, the system need to be able to meet the taneous queries from many users. In this paper the main aim is to built a algorithms intended to meet xtensive experiments Initially a simple content based image retrieval (CBIR) system is designed. Automatic object recognition must requires the recognition of generic classes of objects. In this paper a LABVIEW based control of temperature for a process in a Plant makes it easier to develop and modify various control schemes for the process. Also a ere is a high degree of convergence between the performances of the electronic hard wired PID controller, when both were utilized in closed-loop temperature control. Hence it avoids any manual error due to hardwiring and also the designed parameter of controllers. The generalized block diagram of a closed loop system is given
[image:1.595.314.554.478.576.2]Assistant Professor, EEE Department, Rajarajeswari College of
Figure 1. Closed
Closed loop temperature control system
There are different types of controls can be designed especially for temperature control. In this paper the generic control strategies is the PID control algorithm .If PID controller is properly tuned, it will produce an
industrial process. The PID controller represents the ultimate in control of a continuous process for which a specific mathematical description (transfer function) cannot be written. To program the PID algorithm using higher
such as C, pascal or Forthan, the work will be easier and less error prone than when using assembly language. High level languages allow us to use floating point math. Negative numbers and overflows are handled automatically the above said requirements are satisfied in the software LABVIEW
Available online at http://www.journalcra.com
INTERNATIONAL
International Journal of Current Research
Vol. 8, Issue, 01, pp.25295-25299, January, 2016
Bharathi, V., Avinash, C. M., Praveen M Koujalgiand Praveen A Patil, 2016. “Advanced model predictive temperature control of multiphase International Journal of Current Research, 8, (01), 25295-25299.
ADVANCED MODEL PREDICTIVE TEMPERATURE CONTROL OF MULTIPHASE SYSTEM USING
veen A Patil
Assistant Professor, EEE Department, Rajarajeswari College of Engineering, Bangalore, India
In this paper a new technique that employs support vector machines (SVMs) and Gaussian mixture generative/discrimitive object classification techniques using local image features. Future to rank the images according to how well they conform to the relevant features a feedback mechanism is also designed. The entire system is developed using LABVIEW software. Finally the simulation results are presented to evaluate the performance of the proposed scheme.
ribution License, which permits unrestricted use,
Closed- loop system
loop temperature control system
There are different types of controls can be designed especially for temperature control. In this paper the generic control strategies is the PID control algorithm .If PID controller is
it will produce an acceptable control foremost The PID controller represents the ultimate in control of a continuous process for which a specific (transfer function) cannot be written. To program the PID algorithm using higher-level language, such as C, pascal or Forthan, the work will be easier and less error prone than when using assembly language. High level languages allow us to use floating point math. Negative numbers and overflows are handled automatically the above
uirements are satisfied in the software LABVIEW INTERNATIONAL JOURNAL OF CURRENT RESEARCH
which is an excellent representative of high level language. In LABVIEW the major advantage over conventional high level languages is the graphical user interface, which is built in, intuitive in operation and simple to apply. According to National Instruments productivity is better with LABVIEW than with conventional languages for a factor of (5-10) times compared with C on a small project.
Programming PID algorithm
In PID controller VI consists of four sub VIs: Proportional, Integral, Derivative and ∆t sub VIs:
T K e t K e t dt K de t out p I dv
Where e (t) is the error Kp, Ki, Kd are coefficients of
Proportional, Integral and Derivative actions respectively.
Proportional VI
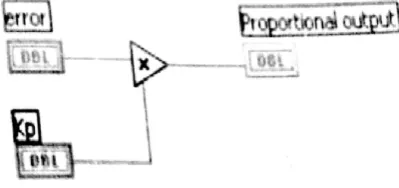
For proportional controller only, the following equation applies:
P=Kp e(t) (2)
In order to get the proportional action simply multiply the error e(t) by the constant of Proportionality action simply multiply
the error e(t) by the constant of proportionality (gain) Kp the
[image:2.595.71.271.419.513.2]block diagram is shown in Figure 2.
Figure 2. Block diagram of Proportional Action VI
Integral VI
The integral action is evaluated by using the trapezoidal method. The mathematical representation of the Integral action is as follows in Figure 3.
When the integral acting VI is called, the while loop executes once because the conditional terminal is connected to a Boolean constant (false). The error passes through the error control. The error value is added to the value of the value of the error from the past iteration. This is done by the shift registers. Then the value of the summation is divided by 2 and multiplied by the gain KI and sample time ∆t. After that, a Boolean value passes through control PID in range. This is to investigate heather the PID output limits are reached or not. If the Boolean value is true then it means that the PID output lies within its limits and the calculated value of integration is added to the previous values. If the Boolean value is false then the PID is saturated and the value at the output of the integral action must stay constant until the PID output is within the range again.
Derivative VI
The derivative action will be calculated by using the backward difference method, Figure 1.4. The block diagram of derivative VI is shown in Figure 1.5. The process variable passes to the VI through PV control. The past value of the process variable is subtracted from the current Pv Value, then the result is divided by the sample time ∆t and the final result after division is
multiplied with the derivative gain Kd. Using the select
function a condition to prevent the division by zero (in case that ∆t was zero) is included. If ∆t is lass or equal to zero for some reasons then a value of zero is passed to the Derivative action indicator.
∆t Virtual instrument
This VI is necessary to calculate the time period between every two samples (∆t). This VI is very necessary because it needed for real time control. It has only one output and it has no input. The tick count function returns the internal timer of the CPU in milliseconds. The reference time is undefined, so the tick count value cannot be converted to real world time. The timer value warps from (232-1) to zero. In the first iteration of the loop the tick count function gives the internal timer value, then the initial value stored in the shift register (which is equal; to zero in the first iteration) is subtracted from this value. The result is the time in millisecond elapsed between the first cal and the second call of this VI. After dividing this value by 1000, the result is in seconds. In the first call for this VI, the time difference between the first iteration and the previous one is the internal timer value.
Because of this value is not referenced to a known value, it is very large and is not a time true value, it must not be passed out. For this purpose a condition statement was developed by comparing this value to an arbitrary number which represents the maximum delay allowed if this value is larger than arbitrary number then it passes a number 0.01 that close to real value in the following iterations. If the value is smaller than this arbitrary number then VI passes the value which is right time difference. In the next iteration the value of this count gives the present internal timer value. By subtracting the previous value stored in the shift register from the present value of the tick cunt, we get the time elapsed between this iteration and past iteration, which is the time needed to execute the whole program once. In other words, it is the time between the first sample and next sample.
[image:2.595.66.267.617.757.2]Figure 4. Graphical Code for Temperature control simulation
Figure 5. Front Panel MIMIC Diagram
[image:3.595.147.442.640.780.2]Response of sofware P controller
Response of hardware P Controller
Complete PID VI
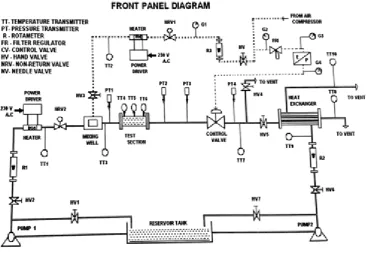
The PID Output is the sum of the outputs of the proportional, integral and derivative actions. The values of process variable (PV) and the error e(t) are passed to the PID VI through the PV and error controls. The output of the PID passes out through the PID output indicator. If the output of the PID within the range between upper limit and lower limit controls, then this values passes out at coerced(x) terminal and a true Boolean value at range. Terminal of the in range and coerce function. If the output of the of the PID VI is larger than the upper limit, then the value of the upper limit passes out and false passes to the shift register. But if the output of the PID VI is less than the lower limit, the value of the lower limit. Passes out and false value passes to shift registers. Here the Boolean value is used to prevent the integral wind up. The temperature control system is a laboratory experiment board manufactured by DELL RENZO Italy.
The board allows to experimentally investigating both the temperature measurements and closed loop temperature control. The board includes an electric over model, transducers and an electronic hard-wired PID controller. For comparison purpose, over temperature was controlled by the simulated PID (VI) and the built in electronic PID controller. Water from the reservoir is pumped into the heater and then to the mixer. While from the other end air from the compressor is heated and sent to the mixer. The mixture of air and water is sent to the test section where the temperature and pressure is measured .The mixture then passes through the control valve into the heat exchanger. Excess heat is removed according to the set point by the controller. The cycle is continued until the system becomes stable. The controller we considered is an auctioneering control and the other one is the sample PID control. The auctioneering control in LABVIEW is designed using some conditional statements.
Methods of measuring temperature
TT5 and TT6. The controlled outputs is measured from thermocouple TT7.The temperature measured is fed to the thermocouple module (NI-9211) placed in the DAQ. The DAQ is connected to the computer through a USB fort. The input which enters into the computer is processed and the controlled output reaches the analog output module via the cDAQ-9172.This output is fed to the control valve via I/P converter.
Conclusion
In this paper the data acquisition sing NI-cDAQ-9172 by replacing the wires present in the two phase system with single-stranded wires, in order to reduce the cost. Also a controller is designed to the current to pressure converter in order to control the temperature of the system. All the acquisition and controller design were made using the user friendly software LAB VIEW. By using LAB view controls, indicators and block diagram functions, a graphical PID controller was designed and tested.
REFERENCES
Berg V., H, Fuzzy Logic: A clear choice for temperature control, I&CS, vol.66, no.6, pp. 39-41.
Chia-Feng J., C.Jung-Shing, H.Hao-Jung, and Temperature Control by Hardware Implemented Recurrent Fuzzy Controller, ISN: 0-7803-8353-2/04, 795-799, 2004, IEEE.
Chin-Teng L., J. Chung-Ping, Temperature Control with a Neural Fuzzy Inference Network, IEEE Transactions on Systems, Man, and Cybernetics- Part C: Applications and Reviews, vol. 29, No. 3, 440-451, 1999.
Coeyman B., J.B. Bowles, Fuzzy Logic Applied to Recoiled Temperature Control, ISN: 0-7803-3643-3, 511-516, 1996, IEEE.
Gagandeep Kaur M., A. Chauhan, P.V.Subramanyam, Fuzzy Logic Based Temperature Controller, ISN: 0-7803-9017-2/05, 492-495, 2005, IEEE.
Jonda S., M.Fleischer and H.Meixner, Temperature Control of Semiconductor Metal- Oxide Gas Sensors by means of
Fuzzy Logic, the 8th International Conference on Solid
State Sensors and Actuators, and Euro sensors IX, Stockholm, Sweden, June 25-29, 1995.
Knobloch J., T. Presberger, Optimization of an On-Chip Fuzzy Temperature Controller, ISN: 0-7803-3225-3-6, 382-386, 1996, IEEE.
LM35 Precision Centigrade Temperature Sensors, National Semiconductors, November 2000.
Mohd-Yasin F., A. Tio, M.S. Islam, M.I. Reaz, Fuzzy Logic Based Temperature Regulator for Industrial Application: Software and Hardware Approaches, ICSE 2004, Malaysia, 517-521, 2004.
Wilkinson, J. Additional Advances in Fuzzy Logic Temperature Control, ISN: 0-7803-3008-0, 2721-2725, 1995, IEEE.