ISSN Print: 2164-5167
DOI: 10.4236/ajibm.2018.88126 Aug. 30, 2018 1861 American Journal of Industrial and Business Management
An Online Productivity Measuring
and Analyzing System:
Proof-of-Concept
Bassim Shebeb
Applied Econometrics, Arab Open University, Aardhiya, Kuwait
Abstract
The principle aim of this applied research is to design and build up an Online Productivity Measuring and Analyzing System (OPMAS): Proof-of-Concept1 to
measure and analyze the economic growth and its major sources; the multi-factor productivity and multi-factor-intensity at the firm, sub-industry (ISC 2-digit), and industry levels. Special features of this applied research are the instantaneous productivity measuring and analyzing. In addition, it is devel-oping an educational and training HUB for productivity awareness and im-provements for both researchers and organizations. Thus, the HUB comes with a prompt measuring tools/models (OPMAS) of the economic perfor-mance; the multifactor productivity and singly-factor productivity growth of a firm using its one-year loss/profit statement or/and time series data. Besides to the hub’s prompt measuring of productivity, the firm will also be provided with an instant-reporting about its economic performance in-compression to its related industry at two different levels (2-digit and i-digit ISC). For exam-ple, a firm operating within Food and Beverages manufacturing industry, it will be compared with the performances of the Food and Beverages manu-facturing industry 2-digit ISC and with the performance of the overall Manu-facturing Industry, D-ISC. Furthermore, a simulation model (Productivity Analytics) for investigating the impact of various policies on the firm’s eco-nomic performance could be proposed. The policies which they could be analyzed including environmental regulations, import and export taxes, and the provision of infrastructure.
Keywords
Economic Growth, Multifactor Productivity, Labor Productivity, Proof-of-Concept, Online Productivity Measurement System
1https://www.productivityanalytics.org/ How to cite this paper: Shebeb, B. (2018)
An Online Productivity Measuring and Analyzing System: Proof-of-Concept. Amer-ican Journal of Industrial and Business Management, 8, 1861-1878.
https://doi.org/10.4236/ajibm.2018.88126
Received: May 23, 2018 Accepted: August 27, 2018 Published: August 30, 2018
Copyright © 2018 by authors and Scientific Research Publishing Inc. This work is licensed under the Creative Commons Attribution International License (CC BY 4.0).
http://creativecommons.org/licenses/by/4.0/
DOI: 10.4236/ajibm.2018.88126 1862 American Journal of Industrial and Business Management
1. Introduction
The rapid pace of globalization resulting from free flow of trade and capital around the globe has intensified the competition among nations. This is after the implementation of new and updated trade agreements that emphasized open-ness and competition. Firms that enjoy competitive advantage are the winners in today’s economic arena. However, firms which are lacking in-part any competi-tive advantage will be under the mercy of foreign aids and are threatened to lose their independence. These firms will be also subject to all kinds of disorder and political unrest. Therefore, competition (high level of productivity growth) is the name of the game that any firm must strive to win it.
Productivity on the other hand, is the major contributor to competitiveness and can be taken as an indication of the firm’s ability to stay in line with new economic order and survive in face of the international harsh competition. Competitiveness and productivity, however, remained a neglected issue for some firms. This negligence is due to that these firms are getting some types of gov-ernment subsidies to enable them to continue with their poor level of productiv-ity growth. Thus, the heat of competition in the world economy has not yet been felted. Thus, given the new state of globalization, producers and industries need to continuously improve their competitiveness/productivity in the local and in-ternational markets. There are a number of arguments which support the view that productivity measurement and analysis are of particular importance to the future survival [1].
Productivity2 growth is considered to be one of the major factors contributing
to overall economic growth. It is also an important key to enhance competitive-ness at all economic levels (i.e., economy, economic sector, industry, firm and/or farm). This research comes at a very critical stage where cut-throat competition in world trade endangers the economic stability and survival of many firms. It comes to address the analytical measurement issues with respect to the decom-positions of the output growth and of the partial productivity measure, i.e. la-bour productivity.
Thus, I am building up an online productivity measuring and analyzing sys-tem: Proof-of-Concept to measure and analyze the output, production factors, multifactor productivity, single (i.e., labor and capital) productivity growth rates. In addition, it investigates the interrelationship between economic, labor prod-uctivity, and multifactor productivity at both firm and ISIC 2-digit industry le-vels. This research has the following folds:
1) to provide an instant report that investigates the competitiveness of a firm as measured by its productivity and compared to its industry, using time series data.
2) using one-year loss/profit sheet to provide an instant report that investi-gates the competitiveness of a firm as measured by its productivity and com-pared to its industry.
DOI: 10.4236/ajibm.2018.88126 1863 American Journal of Industrial and Business Management 3) to provide some recommendations that would help firms’ official (decisions makers) to improve the performance of his/her firm within its related industry and increase its productivity and competitiveness.
4) Researcher also could utilize the facilities and get an instant measurement of productivity growth rate as they upload their data file.
This study is organized in the following way. Section 2 presents an overview on Productivity Studies. The Productivity Measurement Methodology is dis-cussed in Section 3. Section 4 shows the required data set for the production function based empirical model. Section 5 presents the technical based as proof-of-concept for proposed the Online Productivity Measuring and Analyz-ing System. Overall Remarks and Future works are stated in Section 6.
2. Productivity Studies: An Overview
Analytically, the problems of productivity and economic growth measurements have been overcome by the recent developments in productivity measurement models, [2]. One of these developments is the application of aggregation and in-dex number theories that are exploited in productivity studies. The development of econometric specifications and the use of more “flexible” functional forms in estimation of the underlying production technology are also regarded as impor-tant advances utilized by productivity studies. Therefore, it is needless to say that the decomposition of multifactor productivity has encouraged recent efforts to modify the standard “traditional” accounting type measure of economic perfor-mance indicators and especially that of productivity growth [3].
Productivity is generally defined in terms of an efficient use of a given level of the factors of production to be transformed into the highest possible level of output. The single-factor productivity measure, expressing output as a ratio of a single production factor, has the advantage of simplicity of calculation. However, if a single-factor measure of productivity improves, it may not necessarily be the case that the overall productivity has improved. The single-factor productivity, say labor productivity, also has some disadvantages which it generates serious interpre-tation problems. These problems may be summarized as: 1) the difficulty of identi-fying the causal factor which is responsible for the growth of inputs and/or output; and 2) it does not reflect overall productivity change which is an important key element for the competitiveness of the industry (or firm) under consideration.
The index number measurement approach to productivity growth is one of the most common approaches in productivity studies. It is based on construc-tion of a ratio of aggregated unit of output divided by the quantity of a single input (labor). This measure is usually normalized to a base period of time. Fur-thermore, under the assumption of constant returns to scale and Hicks neutrali-ty of technological change, production technology could be presented in an in-dex-number framework.
DOI: 10.4236/ajibm.2018.88126 1864 American Journal of Industrial and Business Management growth accounting approach. Economic index number theory has been exploited to compute an index of productivity growth. The simplicity of this measure is a result of several strong assumptions that have been imposed in its derivation.
The research works on the theory of the exact and superlative index numbers have overcome many measurement and interpretation issues in output and in-put aggregations. It followed that another important development in productiv-ity measurement has been made in the context of the index number approach. Researchers had extended this approach to incorporate and identify a number of economic factors which might affect firm behavior and productivity growth [4]. It is worth noting that the implicit or sometimes explicit assumption that production factors are instantaneously adjusted in the short-run is another dis-tinct area of the most recent development in productivity measurements. This assumption implies that all production factors are fully utilized. Another implicit assumption that productivity studies usually make is that all producers are tech-nically efficient. The assumptions underlying the use of this approach are con-stant returns to scale of the underlying production technology, competitive equi-librium in both output and inputs markets and Hicks neutrality of technological change. It also implicitly assumes instantaneous adjustment of the quantities of inputs—all production factors are fully utilized and all producers are technically (cost) efficient.
It follows that the measure of productivity should be regarded as a composed measure of a number of economic behaviors that are important pieces of the overall economic performance puzzle. Identifying and measuring these compo-nents of overall productivity help to provide a more accurate and interpretable measure of economic performance. That is, the observed change in overall productivity (residual) could be a result of various economic interactions in the production process, including technical change, scale economies, and changes in capacity utilization and inefficiency3. However, due to unavailability of the
ne-cessary data for a firm/industry, a full structural model that takes into account the contribution of the major components of the overall productivity change would not be possible to be utilized. A relatively simple (restricted)4 model will
be utilized in measuring and analyzing multifactor productivity and labor prod-uctivity growth rates. This simple method could be used in case studies of other countries given the similar data limitation.
3. Productivity Measurement Methodology
For the simplistic understanding a restricted5 growth accounting model is used
in measuring and analyzing productivity growth. A growth accounting method 3It follows that if any of these major economic aspects of the production process is ignored, the re-sulting estimates of productivity are likely to have measurement bias.
DOI: 10.4236/ajibm.2018.88126 1865 American Journal of Industrial and Business Management is used in deriving the measurement model of output, MFP, and labor produc-tivity growth rates. Conceptually, MFP indicates the change in output resulting from the shift of the production function. On the other hand, changes in inputs indicate that the change in output results from movements along the production function. Thus, given the main approaches in productivity and production mod-elling, the gross output approach is exploited in this study [5]. This complies with the fact that an analysis of productivity change in an open economy must be based on production function that contain all primary inputs (labor and capital) in addition to the intermediate inputs [6].
The general form of the firm/industry-level production function can be writ-ten as:
(
, , ,)
t t t t t
Q = f K L E M (1)
where Qtis the real output, At is the index of MFP (technical change), Ktis the
inputs of the capital services (flow), Ltis the labor inputs, Et is the energy inputs,
and Mt is the intermediate inputs, all in time period t.
Thus, differentiating the production function (1) with respect to time gives the growth equation, which can be written as:
d dQ t d dA t Q K td d Q L td d Q E td d Q M td d
Q A K K L L E E M M
∂ ∂ ∂ ∂
= + + + +
∂ ∂ ∂ ∂
(2)
This Equation (2) shows the rate of change of output as a sum of the rate of change in the MFP [(dA/dt)/A] and the weighted average of the rate of change in use of inputs.
Exploiting the models’ underlying assumptions, Equation (2) can reproduced as:
d d d d d d d d d d d d
K L E M
Q t A t S K t S L t S E t S M t
Q A K L E M
= + + + +
(3)
where Si = Xi/PQQ, where i = K, L, and M, Xi is the total payment to input (i),
and PQ is the price of output (Q). The model’s assumptions also imply that the
weights (shares) sum up to one that is [SK + SL+ SE + SM = 1].
Equation (3) is known as the Divisia index, with an index number framework and taking the (log) for the inputs and output index and with using the average inputs share, we can get the approximation of the Tornqvist index number as [7]:
(
1 1 1 1 1 1
log t log t log t log t log t log t
K L E M
t t t t t t
Q A S K S L S E S M
Q− A− K− L− E− M−
= + × + × + × + ×
(4) where: Si =0.5
(
Si t, +Si t, 1−)
It follows that MFP growth rate can be presented as:
1 1 1 1
1 1
,
1 1 , 1
MFP log log log log
log log
MFP log log log
t t t t
K L
t t t t
t t E M t t i t t t i
t t i t
A Q S K S L
A Q K L
E M
S S
E M
X
A Q
A Q
S
XDOI: 10.4236/ajibm.2018.88126 1866 American Journal of Industrial and Business Management This shows that MFP can be seen as the growth rate of output over and above the growth rate of all inputs6.
It follows that the relationship between the labor productivity and sources of its growth could be easily obtained and illustrated. The average labor productiv-ity (LP) is defined as the ratio of total output to labor input (Q/L). This average dependent on two factors:
1) the shift in production function; and 2) the intensities of other (not labor) inputs.
Now, let the average labor shares of output and each inputs be defined as fol-lows:
1) qt = Qt/Lt; the average output per unit of labor
2) kt = Kt/Lt; the average capital input per unit of labor
3) et= Et/Lt; the average energy input per unit of labor
4) mt = Mt/Lt; the average intermediate inputs per unit of labor
Then, the growth rate of labor productivity (LP) can be computed as the sum of the growth rate of MFP and the weighted growth rate of labor-factor (input) intensity, LFI.
1 1 1 1 1
,
1 1 , 1
LP log log log log log
LP log log log
t t t t t
K E M
t t t t t
i t
t t
i
t t i t
q A S k S e S m
q A k e m
x
q A S
q A x
− − − − − − − − = = + × + × + × = = +
∑
× (6)This shows that labor productivity growth rate can be seen as the growth rate of MFP over and above the growth rate of labor factor Intensities (LFI).
4. Data Required for the (OPMAS)
Output (Q): Output is measured in physical or real values. For products to be regarded as a homogeneous commodity (production in physical units) certain conditions should be satisfied. In this study, output is equal to the summation of the real values of the produced output.
Capital (K): The most preferred measure of capital input for productivity analysis is the flow of capital services used. The flow of capital services, which should in principle include the value, at current replacement cost, of the repro-ducible fixed assets used up during the year as a result of normal wear and tear. In practice, however, data are generally not available in the details required for the estimation of capital flow [8]. In this study the capital depreciation (in real terms) would be used as a measure of the flow of the capital service7.
Labor (L): The number of persons employed is defined as the total number of 6It follows that since the growth accounting model measure is defined as a non-stochastic and non-frontier based, no statistical test for its estimates can be conducted. That is, the significance of the measured growth rates and any other factor that potentially affects productivity growth cannot be verified.
DOI: 10.4236/ajibm.2018.88126 1867 American Journal of Industrial and Business Management persons who work in the establishment. Compensation is defined as comprising of all payments, both in cash and in kind. In this study the real value of com-pensation is used as a measure of labor input to take into account the difference in skill among workers assuming that there is a strong relationship between wages and the workers’ level of skill and experience.
Energy (E): Energy is measured in physical or real values. In this study, energy is equal to the summation of the real values of the energy and energy-related in-puts.
Intermediate-inputs (M): Intermediate-inputs are defined as equal to the real value of all production inputs, however, excluding the cost of labor (L), capital (K), and energy (E) inputs.
5. The (OPMAS) System Architecture/Design
As an implantation to the above productivity measurement and decomposing model, an Online Productivity Measuring and Analyzing System has been con-structed for two use cases; time-series data and profit/loss statements (balance sheet) [9].
The core model’s calculations of the OPMAS are implemented using Python; Python is a programming language works up more quickly and integrates to other systems more effectively for any scope of data analysis. However, the server-side programming language “PHP” was utilized for dynamic rendering of the data and the model’s reporting including the empirical results, tabulation, and imag-ing. Furthermore, for user (client)-side programming language, the HTML and JavaScript were utilized for an online user-friendly web-based interface.
Dia-gram 1 shows the system architecture of the Online Productivity Measuring and
Analyzing System, OPMAS.
5.1. The OPMAS: Use Cases
Reference to the System architecture of the Online Productivity Measuring and Analyzing System (Diagram 1), there multiple (group) of users. This section presents the available use cases in the OPMAS.
Diagram 2 is showing the different possible users of the OPMAS. Reference to
Diagram 2, users could be classified into three sorts:
1) non-registered non-member users. These users would be asked to register
DOI: 10.4236/ajibm.2018.88126 1868 American Journal of Industrial and Business Management
Diagram 2. The OPMAS: use cases.
to access the basic available services, i.e. the home page,
2) registered but non-member users. These users are having access to the basic available services, with an option to become members, and
DOI: 10.4236/ajibm.2018.88126 1869 American Journal of Industrial and Business Management Also, it is clearly shown in Diagram 2 that there are two use cases for mem-bers. These two use cases are; 1) “time-series” Online Productivity Measuring and Analyzing; and 2) “Static One-year” Online Productivity Measuring and Analyzing. These two cases are detailed and illustrated, respectively, in the use cases below.
5.2. OPMAS: Use Case 1—Time-Series Online Productivity
Measuring and Analyzing
This use case 1 is linked to the “time series” online productivity measuring and analyzing sub-system, as it is shown in the Diagram 2. Chart 1 shows that in use case 1, the user has to provide the system with the basic data which it needs to be filled-in using the system-dropdown menu. This basic data would include the following:
DOI: 10.4236/ajibm.2018.88126 1870 American Journal of Industrial and Business Management 1) the country in which the firm operates, for example, “Kuwait”
2) industry in which the firm operates, i.e., “Manufacturing, (D-Digit SIC)” 3) sub-industry in which the firm operates, for example, “Manufacturing of chemical and chemical products, (2-Digit SIC)”
Then, as it is also shown in Chart 1 that the user in use case 1 would also have the option to choice one of following three reporting levels:
1) Firm-to-Industry reporting;
this option would be selected by the user if he/she would like to relate the performance of his/her firm to the industry (economic sector) in which it oper-ates,
2) Firm Level reporting;
this option would be selected by the user if he/she would like to know the performance of his/her firm only with no relation or comparison to the industry (economic sector) in which it operates, and/or
3) Industry Level reporting; this option would be selected by the user if he/she would like to know the performance of the industry (economic sector) in which it operates only.
Once the basic information is keyed-in, the user would be asked to upload the firm’s time series data file8 if he/she did select any of options 1 or 2 above. It
fol-lows that as the required time series data file has been up-loaded, the basic mod-el would be applied to measure the growth rates of output, labor productivity, multi-factor productivity (MFP), and factor intensities in a Firm and industry. The results would be presented in two subtitles;
1) output growth and its sources of growth
2) labor productivity growth and the sources of its growth.
It follows that the OPMAS would produce its standard firm/industry repot as show in Figure 1. This OPMAS report includes two tables and seven self-explanatory charts. The first table (Table 1) of the OPMAS report would be showing a time-series decomposing of the annual gross output growth rate; the annual growth rate of the Multifactor productivity (MFP) and the annual growth rate of the factor intensity (FI) over the selected time periods for the firm. Table 1 also shows the annual average growth rates for the gross output and its main frag-ments; the Multifactor productivity (MFP) and the factor intensity (FI) over the selected time periods at firm and industry levels.
The second table (Table 2) of the OPMAS reporting would be showing the Decomposing of Labor Productivity Growth Rate; the annual and the average growth rate of the Multifactor productivity (MFP) and the annual and average growth rate of the labor-factors intensity (LFI) over the selected time periods for the firm. The second table also shows the annual average growth rates Multifac-tor productivity (MFP) and labor-facMultifac-tors intensity (LFI) at the industry level. For clear visual presentation these two tables are presented graphical into two Charts; Chart 1: Decomposing of Gross Output Growth Rate Chart 2: Decom-posing of Labor Productivity Growth Rate.
DOI: 10.4236/ajibm.2018.88126 1873 American Journal of Industrial and Business Management
Figure 1. Time-series online productivity reporting.
Furthermore, the OPMAS report includes addition five Charts to present clear comparison between firm and industry performance as listed below:
Chart 3: Annual Growth Rate of Multifactor productivity; It presents the an-nual assessments/comparison of the firm’s anan-nual growth rate of MFP relative to the annual growth rate of MFP of Kuwait Manufacture of chemical and chemical products of over the me period.
Chart 4: Annual Growth Rate of Factor-Intensity; It presents the year-by-year assessments/comparison of the firm’s annual growth rate of FI relative to the annual growth rate of FI of Kuwait Manufacture of chemical and chemical products of over the me period.
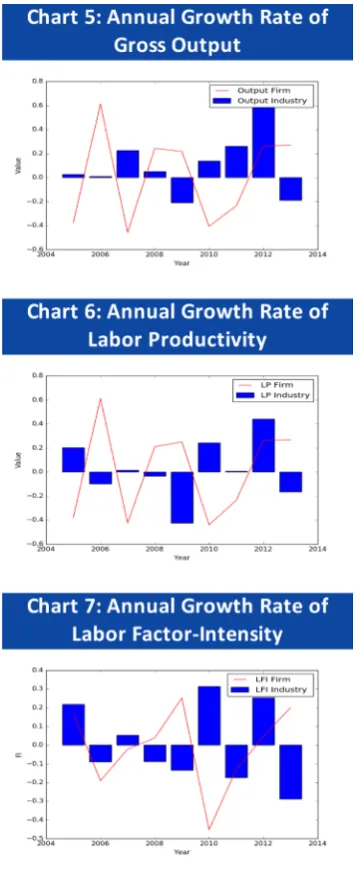
chem-DOI: 10.4236/ajibm.2018.88126 1874 American Journal of Industrial and Business Management
ical and chemical products of over the time period.
Chart 6: Annual Growth Rate of Labor Productivity; It presents the year-by-year assessments/comparison of the firm’s annual growth rate of LP rel-ative to the annual growth rate of LP of Kuwait Manufacture of chemical and chemical products of over the me period.
Chart 7: Annual Growth Rate of Labor Factor-Intensity; It presents the yearly assessments and comparison of the firm’s annual growth rate of LFI relative to the annual growth rate of LFI of Kuwait Manufacture of chemical and chemical products of over the me period.
5.3. OPMAS: Use Case 2—Static One-year Online Productivity
Measuring and Analyzing
The use case 2 is the “one-time period” subsystem of the online productivity measuring and analyzing sub-system, as it is shown in the Diagram 2. In Chart 2, the use case 2 is illustrated. It shows that for use case 2, users have to
DOI: 10.4236/ajibm.2018.88126 1875 American Journal of Industrial and Business Management provide the OPMAS with the core data that to be filled-in using the system-dropdown menu, as follows:
1) the country at which the firm operates, i.e., Kuwait 2) industry at which the firm operates, i.e., Manufacturing
3) sub-industry (2-Digit SIC) at which the firm operates, i.e., Manufacturing of chemical and chemical products
The above information is needed to enable the OPMAS System to provide the overall comparison between the firm’s productivity/performance and its coun-terpart of the industry in which it operates.
DOI: 10.4236/ajibm.2018.88126 1876 American Journal of Industrial and Business Management
Figure 2. Use case 2—static one-year online productivity reporting.
comparison between the firm’s productivity/performance and its counterpart of the industry levels in which it operates.
DOI: 10.4236/ajibm.2018.88126 1877 American Journal of Industrial and Business Management and interrelated instantly to the industry’s performance in which the firm oper-ates at the given year. It also comes with instant analysis which it is directed to the main key components of the firm’s overall performance.
6. Remarks and Future Works
The principle objective of this applied research is establishing Proof-of-Concept for an Online Productivity Measuring and Analyzing System (OPMAS). The significant outcome of this applied research was its unique online productivity measuring and analyzing and it’s potential to develop an online educational and training HUB for productivity awareness and improvements for both research-ers and organizations.
It also comes with its unique online measuring models of the economic per-formance (Multifactor and Single-Factor Productivity measuring and analyzing) of a firm using its profit/loss statement. In addition to the online-prompt mea-suring of productivity, the firm will also be provided with instantaneous report-ing about its economic performance in-compression to its related industry.
Furthermore, a simulation model (Productivity Analytics) for investigating the impact of various policies on the firm’s economic performance could be proposed and outlined. The policies that could be analyzed including environ-mental regulations, import/export taxes, and the provision of infrastructure.
Acknowledgements
I am grateful for Mr. Mohamed A. Nassar for his professional web developing and programming. I also would like to thanks with high appreciation Mrs. Eman Alsharif and Ms. Rasha Ani for their research assistances, supports, and for data collocations and entry.
Conflicts of Interest
The authors declare no conflicts of interest regarding the publication of this pa-per.
References
[1] Andrews, D., Criscuolo, C. and Gal, P.N. (2015) Frontier Firms, Technology Diffu-sion and Public Policy: Micro Evidence from OECD Countries. OECD Productivity Working Papers, No. 2, OECD Publishing, Paris.
[2] Byrne, D.M., Fernald, J.G. and Reinsdorf, M.B. (2016) Does the United States Have a Productivity Slowdown or a Measurement Problem? Brookings Papers on Eco-nomic Activity, Washington DC.
[3] Syverson, C. (2016) Challenges to Mismeasurement Explanations for the U.S. Productivity Slowdown. NBER Working Paper 21974.
[4] Diewert, W.E. (1976) Exact and Superlative Index Numbers. Journal of Econome-trics, 4, 115-145. https://doi.org/10.1016/0304-4076(76)90009-9
Kluw-DOI: 10.4236/ajibm.2018.88126 1878 American Journal of Industrial and Business Management er-Nijhoff Publishing, London. https://doi.org/10.1007/978-94-009-7406-7_3
[6] Hulten, C.R. (1978) Growth Accounting with Intermediate Inputs. Review of Eco-nomic Studies, 45, 511-518. https://doi.org/10.2307/2297252
[7] Diewert, W.E. and Nakamura, A. (2007) The Measurement of Aggregate Total Fac-tor Productivity Growth. In: Heckman, J.J. and Leamer, E.E., Eds., Handbook of Econometrics, Elsevier Science Publishing, Amsterdam, 4502-4530.
[8] Shebeb, B. (2016) Adjusted-Productivity Growth for Resource Rent: Kuwait Oil In-dustry. Applied Economics and Finance, 3, 128-135.
https://doi.org/10.11114/aef.v3i2.1386