Modern Network Analytics Architecture Stack to
Enterprise Networks
K. Palanivel1
1
Computer Centre, Pondicherry University, Puducherry – 605014, India.
Abstract: Analytics play a critical role in network operations in an enterprise network environment. Advanced analytics capabilities can support better capacity planning and traffic management in an enterprise network. A new generation of networks analytics tools and solutions comes into play, helping network providers optimize network builds and simplify network control and operations. There is no specific network analytics architecture stack has been proposed yet. Hence, it is proposed to design a network analytics architecture stack to an enterprise network environment. The proposed architecture stack offers a breadth of analytics solutions architecture that enable network providers to gradually adopt analytics. This has been designed with a set of architecture principles that are commonly accepted as best practices in the network industry. With this architecture, it strongly believes that it can improve agility, while at the same time having control over data integration and distribution.
Keywords: Network analytics, enterprise network, modern analytics architecture, analytics model.
I. INTRODUCTION
In enterprise networks, scalability is a considerable challenge, because the only way to keep up with the increase in network traffic and the growing number of networked applications and stakeholders. Network organizations need to cost-effectively scale the processing and storage of network data to accommodate performance tools, security and forensics systems, and to make that data available to other applications, while maintaining flexible control of their data and the underlying delivery architecture. One solution to scaling network data monitoring and management is to disaggregate the primary functions of the vertically integrated network tools, decoupling storage and processing from analytics. Deploying analytics applications independent of the processing framework would allow greater uniformity in how network data is handled, and prevent data from being unavailable outside of a single toolset.
The rapid prevalence and potential impact of data analytics platforms have sparked an interest amongst different practitioners and academia. Data analytics is a new data paradigm, which is called to transform the business management and decision-making. Thus, identifying which data sources are available, what type of data they provide, and how to treat these data is basic to generate as much value as possible for the company or organization. In this context, a data architecture adapted to the enterprise network domain and purpose of the organization contributes to systematize the process of generating value. This architecture should be capable of managing the complete data lifecycle in the network organization, including data ingestion, analysis and storage, among others. Data architectures designed for specific fields are being proposed in order to surpass the previously mentioned challenges and make the most of the data available with the aim of nowcasting and forecasting variables of interest.
A modern data architecture may still deliver a data warehouse, but a data warehouse is just one component of a modern data architecture or modern analytics ecosystem. Data architecture is not a data platform. A data platform consists of the underlying database engines (e.g., relational, Hadoop, OLAP) that process data as well as the data assembly framework that enables data engineers from IT and the business to create data sets for business consumption. The architecture properties essential for a modern data architecture [31) are scalability, extensibility, security, Administerability and separation.
A. Importance of Network Analytics
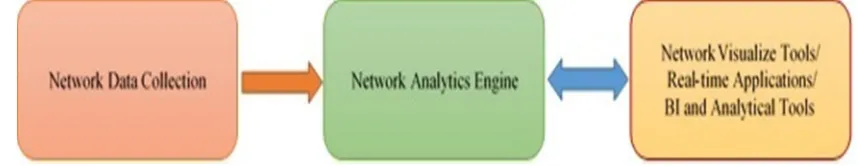
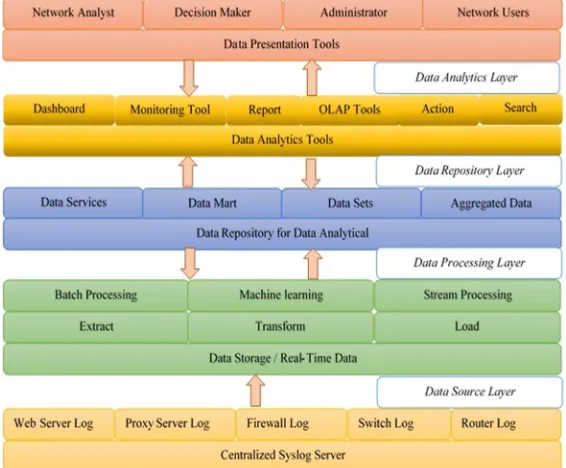
high-level view is then physically detailed during the network design process. Network analysis is important in that it helps us understand the complexity and nuances of each network and the systems they support. Analysis also provides data upon which various decisions are made, and these data can and should be documented as part of an audit trail for the architecture and design processes. Such data help ensure that the resulting architecture and design are defensible. Network analytics [21] is the application of big data principles and tools to the management and security of data networks. Network analytics will become more important and more broadly deployed as network security becomes more critical. Typically, large enterprises use network analytics. With the help of big data principles that apply machine learning and artificial intelligence (AI) technologies, network managers can acquire deeper visibility into network performance. Network analysis tools should also integrate with other systems, such as sending network events to a network operations centre or to intrusion detection and prevention systems. Nowadays, the network data analytics approaches have been proved to improve predictions of network log data that helps network managers detect market trends. By analyzing the log data, they can anticipate opportunities and help policy-makers monitor faster and more precisely the effects of a wide range of network traffic and policies. Fig. 1 show the enterprise network architecture that how log data have been collected from various network devices and how these log data have been visualized by the network users with respect to various network operations.
Fig.1. Enterprise network architecture
B. Statement of the Problem
The problems and challenges in the existing network model are listed below:
1) The storage of network traffic is tightly coupled with the analytics application, with these tools typically processing and storing data in proprietary format.
2) Multiple types of tools deployed across the same network segments, with each of these tools delivering specific functions. 3) The above tools and systems range from network or application performance monitoring tools to security or forensic analysis
system or even continuous network recording for compliance purposes.
Building data platforms and delivering advanced analytical services in the new age of data intelligence can be a daunting task. Therefore, a reference architecture is needed to provide guidelines for the process design and best practices for advanced analytics, so it can not only meet the business requirement, but also bring more value to the business. The design of a network analytics architecture to the above enterprise network considers the numerous challenges that this paradigm implies. These include scalability, data availability, data integrity, data transformation, data quality, data provenance, data management, data heterogeneity, data, data matching, data availability of network tools for properly analyzing such kind of data, processing complexity, privacy and legal issues and data governance.
C. Solution to the Problem
There is no specific network analytics architecture has been proposed yet. In this context, this paper aims to study the network analytics framework about the new and potentially useful available sources of network data and analytical methods devoted to deal with these data. This paper proposes a new network analytics architecture that encompasses all the processes related to working with network data for an enterprise network able to integrate process and analyze data from different network sources with the objective to forecast the changes. The proposed modern data analytical architecture includes recommended practices, along with considerations for scalability, availability, manageability, and security.
This paper is organized as follow: In technical background section, terminology and recent taxonomies for data analytics are discussed. A literature study was done in the literature review and methodology section. A modern data analytics architecture stack to enterprise network is introduced in the design section. Finally, in the conclusion section, a conclusion is drawn and an outlook presented.
II. TECHNOLOGICALBACKGROUND–STATE-OF-ART
Networks are at the centre of today's world, so understanding how the network is performing is critical. With getting a complete network management tools for seeing and understanding everything that is happening on the network. As a result, the network administrator and operator can act faster and more decisively to make their network operate better, faster and smarter, and to assure that every network customer is satisfied. Managing network performance and user satisfaction are key goals to network business success. Obtaining meaningful intelligence from the enterprise network usage data is crucial for making better network business decisions to achieve these goals. In pursuit of serving customers more effectively and looking for every possible competitive edge, network operators are utilizing analytics to gain a deeper understanding of the network.
A. Network Analytics
Analytics play a critical role in network operations. Real-time visibility and actionable intelligence can drastically augment the operational efficiency by providing a multidimensional, predictive view of the network. With that view, it can conduct solid root-cause analysis, traffic engineering, and network optimization. Network analytics enables the service providers to get this source data and turn it into the information they can use to optimize the enterprise networks [2]. Analysis of consumer or subscriber activities provide valuable information on a user, network application and device usage and subscriber acquisition enable network operators to target customers more accurately with service plans that correspond to their behaviour. From an operational perspective, it shows how the network users of the organization are consuming the network bandwidth.
Network analytics involves the analysis of network data and statistics to identify trends and patterns. Once identified, network operators take the next step of ‘acting’ on this data, which typically involves a set of network operations. The network vendors are augmenting traditional analytics with automation and artificial intelligence (AI) technologies [16] to enable the next generation of highly intelligent networks. Utilizing AI and automation technologies, network analytics helps operators make smarter, data-driven operational and business decisions.
B. Network Analytics Platform
[image:4.612.88.517.183.266.2]The data analytics platform is the result of extensive research and development in data visualization and human-computer interaction. It equips business, technical, and scientific professionals throughout the enterprise to freely analyze data and create analytic applications and dashboards. It puts end users in more control, which speeds to the “time to insight” while reducing typical bottlenecks within IT building new reports or reconfiguring databases. Fig. 2 represents a block diagram of network analytics platform. With this analytics platform, business users explore their data at the speed of thought and achieve competitive advantage faster than ever. It offers an instantaneous response to new questions and makes offerings self- service, without the need for IT intervention or support.
Fig. 2. A block diagram of network analytics platform.
The requirements [20] identified for an ideal enterprise BI deployment that an organization commits to an analytics platform, be sure to confirm that it delivers the architectural and functional capabilities required for successful and sustainable enterprise deployment. They include architectural efficiency, high performance, incremental growth and feature extensibility, complete access to the entire data ecosystem, sophisticated analytical tools, efficient enterprise-wide publishing, proactive business monitoring, robust security architecture, etc.
C. Working Principle of Network Analytics
Network analytic entails learning what users, their applications, and devices need from the enterprise network. It is also about understanding network behavior under various situations. Network analysis also defines, determines, and describes relationships among users, applications, devices, and networks. In the process, network analysis provides the foundation for all the architecture and design decisions to follow. In analyzing an enterprise network, it examines the state of the existing network, including whatever problems it may be having. It develops sets of problem statements and objectives that describe what our target network will be addressing. Also. It develop requirements and traffic flows, as well as mappings of users, applications, and devices, in support of our problem statements and objectives. As such, network analysis helps us understand what problems we are trying to solve, and in the process, it compile information that will be used in developing the architecture and design. Fig. 3 represents a working principle of a high-level architecture of network analytics. The functions of network analytics are detailed below:
1) The network analytics starts with data sources representing many business systems such as Web server, proxy server, firewall, router, switch, access points, network towers, and so on. These server systems and devices produce data need for network analytics.
2) Since the data is often stored in different formats, in different locations and in many cases, it cannot be accessed on a real-time basis, it needs to set up a single repository that is able to store all this data. This repository is called a data repository.
3) The extract, transform and load (ETL) job extracts data from one or more network sources on a scheduled basis, performs any required data cleansing to transform the data into a consistent format, and loads the cleansed data into the data repository. Data repository also called data warehouse is a pool of historical data that does not participate in the daily operations of the organization. Instead, this data is purposefully used for network analytics. The data in data mart usually applies to a specific area of the organization.
4) When collecting all necessary data, an analysis is typically performed. Analytics tools range from spreadsheets with statistical functions to complex data mining and predictive modelling applications. As patterns and relationships in the data are uncovered, new questions are asked and the analytic process iterates until the business goal is met.
D. Network Analytical Applications
Network analytical applications provide functionalities such as modelling, forecasting, log analysis, etc. These applications are equipped with analytical capabilities to allow users to gain insights into improving the performance of business operations. By employing analytical applications, decision-makers can also identify and understand what factors drive their business value and thus able to leverage opportunities faster than their competitors. The data analysis techniques are commonly used today are query and reporting, multidimensional analysis, and data mining.
1) Query and Reporting is the process of posing a question to be answered, retrieving relevant data from the data repository/ warehouse, transforming it into the appropriate context, and displaying it in a readable format. It primarily consists of selecting associated data elements, perhaps summarizing them and grouping them by some category, and presenting the results. The report is delivered to the end user on the desired output medium – documents, messages, graphs, etc.
2) Multidimensional Analysis has become a popular way to extend the capabilities of query and reporting. It enables users to look at a large number of interdependent factors involved in a business problem and to view the data in complex relationships. End users are interested in exploring the data at different levels of detail, which is determined dynamically. The complex relationships can be analyzed through an iterative process (no more drilling down or rolling up) and aggregation. Multidimensional analysis continues until no more drilling down or rolling up is performed.
3) Data mining is a relatively new data analysis technique. It is very different from query and reporting and multidimensional analysis. Data mining is most typically used for statistical data analysis and knowledge discovery. There is a high level of complexity in stored data and data interrelations in the data warehouse that is difficult to discover without data mining. Data mining offers new insights into the business that may not be discovered with query and reporting or multidimensional analysis. 4) Data visualization tools such as dashboards are used for displaying information stored to a data warehouse. Dashboards can
provide a real-time overview of the trends for a specific phenomenon or for many phenomena that are strictly connected with each other. Today, most software vendors offer dashboards for report creation and display.
The above techniques are used to formulate and display query results, to analyze data content by viewing it from different perspectives, and to discover patterns and clustering attributes in the data that will provide further insight into the data content. The techniques of data analysis can affect the type of data model selected and it’s content.
E. Machine Learning and Network Analytics
Analyzing network data to detect anomalies, such as intrusions, is an effective and proven technique for threat detection. However, it is a very intensive task and continues to become more so with the growing demand for cybersecurity services. It is able to show that large-scale processing of network flow data with machine learning [4] is feasible and that even quite simple model architectures trained on labelled data can achieve reasonably good accuracy to be useful in practice. Analytics may be combined with machine learning offer a new lens into network behaviour and the complex interactions between functions, user experience, location and application performance in case of quality data to analyze. Machine learning algorithms predict the data/content to improve the caching performance of networks. The networks require real-time, low-latency predictions and, therefore, the machine learning methods are highly scalable. The machine learning algorithms learn low-dimensional embedding for complex systems represented as graphs. Data collected from log files is representable as graphs. This network analytics allow a better understanding of the network data and its relation with the network users. It analyzes terabyte size network traces, logs and call data registers (CDRs) to find and solve problems that may affect the user experience. It may analyze the fraud protection mechanisms of content portals. Machine learning is being added to network analytics to not only troubleshoot issues, but to diagnose the root causes, and recommend corrective actions. Machine learning uses algorithms to enable technology to learn, identify patterns, make decisions, and perform tasks without being programmed to do so. The more data a machine-learning program consumes, the more intelligent the program becomes.In addition, the deep learning model [15] analyzes the request traffic in communication networks turning raw traffic patterns into valuable insights, user personalization, and optimized operation of the network.
F. Analytics-as-a-Service (AaaS)
insights drive predictions derived from machine learning and AI analytical platforms. Fulfilment of these predictive optimizations can be carried out by human intervention or platform automation.
AaaS is AI-powered application provide closed-loop automation capabilities to solve a wide range of network analytics use cases. AaaS unleash the true power of big data and enable network providers to offer superior customer experiences in services. AaaS provides an open and extensible architecture optimized for adaptive networking when combined with the policy engine, and actionable systems to enable end-to-end intelligent, closed-loop automation across any type of physical and/or virtual network. AaaS provides allows clients to use a particular analytics software for as long as needed, and can be more cost effective and less labour intensive when compared to the traditional way.
G. Network Analytics Architecture
Network analytics involves strategies and techniques to gather various data (e.g. monitoring data) and analyze the data, to infer changes in the state of network resources and deduce any patterns that help build knowledge pertaining to network state transitions, event predictions, and forecasts. The analysis process and the knowledge built is used to decide actions that can be performed to achieve certain objectives.
The enterprise might encounter important challenges [30] when adopting real-time analytics. The challenges are a vague definition of real-time, an irrelevant architecture, adjusting internal processes and employees' resistance to change. A well-designed architecture is a critical success factor, so pay special attention to the fundamental architectural issues. A typical architecture is a good foundation, but it can be further tailored to achieve better performance. A more relevant architecture to data analytics needs the ability to process the enterprise network log or data at high speed. However, the processing-speed requirements can vary from milliseconds to minutes, depending on the data source and application. The relevant architecture shall also be able to deal with spikes in data volume and be able to scale up as their network data grows.
Enterprise organizations that plan to adopt real-time network analytics often lose sight of offline network analytics, but it needs both real-time network analytics and offline network analytics to get insights. For example, sending instant alerts is a great application for real-time network analytics; identifying models and patterns with machine learning is a time-consuming process not suitable for real-time processing. Running real-time network analytics and offline network analytics on the same data may create conflicts for computing resources and hinder performance.
This paper considers the challenge of irrelevant architecture. Designing a relevant architecture can resolve such conflicts. The contemporary data analytics systems cannot sufficiently handle big data as well as current systems handling big data consist of inflexible and complex platforms, tools and information. This needs to be restructured into a much more centralized but flexible analytical infrastructure [13]. The problem of how to do this presents a challenge to businesses and the research community. Reference architecture can help in the creation of concrete architectures; however, there remains a lack of reference architectures as well as a coherent architecture of big data analytics.
H. Analytics Reference Architecture
Reference architecture for data analytics architecture can help in the creation of concrete architectures as well as the understanding of the overall architecture with typical related functionality and data flows in a big data analytics system [5]. A reference architecture is useful for analyzing existing big data systems, providing the base of classification of data analysis processes and technologies. Therefore, a reference architecture is needed to provide guidelines for the process design and best practices for advanced analytics. It meets the business requirement and brought more value to the business. Some of the analytics reference architecture are presented below:
Building data platforms [25] delivering advanced analytical services in the new age of data intelligence could be a daunting task. Adobe analytics [1] processes billions of transactions a day across the major web and mobile properties to power the Adobe experience cloud. It started to modernize data processing stack, adopting open source technology. A modern analytics architecture [3] to an enterprise environment offers a breadth of analytics solutions that enable network providers to gradually adopt analytics. Hadoop’s next-generation architecture [19] creates a user-oriented analytical data tier on top of Hadoop to aggregate and analytically refine data for browsing, exploration, and delivery throughout an organization.
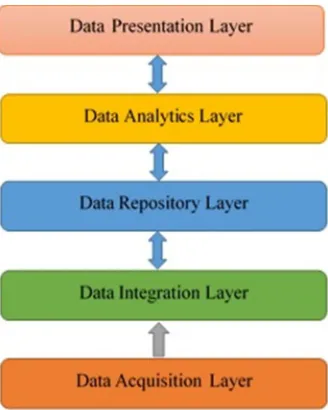
Fig. 3. Analytics reference Architecture
The data acquisition layer consists of components to get data from all the source systems, such as human resources, finance, and billing. The data integration layer consists of integration components for the data flow from the sources to the data repository layer in the architecture. The data repository layer stores data in a relational model to improve query performance and extensibility. The data analytics layer stores data in cube format to make it easier for users to perform what-if analysis. In the data presentation layer, applications or portals that give access to different set of users. Applications and portals consume the data through web pages and portlets that are defined in the reporting tool or through web services.
Most of the above analytics reference architecture is designed with the goals of scalable, reliable, maintainable, testable, easy to configure and portable.
I. Modern Analytics Reference Architecture
Next-generation analytics have the processing performance needed to combine multiple data sets and yield mission-critical business benefits in near real time. The next-generation analytics architecture [18] should have high-latency and low-concurrency. This analytic data store offers interactive and fast query response times. It can analyze large data sets quickly and handles easily. If a business analyst or business user veers away from searching the aggregated, hierarchical data available in the analytic data store, the next-generation analytics architecture can automatically route the query back to a low-cost data store for very detailed analysis. This query navigation process is seamless to the user and eliminates the need to drop into a primitive and unfamiliar set of analytics frameworks. The strategy used to develop a modern analytics reference architecture [George Dyson, 2013] includes three key points to set the context:
1) Network data from enterprise network sources. It wants to view data in terms of its qualities. This includes the method of acquisition, historical significance, quality, value, and relationship to other forms of data. These qualities will determine how it is managed, processed, used, and integrated.
2) Network analytics. There are many types of analysis that can be performed, by different types of systems, tools, and through a variety of channels. Some types of analysis require current information and others work mostly with historical information. In addition, some types are performed proactively and others are reactive. The modern analytics reference architecture design must be universal and extensible to support a full range of analytics.
3) Integrated analytic applications. Intelligence must be integrated with the network analytic applications that knowledge workers use to perform their jobs. Applications must integrate with information and analysis components in a manner that produces consistent results. There must be consistency from one application to another, as well as consistency between applications, reports, and analysis tools.
III.LITERATUREREVIEWANDMETHODOLOGY
The contributions of this article are to design a modern analytics architecture stack to an enterprise network environment. In order to ensure design methodological rigour, it utilizes design science research model [11] as the underlying methodology as it is well suited for the development of architecture.
1) Using a literature review, relevant BI and network analytics architecture models were discussed and a research gap was identified [7]. It includes studying the existing analytics architecture that supports scalability in a network environment
2) A literature review was analyzed and demands from practice were included. With these insights, a conceptual model was developed.
3) It is made qualitative statements [12] comparable by analyzing the frequency. The improvements were incorporated and the changed architectural model. The new improvements were incorporated.
4) The demonstration and evaluation phase of the original Peffers et al. model was summarized with an applicability check [22]. 5) It comprises a basis for examining the above results and propose a modern analytics architecture with qualitative results. This effort contributes to information system research by providing a commonly accepted framework for successfully carrying out design science research and a mental model for its presentation. It helps with the recognition and legitimization of design science research and its objectives, processes, and outputs and it should help researchers to present research with reference to a commonly understood framework, rather than justifying the research paradigm on an ad hoc basis with each new paper or article
This study is based on the following literature review approaches.
a) Phase-I includes studying the existing analytics architecture that supports scalability in a network environment b) Phase-II conducts the review process to identify, select and evaluate analytics architectures.
c) Phase-III comprises a basis for examining research results and propose a modern analytics architecture with qualitative results.
A. Phase -I
This section reviews the studies that focus on investigating an analytics architecture in the literature. Different types of architectures have been proposed in the literature to support high processing speed and algorithmically scalability. The high rates of incoming stream data require new techniques for efficient data ingestion.
Accedian’s SkyLIGHT [28] performance assurance platform delivers the most precise, granular, and complete set of network performance and quality of experience metrics available. It is the ultimate data source for big data analytics and machine learning, where resolution, detail and diversity of data drive correlation and insight that would otherwise remain invisible. BlueTC’s network analytics solution [8] allows correlating, predicting, simulating, and ultimately anticipating the performance of the different systems and networks.
It is based on an advanced analytics methodology and supported by cutting-edge data-mining tools that employ artificial intelligence. Cisco Tetration Analytics [10] captures telemetry from every packet and every flow, delivers pervasive real-time and historical visibility across the data centre, providing a deep understanding of application dependencies and interactions. The architecture of Tetration Analytics is made of a big data analytics cluster and two types of sensors: hardware and software based. Sensors can be either in the switches or in the servers. Cisco’s Assurance and Analytics solution [17] delivers a full technology stack from the ground up to address customer needs.
It uses a simplified integrated user experience across the entire enterprise portfolio of products. It proactively identifies issues and trends through correlation and machine learning algorithms.
JStorm-based network analytics platform [6] designed and implemented a network analytics platform. The entire platform is designed with layered architecture. The data source layer includes various data collected from network devices and business services. In the middle is the real-time analytics layer.
The output layer is responsible for streaming data output and supports API data extraction. QiTian's Real-time network monitoring [6] is based on JStorm's stream computing engine. The raw data that it collects is transformed into multi-dimensional information and network traffic flow data through some basic ETL and aggregate operations. This data will be consumed by a monitoring policy task. The monitoring policy task contains a variety of monitoring policies, each of which will identify exceptions from a different dimension. Spotfire analytics [27] is ranked as one of the easiest to use BI platforms.
An SDN-based monitoring framework [26] expands network analytics to a converged packet and optical network. With a designated monitoring hub, monitoring information from multiple layers was collected and processed in a centralized server. The multilayer network analytics enabled quality of service recovery to avoid network disruption, optical power equalization at any combining device, and network debugging and restoration in optical networks.
Streaming data analytics in real-time has been made possible with Apache Storm and Apache Spark recently. In [23], the Apache Spark has been chosen for their system architecture to analyze stream data in real-time because of the high processing speed obtained from detecting anomaly for multi-source.
The framework of Business Intelligence (BI) architecture (14] consists of five layers: data source, ETL, data warehouse, end user, and metadata layers.
These five layers are essential to ensure high data quality and smooth information flow in a BI system. A broader view of big data architecture (Data Warehouse Trends Report, 2019). It discussed how do organizations today build an infrastructure to support storing, ingesting, processing and analyzing huge quantities of data. The reference architecture and the methodologies uses big data to do network analytics and diagnostics. FINAD adopt a neuro-networking method [24] to model network health from several dimensions, including network anomaly analysis and network risk estimation, to calculate network health score through training with historical assessment data sampling.
Two important data processing architectures [32] serve as the backbone of various enterprise applications known as Lambda and Kappa. Lambda architecture is a data processing technique that is capable of dealing with huge amount of data in an efficient manner. The efficiency of this architecture becomes evident in the form of increased throughput, reduced latency and negligible errors. Kappa Architecture cannot be taken as a substitute of Lambda architecture on the contrary it should be seen as an alternative to be used in those circumstances where active performance of batch layer is not necessary for meeting the standard quality of service. This architecture finds its applications in real-time processing of distinct events.
The two-layer architecture [Lechtenbörger, 2001] highlighted a separation between physically available sources and data warehouses. In three layered architecture [Cui and Widom, 2000 ], the third layer is called the reconciled data layer or operational data store that materializes operational data obtained after integrating and cleansing source data. The main advantage of the reconciled data layer is that it creates a common reference data model for a whole enterprise. The scientific literature often distinguishes five types of architecture for data warehouse systems, in which the same basic layers mentioned in the preceding paragraphs are combined in different ways (Rizzi, 2008).
1) In independent data marts architecture, different data marts are separately designed and built in a nonintegrated fashion. This architecture could be initially adopted in the absence of a strong sponsorship toward an enterprise-wide warehousing project, or when the organizational divisions that make up the company are loosely coupled.
2) The bus architecture is apparently similar to the preceding architecture, with one important difference. A basic set of conformed dimensions, derived by a careful analysis of the main enterprise processes, is adopted and shared as a common design guideline. 3) In the hub-and-spoke architecture, one of the most used in medium to large contexts, there is much attention to scalability and
extensibility, and to achieving an enterprise-wide view of information. Users mainly access the data marts, but they may occasionally query the reconciled layer.
4) The centralized architecture can be seen as a particular implementation of the hub-and-spoke architecture, where the reconciled layer and the data marts are collapsed into a single physical repository.
5) The federated architecture is sometimes adopted in dynamic contexts where preexisting data warehouses/data marts are to be noninvasively integrated to provide a single, cross organization decision support environment.
From the above literature, it is considered that a new business analytics architecture has the key components including self-service data preparation tools, data visualization, smart data discovery tools, machine learning, social bi & collaboration, data analysts & centralized IT.
B. Phase -II
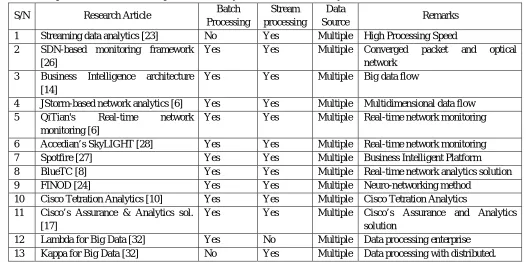
This phase conducts the review process to identify, select and evaluate analytics architectures as shown in Table 1.
S/N Research Article Batch
Processing
Stream processing
Data
Source Remarks
1 Streaming data analytics [23] No Yes Multiple High Processing Speed
2 SDN-based monitoring framework [26]
Yes Yes Multiple Converged packet and optical
network 3 Business Intelligence architecture
[14]
Yes Yes Multiple Big data flow
4 JStorm-based network analytics [6] Yes Yes Multiple Multidimensional data flow
5 QiTian's Real-time network
monitoring [6]
Yes Yes Multiple Real-time network monitoring
6 Accedian’s SkyLIGHT [28] Yes Yes Multiple Real-time network monitoring
7 Spotfire [27] Yes Yes Multiple Business Intelligent Platform
8 BlueTC [8] Yes Yes Multiple Real-time network analytics solution
9 FINOD [24] Yes Yes Multiple Neuro-networking method
10 Cisco Tetration Analytics [10] Yes Yes Multiple Cisco Tetration Analytics
11 Cisco’s Assurance & Analytics sol. [17]
Yes Yes Multiple Cisco’s Assurance and Analytics
solution
12 Lambda for Big Data [32] Yes No Multiple Data processing enterprise
13 Kappa for Big Data [32] No Yes Multiple Data processing with distributed.
Table 1 evolves in terms of the intelligent analysis, online, offline, etc. This will make network analytics smarter and more efficient in the modern network analytics environment.
C. Phase -III
In the above section, the activities in Phase-I and Phase-II are explained in detail. From Phase-I and Phase-II, a well-designed relevant architecture is a critical success factor in the analytical area. A typical architecture can be designed to achieve better performance. Network organizations may plan to adopt real-time analytics or offline analytics. Running real-time analytics and offline analytics on the same data may create conflicts for computing resources and hinder performance. The proposed architecture should be designed to resolve such conflicts.
The proposed architecture needs the ability to process enterprise data at high speed. However, the processing-speed requirements can vary from milliseconds to minutes, depending on the data source and application. The proposed architecture should also be able to deal with spikes in data volume and be able to scale up as the network data grows.
The proposed analytical architecture lets to store any kind of data, and analyze it in real time. The proposed analytical architecture enables to store and process data of any structure: events, time series data, text and binary data, and anything else. The proposed architecture can support thousands of nodes, the large volume of data, and hundreds of thousands of operations per second in an enterprise environment. With rich index and query support, the proposed architecture can run complex ad-hoc analytics and report in place.
The results obtained in the process for Phase-III comprises a basis for examining research results and propose a modern analytics reference architecture with qualitative results is presented in Section 4.
IV.MODERNNETWORKANALYTICARCHITECTURESTACK
In this section presents the conceptual model and the network analytics architecture to integrate the data from the entire network. The proposed network analytics architecture is a layered structure that enables data scientists and analysts to flexibly tailor analytics platform elements to specific client needs while preserving cost-effective options for future expansion, capacity increases, and adoption of new technologies.
[image:10.612.41.567.101.363.2]network standards, e.g. with regard to quality. Continuous remote monitoring, analysis, and reporting of network specifications secure a steady network quality. Network monitoring offers support preventive maintenance, analysis of load and quality, specific report generation, change log and central firmware support and troubleshooting support. Network validation enables elimination of potential design errors as early as the acceptance phase.
A. Design Characteristics
The proposed architecture offers a breadth of analytics solutions that enable network providers to gradually adopt analytics. It can start with basic analytics insights by using AaaS solution then gradually move on to incorporate automated network control toward the more advanced implementation of adaptive networking. The proposed modern data analytical architecture exhibits the characteristics of customer-centric, adaptable, automated, smart, flexible, collaborative, governed, simple, elastic and
secured. In the age of big data and variable workloads, organizations need a scalable, elastic architecture that adapts to changing data processing requirements on demand. Many companies are now flocking to cloud platforms to obtain on-demand scalability at affordable prices. In addition, the data analytical architecture must be resilient, with high availability, disaster recovery, and backup/restore capabilities. This is especially true in a modern data architecture that often runs on huge server farms in the cloud where outages are commonplace. Many cloud providers offer built-in redundancy and failover with good service level agreements and allow companies to set up mirror images for disaster recovery in geographically distributed data centres at low cost.
B. Quality Factors & Requirements
Technically, checking for data quality requires appropriate sets of metrics [29]. The quality of a process stands for the way a process meets users' goals. The quality is not only useful for the level of data but also all for the completely integrated system and usage of data repositories. Some of the properties characterizing data quality are accuracy, freshness, completeness, consistency, availability, traceability and clearness. Security is also particularly relevant to a data warehouse because data warehouses are used to manage information crucial for strategic decision-making processes. The huge amount of information exchange that takes place in data warehouses in the data-staging phase causes specific problems related to network security. The attributes of modern analytics architectures are time to value, open standards, support for SAS and open languages (R, Python, Lua), scalability, supporting a variety of data formats, multi-channel delivery, batch and real-time, access to data and insights, etc.
Requirements define the system to be implemented in terms of its behaviours, applications, constraints, properties, and attributes. The requirements included constraints around streaming data, usage of unstructured & external data, embedment of analytics in the operational processes and API usage. The modern network analytics architecture must meet all these different requirements, but at the same time to fit into an ecosystem, data providers and consumers. This may lead to a belief that architecture for ecosystems is key to achieve success in the area of data integration. In addition to the above requirements, it is included the other requirements such as modifiability, throughput, scalability, big data and latency security includes confidentiality, privacy, integrity, non-repudiation, availability. Once data is stored, network analytical applications and/or end users will likely need to access it. The most important requirements of a network analytical system are availability, performance, and scalability. These requirements are related and have impacts on one another.
1) Availability says that every request receives a response, without a guarantee that it contains the most recent version of the information. It is implied that availability here refers to database nodes that are in a non-failing state, and that return requested information as opposed to an error.
2) Performance describes the speed by which data operations are executed successfully. Highly performant analytical systems are therefore very important.
3) Scalability refers to the system’s ability to maintain a certain degree of availability and performance regardless of the load (e.g., concurrent user requests) imposed on the system.
4) Integration - From gathering data, transforming it into useful information and delivering it to the users or processes that need it, data integration routines provide the crucial link between a variety of source and target systems. This architecture emerged to meet the challenges of data integration. The current generation of data integration tools consists of full-fledged suites that support extract, transform and load (ETL) processes, application integration, cloud-based and real-time integration, data virtualization, data cleansing and data profiling.
C. Proposed Analytic Workflow
[image:12.612.139.473.145.196.2]The proposed analytics workflow of data analytics is based on the real-time workflow (Sangwhan Cha, Monica Wachowicz, 2015). In this workflow, batch processing / real-time streaming analytics involves a continuous input process of stream data. This continuous input runs into four layers, which are designed to perform tasks such as data ingestion, data processing/data exploration, data visualization and data storing. Fig. 4 shows the workflow of network data analytics in the proposed system.
Fig. 4 Workflow of network analytics
Business users and analysts throughout the network organization primarily drive the modern analytic workflow. In order to select a modern business intelligence platform that can be adopted and widely deployed, organizations should consider the platform’s value of this workflow from the perspectives of the business intelligence professional, the content creator, and the information consumer. 1) The data ingestion is known as the task of collecting stream data from multiple sources and formats such as servers, switches,
routers, wireless devices, towers, etc.
2) Data processing or data exploration, which makes direct access to stream data in raw formats from different sources. This task can also transform well-structured data as well as unstructured data into human readable structured data using algorithms, which can perform aggregation, simplification, conversion, and sorting.
3) The data analytics needs to support continuous update to data visualization of a web site activity as it is constantly updated. It requires immediate computer responsiveness initiated by batch processing/ streaming data from data ingestion to data visualization.
4) All the relevant data of a stream data window can now be sent to Web browsers for visualization using a graphical API that supports real-time updates.
The workflow analytics includes qualitative and quantitative information gathering, and proprietary tools and analytics.
D. Network Analytics Model
A network analytics model that aligns with modern network architectures is one in which the capture, mediation and deliver and the storage, processing and analysis functions are separated. These function increases the range of hardware that would be capable of receiving and storing network data. Once the network data is on a uniform storage or big data platform, it can be acted on by network, or by an intermediate processing framework that serves network data to visualization and analytics applications. The conceptual or functional view of the proposed network analytics model is shown in Fig. 5. The conceptual view of the network data analytics model focus on the way the parties distribute and collect the data from several data providers. In the proposed model, the end user is enabled to receive the latest log data from the network data providers.
Fig. 5. The functional view of network analytics model
[image:12.612.151.461.512.647.2]E. Network Analytics Architecture
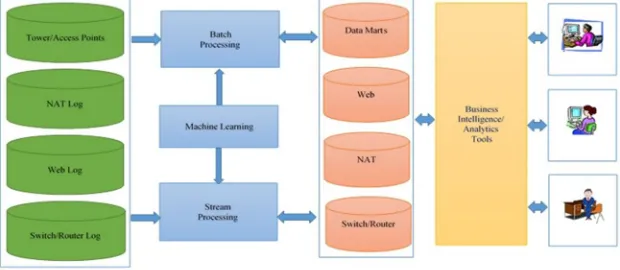
The overall architecture of the network analytics platform is divided into four layers, including data sources, data repository, data analytics and data visualization, and the overall structure as shown in Fig. 6. It has divided the key elements of data uses into functional components: data source, data processing and integration, data analysis & aggregation, and data interface & visualization. The proposed network analytics architecture is a layered architecture and they are data analytics, data repository, data processing and data sources. All these layers are explained below:
1) Data Analytics Layer: The data analytics layer is where end users (network analytics, network users, decision-makers and administrators) interact with the cleansed and organized data in the data repository. The end users are network administrator, traffic analyst, consumer, agent, etc. The analytics layer provides end users with the ability to query the data for service insights, analyze the information to conduct hypothetical business scenarios, and develop automated or ad-hoc reports. It may employ an OLAP or reporting tools with a user-friendly graphical user interface or APIs. The end users aim to collect and analyze data sets from various network areas. The data analytics focus is on scalable machine learning on time series, sequence, and graph data. This analytics layer consists of basic data analytics module, network monitoring and analysis module, network diagnosis module, network scheduling and network profiling module. The basic data analytics module is the premise of all data analytics functions on the right. It converts original data to standard-format data. The network monitoring and analysis module are used to detect suspicious exceptions on the network. It is divided into monitoring policies, network events, and exception notifications. The network diagnosis module is used to locate the cause of a specific problem if any. It can be used to process and analyze each data message, compute the traffic path of the message, and locate the network device where a problem occurs in the path and the specific cause of the problem. The network scheduling module is the most important part of network scheduling is to use the traffic scheduling policy for troubleshooting. The network profiling module is used for the planning and scheduling of our network resources, as well as for the accounting of product costs and revenue. The entire data analytics layer is based on the data analytics engine. It is not a stand-alone application, but a collection of multiple data analytics tasks. The approaches for end users to query data warehouses are reports, search, actions, OLAP, and dashboards. End users often use the information stored to a data repository/warehouse as a starting point for additional business intelligence applications, such as what-if analyses and data mining.
[image:13.612.164.447.475.709.2]2) Dashboards: Dashboards are used for displaying information stored to a data repository/warehouse. It refers to a GUI that displays a limited amount of relevant data in a brief and easy-to-read format. Dashboards can provide a real-time overview of the trends for a specific phenomenon or for many phenomena that are strictly connected with each other. Network administrators who need a quick way to view information often use dashboards. For conducting and displaying very complex analyses of phenomena, dashboards must be matched with analysis tools.
3) OLAP Tools: OLAP might be the main way to exploit information in a data repository/ data warehouse. They give end users, whose analysis needs are not easy to define beforehand, the opportunity to analyze and explore data interactively based on the multidimensional model. The OLAP users are able to start a complex analysis session actively, where each step is the result of the outcome of preceding steps. The GUI of these tools must be flexible, easy-to-use, and effective.
4) Reports: A report is defined by a query and a layout. This approach is oriented to those users who need to have regular access to the information in an almost static way. Data analysts and scientists issue the queries to create reports with the desired layout. End users can query current data whenever they need to. A reporting tool should be evaluated not only based on comprehensive report layouts but also based on flexible report delivery systems. A report can be explicitly run by users or automatically and regularly sent to registered end users via e-mail and SMS alerts.
5) Visual Analytics: visual analytics is to eliminate this extra step by presenting information graphically. Visual Analytics can take on the large volume of data. The network analyst analyzes data on their own to build accurate reports for management, saving significant time and money.
6) Search/Query: It enables end users to ask their own questions of the data, without relying on IT to create a report. In particular, the tools must have a reusable semantic module to enable users to navigate available data sources, predefined metrics, and hierarchies and so on.
7) Apps and Alerts: It enables organizations to develop and deliver content to mobile devices in a publishing and/or interactive mode. It takes advantage of mobile devices’ native capabilities and natural-language query.
8) Excel integration: Often Excel acts as the reporting or analytics tool. Various Business Intelligence (BI) tools provide integration with Microsoft Excel, including support for native document and presentation formats, formulas, charts, data “refreshes” and pivot tables.
9) Data Repository Layer: The data repository layer may be composed of multiple types of databases. The data storage layer (also called data warehouse layer) is where data that was cleansed in the staging area is stored as a single central repository. This layer is responsible for acquiring data from the data sources and, if necessary, converting it to a format that suits how the data is to be analyzed. The data repository layer contains the databases and data stores and related components that provide most of the storage for the data, which supports an enterprise network environment. The data repositories layer reshape data into formats necessary for making decisions and managing a business. These database structures are represented by conceptual, logical, and physical data models and data model types (e.g. 3NF, star/snowflake schemas, unstructured, etc.) Depending on the business, the data storage may be a data warehouse, data mart, Data Lake or a data store. Many data solutions and applications prepare data for analysis and then serve the processed data in a structured format that can be queried using analytical tools. The analytical data store used to serve these queries can be a relational data warehouse, as seen in most traditional BI solutions. Alternatively, the data could be presented through a low-latency NoSQL technology that provides a metadata abstraction over data files in the distributed data store. This layer provides a managed service for large-scale or cloud-based repository/ data warehousing.
10) Data Processing Layer: The data processing layer receives data from the sources. If necessary, it converts unstructured data to a format that analytic tools can understand and stores the data according to its format. Extract, transform and load tools (ETL) are the data integration tools used to extract data from source systems, transform and prepare data and load into the data repository layer. The data architecture might store structured data in an RDBMS, and unstructured data in a specialized file system like HDFS or NoSQL database.
a) Extraction: In extraction, relevant data is obtained from data sources in the extraction phase. Extraction can also be source driven. The data to be extracted is mainly selected based on its quality.
b) Transformation: Transformation is the core of the reconciliation phase. It converts data from its operational source format into a specific data repository/ warehouse format.
c) Loading: Loading into a data repository can be carried out in two ways: refresh data and update only. In refresh data, the repository data is completely rewritten. Refresh is normally used in combination with static extraction to initially populate a data warehouse. Update only those changes applied to source data are added to the data repository. An update is typically carried out without deleting or modifying preexisting data. At the top is the data analytics layer, which is responsible for streaming data output, and supports API data extraction. These two functions are mainly for connecting to other systems. d) Stream processing: After capturing real-time messages, the solution must process them by filtering, aggregating, and otherwise
e) Batch processing. Because the data sets are so large, often the data must process data files using long-running batch jobs to filter, aggregate, and otherwise, prepare the data for analysis. Usually, these jobs involve reading source files, processing them, and writing the output to new files.
f) Real-Time Message Ingestion. If the solution includes real-time sources, the architecture must include a way to capture and store real-time messages for stream processing. This might be a simple data store, where incoming messages are dropped into a folder for processing. However, many analytical solutions need a message ingestion store to act as a buffer for messages, and to support scale-out processing, reliable delivery, and other message queuing semantics. This portion of a streaming architecture is often referred to as stream buffering.
For example, the network controller consumes the policy data generated by applications to manage and configure network devices, but the end users need is visualized data. It will go deep into the whole platform from bottom to top, from data source to analysis performance, real-time monitoring, network diagnosis, intelligent scheduling, and multi-dimensional network profiling. Machine Learning. Machine learning algorithms predict the data/content to improve the caching performance of networks. In addition, the deep learning model analyzes the request traffic in communication networks turning raw traffic patterns into valuable insights, user personalization, and optimized operation of the network. The networks require real-time, low-latency predictions and, therefore, the machine learning methods are highly scalable. The machine learning algorithms learn low-dimensional embedding for complex systems represented as graphs.
11) Data Source Layer: The data source layer is also called the data collection layer, which includes various data collected from network devices and business services. Data sources for analytics architecture are all over the map. It incorporates structured, unstructured and/or semi-structured data captured from the Web server, Proxy server, network switches, routers, gateway, wireless access points, network towers, etc. This very wide variety of data, coming in huge volume with high velocity has to be seamlessly merged and consolidated so that the analytics engines, as well as the visualization tools, can operate on it as one single big data set. Data can come through from network servers and sensors, or from third-party data providers. The data analytics environment can ingest data in batch mode or real-time. The proposed modern data analytical architecture is based on publish/subscribe and event-driven architecture. An event-driven architecture consists of event producers that generate a stream of events, and event consumers that listen for the events. Events are delivered in near real time, so event consumers can respond immediately to events as they occur. An event-driven architecture can use a publish/subscribe model or an event stream model. In publish/subscribe, the messaging infrastructure keeps track of subscriptions. When an event is published, it sends the event to each event subscriber. After an event is received, it cannot be re-played, and new subscribers do not see the event. In event streaming, the events are written to a log. Events are strictly ordered and durable. Event subscribers do not subscribe to the stream; instead, event subscribers can read from any part of the stream. The event subscribers are responsible for advancing its position in the stream.
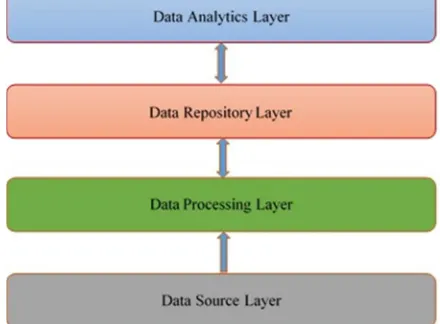
F. Modern Network Analytics Architecture Stack
Fig. 7 shows the modern network analytics architecture stack. The stack has a data analytics layer, data repository layer, data processing layer and data source layer. The data source layer collected the raw materials for analysis, the processing layer mixed them all together, and the data repository layer optimized and organized and the data analytics layer executed the queries.
[image:15.612.194.414.553.715.2]1) The Data Analytics Layer: The data analytics layer is the real thing. It uses data to enable data-driven decisions. It can run queries to answer questions the business is asking, slice and dice the data, build dashboards and create beautiful visualizations, using one of many advanced business intelligence tools. It provides an answer to business queries and provides actionable data, which can help the business. A data analyst or data scientist can use these tools to take raw data and move it through the pipeline themselves, all the way to the business intelligence tools. A few examples of analytics & business intelligence tools are Tableau, Chartio and Looker
2) The Data Repository Layer: The data processing layer optimizes the data to facilitate more efficient analysis and provide an analytics engine to run the queries. Data repository or warehouse tools are optimal for processing data at scale, while a data lake is more appropriate for storage, requiring other technologies to assist when data needs to be processed and analyzed. The data analysts and data scientists want to run SQL queries against data, some of which will require enormous computing power to execute. A few examples of data processing tools are Apache Spark, PostgreSQL and Amazon Redshift.
3) The Data Processing Layer: To create a data store, it needs to import data from its original sources into the data layer. In many cases, to enable analysis, it needs to ingest data into specialized tools, such as data warehouses. This will not happen without a data pipeline. It can leverage a rich ecosystem of data integration tools, including powerful open source integration tools, to pull data from sources, transform it, and load it to a target system of the choice. A few examples of data ingestion tools are Stitch, Blendo and Apache Kafka.
4) The Data Source Layer: At the bottom of the stack are technologies that store masses of raw data, which comes from traditional sources like log files, sensors and web analytics. Increasingly, storage happens in the cloud or on virtualized local resources. Organizations are moving away from legacy storage, towards commoditized hardware, and more recently to managed services. Few examples of the data storage systems are CDR.The proposed network analytics architecture will be considered to use the following scenarios:
a) To store and process large data for a traditional database.
b) To transform unstructured or semi-structured data for analysis and reporting.
c) To capture, process, and analyze unbounded streams of data in real time, or with low latency.
The benefits of the proposed data analytics architecture are technology choices, performance, elastic scale and interoperability. The technology choices can mix and match managed services and technologies to capitalize on existing skills or technology investments. The network analytical solutions take advantage of parallelism, enabling high-performance solutions that scale to large volumes of data. All of the components in the data analytics architecture support scale-out provisioning. The components of the data analytics architecture are enabling us to create an integrated solution across data workloads.
The challenges of the proposed data analytics architecture are complexity, performance, skillset. , technology maturity, security and manageability. The analytical solutions can be extremely complex, with numerous components to handle data ingestion from multiple data sources. There may be a large number of configuration settings across multiple systems that must be used in order to optimize performance. Many data analytical technologies are highly specialized and use frameworks and languages that are not typical of more general application architectures. Many of the data analytical technologies used in data analytics are evolving. The emerging technologies can introduce extensive changes and enhancements with each new release. Securing access to this data can be challenging, especially when the data must be ingested and consumed by multiple applications and platforms. It manages the analytical application, monitor, and deploys updates, and so on. Metrics are used to describe parameters, performance and effectiveness that characterize the criteria against which the fielded system is to be evaluated. Effectiveness is a measure of system performance within its intended environment (e.g. overall system effectiveness). Performance is a measure of one attribute of system behaviour derived from its parameters (e.g. probability of correct identification). Parameters are properties or characteristics whose values determine system behaviour (e.g. error rate).
G. Performance Characteristics