Piperidine-1-carboximidamide
Ioannis Tiritiris
Fakulta¨t Chemie/Organische Chemie, Hochschule Aalen, Beethovenstrasse 1, D-73430 Aalen, Germany
Correspondence e-mail: [email protected]
Received 25 October 2012; accepted 26 October 2012
Key indicators: single-crystal X-ray study;T= 100 K; mean(C–C) = 0.002 A˚;
Rfactor = 0.045;wRfactor = 0.112; data-to-parameter ratio = 15.0.
In the title compound, C6H13N3, the C N and C—N bond lengths in the CN3 unit are 1.3090 (17), and 1.3640 (17) (C– NH2) and 1.3773 (16) A˚ , indicating double- and single-bond character, respectively. The N—C—N angles are 116.82 (12), 119.08 (11) and 124.09 (11), showing a deviation of the CN
3 plane from an ideal trigonal–planar geometry. The piperidine ring is in a chair conformation. In the crystal, molecules are linked by N—H N hydrogen bonds, forming a two-dimensional network along theacplane.
Related literature
For the crystal structure of 4-morpholinecarboxamidine, see: Tiritiris (2012). For the crystal structure of bis(piperidin-1-yl)methanone, see: Betzet al.(2011).
Experimental
Crystal data
C6H13N3 Mr= 127.19
a= 12.2193 (9) A˚ b= 5.5784 (5) A˚ c= 10.4885 (7) A˚
= 91.887 (4)
V= 714.55 (10) A˚3
CuKradiation
= 0.60 mm1 T= 100 K
0.450.260.06 mm
Data collection
Bruker Kappa APEXII DUO diffractometer
Absorption correction: multi-scan (Blessing, 1995)
Tmin= 0.830,Tmax= 0.965
4190 measured reflections 1413 independent reflections 1116 reflections withI> 2(I) Rint= 0.049
Refinement
R[F2> 2(F2)] = 0.045 wR(F2) = 0.112 S= 1.03 1413 reflections 94 parameters
H atoms treated by a mixture of independent and constrained refinement
max= 0.19 e A˚
3
min=0.21 e A˚
3
Table 1
Hydrogen-bond geometry (A˚ ,).
D—H A D—H H A D A D—H A
N2—H21 N1i
0.94 (2) 2.15 (2) 3.071 (1) 168 (1) N2—H22 N1ii
0.94 (2) 2.15 (2) 3.090 (1) 177 (1)
Symmetry codes: (i)x;yþ1 2;z
1
2; (ii)xþ1;yþ 1 2;zþ
1 2.
Data collection:APEX2(Bruker, 2008); cell refinement:SAINT (Bruker, 2008); data reduction:SAINT; program(s) used to solve structure:SHELXS97(Sheldrick, 2008); program(s) used to refine structure: SHELXL97 (Sheldrick, 2008); molecular graphics: DIAMOND(Brandenburg & Putz, 2005); software used to prepare material for publication:SHELXL97.
The author thanks Dr W. Frey (Institut fu¨r Organische Chemie, Universita¨t Stuttgart) for measuring the crystal data.
Supplementary data and figures for this paper are available from the IUCr electronic archives (Reference: GO2073).
References
Betz, R., Gerber, T. & Schalekamp, H. (2011).Acta Cryst.E67, o397. Blessing, R. H. (1995).Acta Cryst.A51, 33–38.
Brandenburg, K. & Putz, H. (2005).DIAMOND. Crystal Impact GbR, Bonn, Germany.
Bruker (2008).APEX2andSAINT. Bruker AXS Inc., Madison, Wisconsin, USA.
Sheldrick, G. M. (2008).Acta Cryst.A64, 112–122. Tiritiris, I. (2012).Acta Cryst.E68, o3118. Structure Reports
Online
supporting information
Acta Cryst. (2012). E68, o3253 [doi:10.1107/S1600536812044467]
Piperidine-1-carboximidamide
Ioannis Tiritiris
S1. Comment
1-Piperidinecarboxamidine, a guanidine derivative bearing one piperidine moiety, is similar to the structurally known
compound 4-morpholinecarboxamidine (Tiritiris, 2012). Our efforts to study guanidines for CO2 capturing, led to the
preparation of the title compound. Because its crystal structure was previously unknown, it was decided to conduct an
investigation. According to the structure analysis, the C1–N1 bond in the title compound is 1.3090 (17) Å, indicating
double bond character. The bond lengths C1–N2 = 1.3640 (17) Å and C1–N3 = 1.3773 (16) Å are elongated and
characteristic for a C–N amine single bond (Fig. 1). The N–C1–N angles are: 116.82 (12)° (N2–C1–N3), 119.08 (11)°
(N1–C1–N3) and 124.09 (11)° (N1–C1–N2), showing a deviation of the CN3 plane from an ideal trigonal-planar
geometry (Fig. 1). The structural parameters of the piperidine ring in the here presented title compound agree very well
with the data obtained from the X-ray analysis of the urea bis(piperidin-1-yl)methanone (Betz et al., 2011). In both crystal
structures the piperidine rings adopt a chair conformation. In contrast to the structure of 4-morpholinecarboxamidine
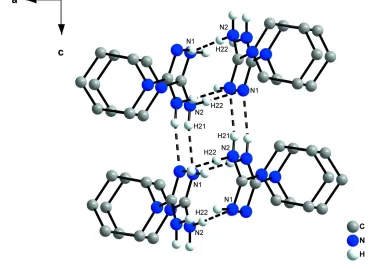
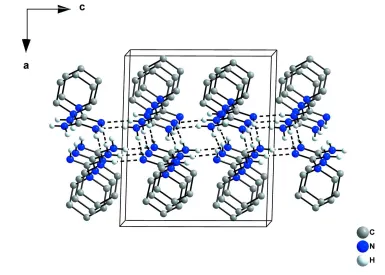
(Tiritiris, 2012), only strong N—H···N hydrogen bonds between nitrogen atoms of neighboring molecules (Fig. 2 and 3)
are present [d(H···N) = 2.15 (2) Å] (Tab. 1), forming an infinite two-dimensional network (base vectors [0 0 1] and [0 1
0]). Surprisingly, the imine hydrogen atom H11 is not involved in the hydrogen bonding system.
S2. Experimental
1-Piperidine-carboxamidinium sulfate (I) was prepared by heating one equivalent O-methylisourea sulfate with two
equivalents of piperidine under reflux. The methanol formed in the reaction was distilled off and (I) precipitated in nearly
quantitative yield. To a solution of 5.0 g (14 mmol) (I) in 50 ml water, a solution of 1.2 g (30 mmol) sodium hydroxide
dissolved in 25 ml water was added dropwise under ice cooling. After warming to room temperature the aqueous phase
was extracted with diethyl ether. The organic phase was finally dried over sodium sulfate. After evaporation of the
solvent, the title compound precipitated in form of a colorless solid. Yield: 1.5 g (84%). During the storage of a saturated
acetonitrile solution at 0° C, colorless single crystals of the title compound suitable for X-ray analysis were obtained. 1H
NMR (500 MHz, CD3CN/TMS): δ = 1.60–1.64 [m, 6 H, –CH2], 3.38–3.42 [m, 4 H,–CH2], 5.85 [s, 1 H, –NH], 6.19 [s, 2
H, –NH2]. 13C NMR (125 MHz, CD3CN/TMS): δ = 23.2 (–CH2), 24.7 (–CH2), 46.5 (–CH2), 157.4 (C═N).
S3. Refinement
The N-bound H atoms were located in a difference Fourier map and were refined freely [N—H = 0.91 (2)–0.94 (2) Å].
The hydrogen atoms of the methylene groups were placed in calculated positions with d(C—H) = 0.99 Å. They were
Figure 1
Molecular structure of the title compound with displacement ellipsoids at the 50% probability level.
Figure 2
[image:3.610.117.487.366.635.2]Figure 3
N–H···N hydrogen bonds generating a two-dimensional network, ac-view. The hydrogen bonds are indicated by dashed
lines.
Piperidine-1-carboximidamide
Crystal data
C6H13N3 Mr = 127.19 Monoclinic, P21/c
Hall symbol: -P 2ybc a = 12.2193 (9) Å b = 5.5784 (5) Å c = 10.4885 (7) Å β = 91.887 (4)° V = 714.55 (10) Å3 Z = 4
F(000) = 280 Dx = 1.182 Mg m−3
Melting point: 409 K
Cu Kα radiation, λ = 1.54178 Å Cell parameters from 4190 reflections θ = 3.6–73.5°
µ = 0.60 mm−1 T = 100 K Plate, colorless 0.45 × 0.26 × 0.06 mm
Data collection
Bruker Kappa APEXII DUO diffractometer
Radiation source: sealed tube Graphite monochromator φ scans, and ω scans
Absorption correction: multi-scan (Blessing, 1995)
Tmin = 0.830, Tmax = 0.965
4190 measured reflections 1413 independent reflections 1116 reflections with I > 2σ(I) Rint = 0.049
θmax = 73.5°, θmin = 3.6° h = −15→15
Refinement on F2
Least-squares matrix: full R[F2 > 2σ(F2)] = 0.045 wR(F2) = 0.112 S = 1.03 1413 reflections 94 parameters 0 restraints
Primary atom site location: structure-invariant direct methods
Secondary atom site location: difference Fourier map
Hydrogen site location: difference Fourier map H atoms treated by a mixture of independent
and constrained refinement w = 1/[σ2(F
o2) + (0.0625P)2]
where P = (Fo2 + 2Fc2)/3
(Δ/σ)max < 0.001
Δρmax = 0.19 e Å−3
Δρmin = −0.21 e Å−3
Special details
Geometry. All e.s.d.'s (except the e.s.d. in the dihedral angle between two l.s. planes) are estimated using the full covariance matrix. The cell e.s.d.'s are taken into account individually in the estimation of e.s.d.'s in distances, angles and torsion angles; correlations between e.s.d.'s in cell parameters are only used when they are defined by crystal symmetry. An approximate (isotropic) treatment of cell e.s.d.'s is used for estimating e.s.d.'s involving l.s. planes.
Refinement. Refinement of F2 against ALL reflections. The weighted R-factor wR and goodness of fit S are based on F2,
conventional R-factors R are based on F, with F set to zero for negative F2. The threshold expression of F2 > σ(F2) is used
only for calculating R-factors(gt) etc. and is not relevant to the choice of reflections for refinement. R-factors based on F2
are statistically about twice as large as those based on F, and R- factors based on ALL data will be even larger.
Fractional atomic coordinates and isotropic or equivalent isotropic displacement parameters (Å2)
x y z Uiso*/Ueq
C1 0.38570 (11) 0.2272 (2) 0.20721 (12) 0.0194 (3)
N1 0.41982 (10) 0.26476 (18) 0.32513 (11) 0.0229 (3)
H11 0.4665 (14) 0.393 (3) 0.3256 (16) 0.031 (4)*
N2 0.40843 (11) 0.37432 (19) 0.10763 (12) 0.0248 (3)
H21 0.4040 (14) 0.315 (3) 0.0240 (18) 0.037 (4)*
H22 0.4598 (14) 0.497 (3) 0.1251 (15) 0.035 (4)*
N3 0.32466 (10) 0.02529 (17) 0.17918 (10) 0.0225 (3)
C2 0.25890 (12) −0.0007 (2) 0.06138 (13) 0.0270 (4)
H2A 0.2591 −0.1706 0.0341 0.032*
H2B 0.2915 0.0964 −0.0067 0.032*
C3 0.14128 (12) 0.0807 (2) 0.08029 (14) 0.0279 (4)
H3A 0.1403 0.2540 0.1006 0.034*
H3B 0.0972 0.0553 0.0005 0.034*
C4 0.09150 (13) −0.0602 (2) 0.18847 (14) 0.0275 (3)
H4A 0.0179 0.0040 0.2054 0.033*
H4B 0.0833 −0.2304 0.1631 0.033*
C5 0.16364 (12) −0.0434 (2) 0.30906 (14) 0.0273 (4)
H5A 0.1341 −0.1493 0.3754 0.033*
H5B 0.1629 0.1231 0.3416 0.033*
C6 0.28172 (12) −0.1171 (2) 0.28289 (13) 0.0246 (3)
H6A 0.3282 −0.0937 0.3610 0.030*
Atomic displacement parameters (Å2)
U11 U22 U33 U12 U13 U23
C1 0.0203 (7) 0.0167 (6) 0.0211 (7) 0.0021 (4) 0.0004 (5) −0.0011 (4) N1 0.0271 (7) 0.0187 (5) 0.0228 (6) −0.0023 (4) −0.0013 (5) −0.0015 (4) N2 0.0335 (7) 0.0211 (5) 0.0196 (6) −0.0053 (5) −0.0011 (5) −0.0009 (4) N3 0.0256 (7) 0.0203 (5) 0.0214 (6) −0.0032 (4) −0.0036 (5) 0.0001 (4) C2 0.0329 (9) 0.0261 (6) 0.0218 (7) −0.0065 (5) −0.0021 (6) −0.0037 (5) C3 0.0309 (9) 0.0274 (6) 0.0249 (8) −0.0016 (6) −0.0091 (6) 0.0017 (5) C4 0.0261 (8) 0.0268 (7) 0.0295 (8) 0.0009 (5) −0.0013 (6) −0.0002 (5) C5 0.0313 (9) 0.0251 (6) 0.0254 (8) −0.0022 (5) 0.0012 (6) 0.0016 (5) C6 0.0292 (8) 0.0197 (6) 0.0247 (7) −0.0019 (5) −0.0040 (6) 0.0048 (5)
Geometric parameters (Å, º)
C1—N1 1.3090 (17) C3—C4 1.5235 (19)
C1—N2 1.3640 (17) C3—H3A 0.9900
C1—N3 1.3773 (16) C3—H3B 0.9900
N1—H11 0.913 (17) C4—C5 1.521 (2)
N2—H21 0.937 (18) C4—H4A 0.9900
N2—H22 0.943 (17) C4—H4B 0.9900
N3—C6 1.4585 (17) C5—C6 1.534 (2)
N3—C2 1.4587 (17) C5—H5A 0.9900
C2—C3 1.526 (2) C5—H5B 0.9900
C2—H2A 0.9900 C6—H6A 0.9900
C2—H2B 0.9900 C6—H6B 0.9900
N1—C1—N2 124.09 (11) C2—C3—H3B 109.6
N1—C1—N3 119.08 (11) H3A—C3—H3B 108.2
N2—C1—N3 116.82 (12) C5—C4—C3 110.67 (12)
C1—N1—H11 108.1 (11) C5—C4—H4A 109.5
C1—N2—H21 119.8 (10) C3—C4—H4A 109.5
C1—N2—H22 116.1 (10) C5—C4—H4B 109.5
H21—N2—H22 117.2 (14) C3—C4—H4B 109.5
C1—N3—C6 119.46 (11) H4A—C4—H4B 108.1
C1—N3—C2 122.78 (10) C4—C5—C6 110.95 (12)
C6—N3—C2 112.09 (10) C4—C5—H5A 109.4
N3—C2—C3 110.80 (11) C6—C5—H5A 109.4
N3—C2—H2A 109.5 C4—C5—H5B 109.4
C3—C2—H2A 109.5 C6—C5—H5B 109.4
N3—C2—H2B 109.5 H5A—C5—H5B 108.0
C3—C2—H2B 109.5 N3—C6—C5 110.55 (11)
H2A—C2—H2B 108.1 N3—C6—H6A 109.5
C4—C3—C2 110.12 (11) C5—C6—H6A 109.5
C4—C3—H3A 109.6 N3—C6—H6B 109.5
N2—C1—N3—C6 −169.57 (11) C2—C3—C4—C5 53.91 (15)
N1—C1—N3—C2 162.94 (12) C3—C4—C5—C6 −53.30 (14)
N2—C1—N3—C2 −18.25 (18) C1—N3—C6—C5 95.35 (14)
C1—N3—C2—C3 −93.09 (14) C2—N3—C6—C5 −58.83 (14)
C6—N3—C2—C3 60.10 (13) C4—C5—C6—N3 55.17 (13)
Hydrogen-bond geometry (Å, º)
D—H···A D—H H···A D···A D—H···A
N2—H21···N1i 0.94 (2) 2.15 (2) 3.071 (1) 168 (1)
N2—H22···N1ii 0.94 (2) 2.15 (2) 3.090 (1) 177 (1)