878
https://doi.org/10.1107/S2056989018007971 Acta Cryst.(2018). E74, 878–883research communications
Received 16 April 2018 Accepted 30 May 2018
Edited by L. Fabian, University of East Anglia, England
Keywords:crystal structure; carbazole; Hirsh-feld surface analysis; two-dimensional finger-print plot; energy frameworks.
CCDC reference:1825258
Supporting information:this article has supporting information at journals.iucr.org/e
Crystal structure determination, Hirshfeld surface
analysis and energy frameworks of
6-phenyl-sulfonyl-6
H
-thieno[3,2-
c
]carbazole
U. Mohamooda Sumaya,aE. Sankar,bK. Arasambattu MohanaKrishnan,bK. Birunthaaand G. Ushac*
aDepartment of Physics, Bharathi Women’s College (A), Chennai-108, Tamilnadu, India,bDepartment of organic
Chemistry, University of Madras, Chennai-25, Tamilnadu, India, andcPG and Research Department of Physics, Queen
Mary’s College (A), Chennai-4, Tamilnadu, India. *Correspondence e-mail: [email protected]
In the title compound, C20H13NO2S2, the carbazole ring system forms a dihedral
angle of 89.08 (1)with the sulfonyl-substituted phenyl ring. Intramolecular C—
H O hydrogen bonds involving the sulfone O atoms and the carbazole moiety result in two S(6) rings. In the crystal, molecules are linked viapairs of C— H O hydrogen bonds forming inversion dimers with anR22(12) graph-set motif. Analysis of the Hirshfeld surfaces and two-dimensional fingerprint plots was used to explore the distribution of weak intermolecular interactions in the crystal structure.
1. Chemical context
Carbazole derivatives are among the most important and highly exploited heterocyclic compounds in the field of medicinal chemistry. They have been attractive to researchers because of their broad spectrum of biological activities, such as anti-oxidative (Tachibanaet al., 2001), antitumor (Itoigawaet al., 2000), anti-inflammatory and antimutagenic (Ramsewaket al., 1999), antibiotic, antifungal and cytotoxic (Chakrabortyet al., 1965, 1978), pim kinase inhibitory (Giraud et al., 2014), antimicrobial (Gu et al., 2014) and anti-Alzheimer (Thir-atmatrakulet al., 2014). Carbazole derivatives are also used as precursor compounds for the synthesis of pyridocarbazole alkaloids (Karmakaret al., 1991).
2. Structural commentary
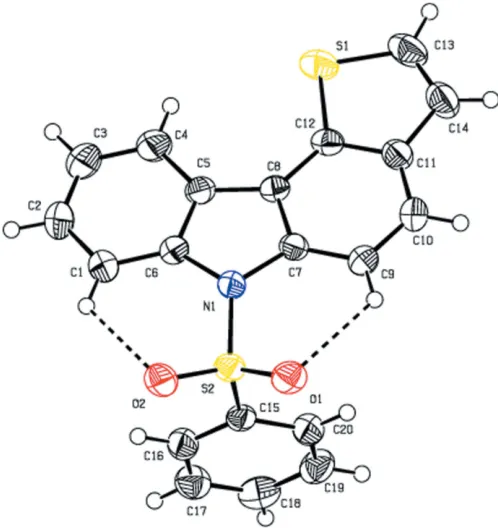
The molecular structure of the title compound is illustrated in Fig.1. The title compound comprises a carbazole ring system, which is attached to a phenyl sulfonyl ring and a thiopene ring. The carbazole ring system forms a dihedral angle of 89.08 (1)
with the sulfonyl-substituted phenyl ring. The tetrahedral configuration is distorted around the atom S2. The increase in the O2—S2—O1 angle [120.14 (9)], with a simultaneous
decrease in the N1—S2—C15 angle [104.96 (9)] from the
ideal tetrahedral value (109.5) are attributed to the Thorpe–
Ingold effect (Bassindale, 1984). The N1—C6 [1.428 (2) A˚ ] and N1—C7 [1.429 (2) A˚ ] bond lengths in the molecule are longer than the mean Nsp2—Csp2 bond length value of 1.355 (14) A˚ (Allen et al., 1987; Groom et al., 2016). The elongation observed may be due to the electron-withdrawing character of the phenylsulfonyl group. The molecular
struc-ture is stabilized by C1—H1 O2 and C9—H9 O1 intra-molecular interactions involving the sulfone oxygen atoms, which generate twoS(6) ring motifs (Fig. 1).
3. Supramolecular features
In the crystal packing (Fig. 2), the molecules are linkedvia
pairs of C—H O hydrogen bonds (Table 1), forming inver-sion dimers with anR2
2(12) graph-set motif. Each molecule is
involved in the formation of two dimers that propagate as a ribbon in thec-axis direction.
4. Hirshfeld surface analysis, interaction energies and energy frameworks
In order to investigate the weak intermolecular interactions in the crystal, the Hirshfeld surfaces (dnorm, curvedness and shape index) and 2D fingerprint plots were generated using
CrystalExplorer 17.5(Turneret al., 2017). Thednormmapping uses the normalized functions ofdiandde(Fig. 3a), with white, red and blue coloured surfaces wheredi(xaxis) andde(yaxis) are the closest internal and external distances from a given point on the Hirshfeld surface to the nearest atom. The white surface indicates those contacts with distances equal to the sum of van der Waals (vdW) radii, red indicates shorter
Figure 1
[image:2.610.45.294.71.335.2]The molecular structure of the title compound with the atom labelling. Displacement ellipsoids are drawn at the 50% probability level. Dashed lines indicate the intramolecular C—H O hydrogen bonds, which generateS(6) ring motifs.
Figure 2
The crystal packing of the title compound, viewed along the a axis. Dashed lines indicate intermolecular hydrogen bonds. For clarity, only the H atoms involved in these interactions have been included.
Table 1
Hydrogen-bond geometry (A˚ ,).
Cg5 is the centroid of the C15–C20 ring.
D—H A D—H H A D A D—H A
C1—H1 O2 0.93 2.34 2.935 (3) 121
C1—H1 O2i 0.93 2.62 3.443 (3) 148
C9—H9 O1 0.93 2.35 2.949 (3) 122
C9—H9 O1ii 0.93 2.57 3.382 (2) 146
C13—H13 Cg5iii 0.93 2.82 3.604 (2) 143
[image:2.610.312.565.108.176.2] [image:2.610.48.293.512.704.2]Symmetry codes: (i)xþ1;y;zþ1; (ii)xþ1;y;z; (iii)x;yþ1;z.
Figure 3
[image:2.610.314.565.531.701.2]contacts (< vdW radii) and blue longer contacts (> vdW radii). The electrostatic potential was also mapped on the Hirshfeld surface using a STO-3G basis set and the Hartee–Fock level of theory (Spackmanet al., 2008; Jayatilakaet al., 2005). The C— H O hydrogen-bond donors and acceptors are shown as blue and red regions around the atoms corresponding to positive and negative electrostatic potentials, respectively (Fig. 3b). The presence of – stacking interactions is indi-cated by red and blue triangles on the shape-index surface (Fig. 3c). Areas on the Hirshfeld surface with high curvedness
tend to divide the surface into contact patches with each neighbouring molecule. The coordination number in the crystal is defined by the curvedness of the Hirshfeld surface (Fig. 3d). The nearest neighbour coordination environment of a molecule is identified from the colour patches on the Hirshfeld surface depending on their closeness to adjacent molecules (Fig. 3e).
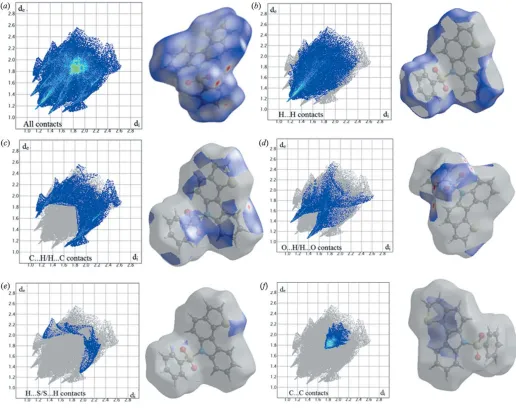
Two-dimensional fingerprint plots showing the occurrence of all intermolecular contacts (McKinnon et al., 2007) are presented in Fig. 4a. The fingerprint plot of H H contacts, which represent the largest contribution to the Hirshfeld surfaces (40%), shows a distinct pattern with a minimum value of de = di ’1.2 A˚ (Fig. 4b). The C H/H C interactions appear as the next largest region of the fingerprint plot, highly concentrated at the edges, having almost the samede+di’
2.7 A˚ (Fig. 4c), with an overall Hirshfeld surface contribution of 24.1%. The O H/H O interactions on the fingerprint
880
Mohamooda Sumayaet al. C20H13NO2S2 Acta Cryst.(2018). E74, 878–883
[image:3.610.45.296.93.135.2]research communications
Figure 4
Two-dimensional fingerprint plots for the title compound showing the contributions of different types of interactions: (a) all intermolecular contacts, (b) H H contacts, (c) C H/H C contacts, (d) O H/H O contacts, (e) H S/S H contacts and (f) C C contacts. The outline of the the full fingerprint is shown in gray. Surfaces to the right highlight the relevant surface patches associated with the specific contact type and are coloured asdnorm. Table 2
Scale factors for benchmarked energy model.
Energy model kelec kpol kenergy-dispersive krep
CE-B3LYP B3LYP/6–31G(d,p) electron densities
[image:3.610.46.562.295.703.2]plot, which contribute 15.1% of the total Hirshfeld surface withde+di’2.5 A˚ (Fig. 4d), are shown as two symmetrical narrow pointed wings. The H S/S H interactions cover only 3.5% (Fig. 4e) of the surface. The C C contacts, which are the measure of–stacking interactions, occupy 8.7% of the Hirshfeld surface and appear as a unique triangle atde=di ’ 1.8 A˚ (Fig. 4f). These are the weak interactions that contribute the most to the packing of the title compound.
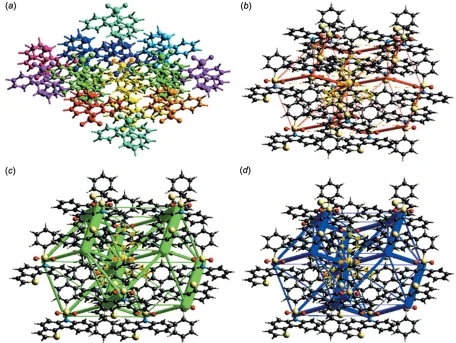
The interaction energy between the molecules is expressed in terms of four components: electrostatic, polarization, dispersion and exchange repulsion. These energies were obtained using monomer wavefunctions calculated at the B3LYP/6-31G(d,p) level. The total interaction energy, which is the sum of scaled components, was calculated for a 3.8 A˚ radius cluster of molecules around the selected molecule (Fig. 5a). The scale factors used in the CE-B3LYP
bench-Table 3
Interaction energies (kJ mol1) between a reference molecule and its neighbours.
Nis the number of equivalent neighbours,Ris the distance between molecular centroids (mean atomic position) in A˚ . The colours identify molecules in Fig. 5a, with the reference molecule shown in grey.
Colour N symmetry R Eelec Epol Eenergy-dispersive Erep Etotal
Red 1 inversion 9.29 3.7 1.5 27.5 14.6 20.0
Orange 1 inversion 8.65 0.9 1.4 23.3 10.3 14.0
Yellow 1 inversion 6.18 12.2 2.6 83.1 54.3 53.7
Green 2 translation 12.53 1.7 0.5 7.3 2.4 3.4
Lime 2 translation 9.88 2.4 0.6 19.5 14.0 11.3
Aqua 2 translation 7.65 4.5 2.1 12.1 5.4 13.5
Cyan 1 inversion 7.79 17.5 4.8 23.5 16.7 32.2
Blue 1 inversion 8.76 19.3 5.0 26.9 22.3 33.8
Indigo 1 inversion 5.84 11.7 2.7 87.7 51.5 58.9
Purple 2 translation 11.22 1.9 0.4 6.9 3.6 2.0
[image:4.610.53.567.116.238.2]Pink 1 inversion 10.79 2.6 0.4 8.1 2.1 8.8
Figure 5
[image:4.610.76.532.380.723.2]marked energy model (Mackenzie et al., 2017) are given in Table 2. The interaction energies calculated by the energy model reveal that the interactions in crystal have a significant contribution from dispersion components (Table 3). Using energy frameworks, the magnitudes of the intermolecular interaction energies are represented graphically and the supramolecular architecture of the crystal structure is visua-lized. Energies between molecular pairs are represented as cylinders joining the centroids of pairs of molecules, with the cylinder radius proportional to the magnitude of the inter-action energy. Frameworks were constructed forEelec as red cylinders,Edisas green andEtotas blue (Fig. 5b–5d) and these cylinders represent the relative strength of molecular packing in different directions.
5. Synthesis and crystallization
The first step was the alkylation of 3-(phenyl-sulfonylmethyl)thiophene (0.7 g, 2.21 mmol) with 2-bromo-methyl-1-phenylsulfonylindol (0.85 g, 2.43 mmol) using
t-BuOK (0.37 g, 3.32 mmol) in DMF (20 mL) at 278–283 K for 15 min. After completion of the reaction, the reaction mixture was poured into crushed ice. The solid obtained was filtered and dried to afford the alkylated sulfone (1.16 g) as a colourless solid. To a solution of the crude alkylated sulfone (1.16 g, 1.97 mmol) in DMF (15 mL), Pd(OAc)2 (0.04 g,
0.19 mmol), PPh3 (0.10 g, 0.39 mmol) and K2CO3 (0.55 g,
3.94 mmol) were added. Then the reaction mixture was heated at 353 K for 2 h. After that, the reaction mixture was filtered through a celite bed and washed with ethyl acetate (2
10 mL). The combined organic layer was washed with water (3
20 mL) and dried (Na2SO4). Removal of the solvent
followed by column chromatographic purification (silica gel, 100% hexane) afforded 6-(phenylsulfonyl)-6H
-thieno[3,2-c]carbazole (0.50 g, 70%) as a colourless solid (Fig. 6). Diffraction-quality crystals were obtained from the product by slow evaporation using chloroform as a solvent; m.p. 417– 419 K.
6. Refinement
Crystal data, data collection and structure refinement details are summarized in Table 4. All H atoms were positioned geometrically (C—H = 0.93 A˚ ) and refined using a riding model with Uiso(H) = 1.2Ueq(C). In the final refinement, reflection (001), which was obstructed by the beam stop, was omitted.
Acknowledgements
The authors thank the Central Instrumentation Facility (DST– FIST), Queen Mary’s College (A), Chennai-4 for the computing facility and SAIF, IIT, Madras, for the X-ray data-collection facility.
References
Allen, F. H., Kennard, O., Watson, D. G., Brammer, L., Orpen, A. G. & Taylor, R. (1987).J. Chem. Soc. Perkin Trans. 2, pp. S1–19. Bassindale, A. (1984).The Third Dimension in Organic Chemistry,
ch. 1, p. 11. New York: John Wiley and Sons.
Bruker (2012).APEX2,SAINT,XPREPandSADABS. Bruker AXS Inc., Madison, Wisconsin, USA.
Chakraborty, D. P., Barman, B. K. & Bose, P. K. (1965).Tetrahedron,
21, 681–685.
Chakraborty, D. P., Bhattacharyya, P., Roy, S., Bhattacharyya, S. P. & Biswas, A. K. (1978).Phytochemistry,17, 834–835.
Farrugia, L. J. (2012).J. Appl. Cryst.45, 849–854.
Giraud, F., Bourhis, M., Nauton, L., The´ry, V., Herfindal, L., Døskeland, S. O., Anizon, F. & Moreau, P. (2014).Bioorg. Chem. 57, 108–115.
Groom, C. R., Bruno, I. J., Lightfoot, M. P. & Ward, S. C. (2016).Acta Cryst.B72, 171–179.
Gu, W., Qiao, C., Wang, S. F., Hao, Y. & Miao, T. T. (2014).Bioorg. Med. Chem. Lett.24, 328–331.
Itoigawa, M., Kashiwada, Y., Ito, C., Furukawa, H., Tachibana, Y., Bastow, K. F. & Lee, K. H. (2000).J. Nat. Prod.63, 893–897. Jayatilaka, D., Grimwood, D. J., Lee, A., Lemay, A., Russel, A. J.,
Taylor, C., Wolff, S. K., Cassam-Chenai, P. & Whitton, A. (2005).
TONTO-- A System for Computational Chemistry. Available at: http://hirshfeldsurface.net/
882
Mohamooda Sumayaet al. C20H13NO2S2 Acta Cryst.(2018). E74, 878–883
[image:5.610.311.560.90.358.2]research communications
Figure 6 Reaction scheme. Table 4 Experimental details. Crystal dataChemical formula C20H13NO2S2
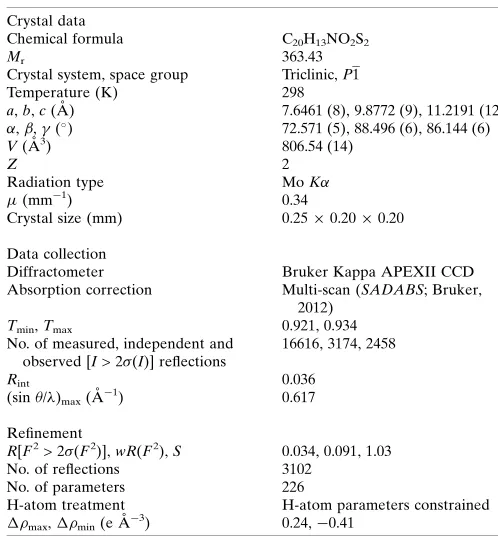
Mr 363.43
Crystal system, space group Triclinic,P1
Temperature (K) 298
a,b,c(A˚ ) 7.6461 (8), 9.8772 (9), 11.2191 (12) ,,() 72.571 (5), 88.496 (6), 86.144 (6)
V(A˚3) 806.54 (14)
Z 2
Radiation type MoK
(mm1) 0.34
Crystal size (mm) 0.250.200.20
Data collection
Diffractometer Bruker Kappa APEXII CCD
Absorption correction Multi-scan (SADABS; Bruker, 2012)
Tmin,Tmax 0.921, 0.934
No. of measured, independent and observed [I> 2(I)] reflections
16616, 3174, 2458
Rint 0.036
(sin/ )max(A˚
1) 0.617
Refinement
R[F2> 2(F2)],wR(F2),S 0.034, 0.091, 1.03
No. of reflections 3102
No. of parameters 226
H-atom treatment H-atom parameters constrained max,min(e A˚
3) 0.24,0.41
Computer programs: APEX2, SAINT and XPREP (Bruker, 2012), SHELXS97
Karmakar, A. C., Kar, G. K. & Ray, J. K. (1991).J. Chem. Soc. Perkin Trans. 1, pp. 1997–2002.
Mackenzie, C. F., Spackman, P. R., Jayatilaka, D. & Spackman, M. A. (2017).IUCrJ,4, 575–587.
McKinnon, J. J., Jayatilaka, D. & Spackman, M. A. (2007). Chem. Commun.pp. 3814–3816.
Ramsewak, R. S., Nair, M. G., Strasburg, G. M., DeWitt, D. L. & Nitiss, J. L. (1999).J. Agric. Food Chem.47, 444–447.
Sheldrick, G. M. (2008).Acta Cryst.A64, 112–122. Sheldrick, G. M. (2015).Acta Cryst.C71, 3–8.
Spackman, M. A., McKinnon, J. J. & Jayatilaka, D. (2008).
CrystEngComm,10, 377–388.
Tachibana, Y., Kikuzaki, H., Lajis, N. H. & Nakatani, N. (2001).J. Agric. Food Chem.49, 5589–5594.
Thiratmatrakul, S., Yenjai, C., Waiwut, P., Vajragupta, O., Reubroy-charoen, P., Tohda, M. & Boonyarat, C. (2014).Eur. J. Med. Chem. 75, 21–30.
Turner, M. J., McKinnon, J. J., Wolff, S. K., Grimwood, D. J., Spackman, P. R., Jayatilaka, D. & Spackman, M. A. (2017).
supporting information
sup-1 Acta Cryst. (2018). E74, 878-883
supporting information
Acta Cryst. (2018). E74, 878-883 [https://doi.org/10.1107/S2056989018007971]
Crystal structure determination, Hirshfeld surface analysis and energy
frameworks of 6-phenylsulfonyl-6
H
-thieno[3,2-
c
]carbazole
U. Mohamooda Sumaya, E. Sankar, K. Arasambattu MohanaKrishnan, K. Biruntha and G. Usha
Computing details
Data collection: APEX2 (Bruker, 2012); cell refinement: APEX2 and SAINT (Bruker, 2012); data reduction: SAINT and
XPREP (Bruker, 2012); program(s) used to solve structure: SHELXS97 (Sheldrick, 2008); program(s) used to refine
structure: SHELXL2014 (Sheldrick, 2015); molecular graphics: ORTEP-3 for Windows (Farrugia, 2012); software used to
prepare material for publication: SHELXL2014 (Sheldrick, 2015).
6-Phenylsulfonyl-6H-thieno[3,2-c]carbazole
Crystal data
C20H13NO2S2
Mr = 363.43
Triclinic, P1
a = 7.6461 (8) Å
b = 9.8772 (9) Å
c = 11.2191 (12) Å
α = 72.571 (5)°
β = 88.496 (6)°
γ = 86.144 (6)°
V = 806.54 (14) Å3
Z = 2
F(000) = 376
Dx = 1.497 Mg m−3
Mo Kα radiation, λ = 0.71073 Å
Cell parameters from 3175 reflections
θ = 2.4–28.8°
µ = 0.34 mm−1
T = 298 K
Needle, colourless 0.25 × 0.20 × 0.20 mm
Data collection
Bruker Kappa APEXII CCD diffractometer
Radiation source: fine-focus sealed tube
ω and φ scan
Absorption correction: multi-scan (SADABS; Bruker, 2012)
Tmin = 0.921, Tmax = 0.934
16616 measured reflections
3174 independent reflections 2458 reflections with I > 2σ(I)
Rint = 0.036
θmax = 26.0°, θmin = 2.4°
h = −9→9
k = −12→12
l = −13→13
Refinement
Refinement on F2
Least-squares matrix: full
R[F2 > 2σ(F2)] = 0.034
wR(F2) = 0.091
S = 1.03
3102 reflections 226 parameters 0 restraints
Hydrogen site location: inferred from neighbouring sites
H-atom parameters constrained
w = 1/[σ2(F
o2) + (0.0389P)2 + 0.3787P]
where P = (Fo2 + 2Fc2)/3 (Δ/σ)max < 0.001
Δρmax = 0.24 e Å−3
sup-2 Acta Cryst. (2018). E74, 878-883
Special details
Geometry. All esds (except the esd in the dihedral angle between two l.s. planes) are estimated using the full covariance matrix. The cell esds are taken into account individually in the estimation of esds in distances, angles and torsion angles; correlations between esds in cell parameters are only used when they are defined by crystal symmetry. An approximate (isotropic) treatment of cell esds is used for estimating esds involving l.s. planes.
Fractional atomic coordinates and isotropic or equivalent isotropic displacement parameters (Å2)
x y z Uiso*/Ueq
C1 0.3947 (3) 0.2820 (2) 0.4004 (2) 0.0462 (5)
H1 0.4480 0.1960 0.4478 0.055*
C2 0.3350 (4) 0.3854 (3) 0.4540 (2) 0.0590 (7)
H2 0.3496 0.3685 0.5394 0.071*
C3 0.2541 (4) 0.5137 (3) 0.3848 (2) 0.0614 (7)
H3 0.2148 0.5806 0.4242 0.074*
C4 0.2317 (3) 0.5426 (2) 0.2583 (2) 0.0478 (6)
H4 0.1776 0.6287 0.2118 0.057*
C5 0.2909 (3) 0.44110 (19) 0.20083 (18) 0.0327 (4)
C6 0.3716 (3) 0.31203 (19) 0.27287 (18) 0.0331 (4)
C7 0.3683 (2) 0.30993 (19) 0.06791 (17) 0.0313 (4)
C8 0.2892 (2) 0.43910 (19) 0.07345 (17) 0.0300 (4)
C9 0.3877 (3) 0.2747 (2) −0.04358 (19) 0.0395 (5)
H9 0.4417 0.1880 −0.0450 0.047*
C10 0.3247 (3) 0.3722 (2) −0.1510 (2) 0.0432 (5)
H10 0.3350 0.3499 −0.2259 0.052*
C11 0.2454 (3) 0.5042 (2) −0.15089 (19) 0.0378 (5)
C12 0.2289 (2) 0.53705 (19) −0.03801 (19) 0.0335 (4)
C13 0.1126 (3) 0.7312 (2) −0.2176 (2) 0.0526 (6)
H13 0.0633 0.8143 −0.2728 0.063*
C14 0.1762 (3) 0.6197 (2) −0.2532 (2) 0.0499 (6)
H14 0.1756 0.6172 −0.3354 0.060*
C15 0.2718 (3) −0.02095 (18) 0.26426 (18) 0.0318 (4)
C16 0.2018 (3) −0.0612 (2) 0.38416 (19) 0.0392 (5)
H16 0.2624 −0.0493 0.4508 0.047*
C17 0.0401 (3) −0.1193 (2) 0.4027 (2) 0.0458 (5)
H17 −0.0082 −0.1480 0.4826 0.055*
C18 −0.0494 (3) −0.1347 (2) 0.3035 (2) 0.0482 (6)
H18 −0.1589 −0.1727 0.3166 0.058*
C19 0.0212 (3) −0.0946 (2) 0.1843 (2) 0.0473 (5)
H19 −0.0408 −0.1052 0.1178 0.057*
C20 0.1835 (3) −0.0388 (2) 0.1641 (2) 0.0405 (5)
H20 0.2332 −0.0135 0.0845 0.049*
O1 0.55980 (19) 0.02188 (14) 0.13545 (14) 0.0426 (4)
O2 0.56255 (19) 0.02622 (14) 0.35412 (13) 0.0423 (4)
S1 0.13085 (7) 0.70590 (5) −0.05968 (6) 0.04557 (17)
S2 0.47505 (6) 0.05704 (5) 0.23770 (5) 0.03323 (14)
supporting information
sup-3 Acta Cryst. (2018). E74, 878-883
Atomic displacement parameters (Å2)
U11 U22 U33 U12 U13 U23
C1 0.0662 (15) 0.0380 (12) 0.0332 (12) −0.0017 (10) −0.0041 (11) −0.0091 (9)
C2 0.094 (2) 0.0533 (14) 0.0340 (12) −0.0060 (13) 0.0035 (13) −0.0189 (11)
C3 0.095 (2) 0.0454 (14) 0.0500 (15) −0.0002 (13) 0.0092 (14) −0.0256 (12)
C4 0.0623 (15) 0.0344 (11) 0.0468 (13) 0.0051 (10) 0.0037 (11) −0.0143 (10)
C5 0.0353 (11) 0.0284 (9) 0.0352 (11) −0.0037 (8) 0.0016 (8) −0.0105 (8)
C6 0.0376 (11) 0.0299 (10) 0.0331 (10) −0.0034 (8) 0.0006 (8) −0.0111 (8)
C7 0.0332 (10) 0.0278 (9) 0.0313 (10) −0.0025 (7) −0.0018 (8) −0.0060 (8)
C8 0.0289 (10) 0.0267 (9) 0.0345 (10) −0.0039 (7) 0.0000 (8) −0.0091 (8)
C9 0.0520 (13) 0.0321 (10) 0.0361 (11) 0.0008 (9) 0.0007 (10) −0.0138 (9)
C10 0.0570 (14) 0.0434 (12) 0.0312 (11) −0.0052 (10) −0.0007 (10) −0.0138 (9)
C11 0.0395 (12) 0.0363 (11) 0.0349 (11) −0.0065 (9) −0.0049 (9) −0.0053 (9)
C12 0.0315 (10) 0.0274 (9) 0.0394 (11) −0.0043 (8) −0.0022 (8) −0.0057 (8)
C13 0.0534 (15) 0.0415 (13) 0.0508 (14) 0.0009 (10) −0.0151 (11) 0.0051 (11)
C14 0.0554 (15) 0.0509 (14) 0.0369 (12) −0.0075 (11) −0.0106 (11) −0.0012 (10)
C15 0.0354 (11) 0.0243 (9) 0.0354 (11) 0.0050 (7) −0.0050 (8) −0.0095 (8)
C16 0.0436 (12) 0.0368 (11) 0.0365 (11) 0.0035 (9) −0.0044 (9) −0.0111 (9)
C17 0.0472 (13) 0.0432 (12) 0.0455 (13) −0.0025 (10) 0.0070 (11) −0.0116 (10)
C18 0.0366 (12) 0.0391 (12) 0.0694 (16) −0.0011 (9) 0.0007 (11) −0.0173 (11)
C19 0.0470 (13) 0.0443 (12) 0.0546 (14) −0.0018 (10) −0.0144 (11) −0.0199 (11)
C20 0.0470 (13) 0.0366 (11) 0.0373 (11) 0.0013 (9) −0.0045 (10) −0.0106 (9)
O1 0.0446 (9) 0.0362 (8) 0.0472 (9) 0.0064 (6) 0.0048 (7) −0.0150 (6)
O2 0.0417 (8) 0.0387 (8) 0.0427 (9) 0.0048 (6) −0.0145 (7) −0.0066 (6)
S1 0.0462 (3) 0.0317 (3) 0.0526 (4) 0.0048 (2) −0.0053 (3) −0.0043 (2)
S2 0.0342 (3) 0.0271 (2) 0.0365 (3) 0.00447 (18) −0.0042 (2) −0.0077 (2)
N1 0.0429 (10) 0.0271 (8) 0.0287 (8) 0.0026 (7) −0.0039 (7) −0.0077 (7)
Geometric parameters (Å, º)
C1—C2 1.380 (3) C11—C14 1.437 (3)
C1—C6 1.385 (3) C12—S1 1.7323 (19)
C1—H1 0.9300 C13—C14 1.338 (3)
C2—C3 1.386 (4) C13—S1 1.722 (3)
C2—H2 0.9300 C13—H13 0.9300
C3—C4 1.374 (3) C14—H14 0.9300
C3—H3 0.9300 C15—C20 1.387 (3)
C4—C5 1.392 (3) C15—C16 1.387 (3)
C4—H4 0.9300 C15—S2 1.760 (2)
C5—C6 1.401 (3) C16—C17 1.382 (3)
C5—C8 1.435 (3) C16—H16 0.9300
C6—N1 1.428 (2) C17—C18 1.374 (3)
C7—C8 1.392 (3) C17—H17 0.9300
C7—C9 1.397 (3) C18—C19 1.382 (3)
C7—N1 1.429 (2) C18—H18 0.9300
C8—C12 1.399 (3) C19—C20 1.378 (3)
sup-4 Acta Cryst. (2018). E74, 878-883
C9—H9 0.9300 C20—H20 0.9300
C10—C11 1.401 (3) O1—S2 1.4233 (15)
C10—H10 0.9300 O2—S2 1.4236 (15)
C11—C12 1.399 (3) S2—N1 1.6572 (16)
C2—C1—C6 117.0 (2) C8—C12—S1 128.08 (16)
C2—C1—H1 121.5 C14—C13—S1 113.43 (17)
C6—C1—H1 121.5 C14—C13—H13 123.3
C1—C2—C3 122.1 (2) S1—C13—H13 123.3
C1—C2—H2 118.9 C13—C14—C11 112.8 (2)
C3—C2—H2 118.9 C13—C14—H14 123.6
C4—C3—C2 120.5 (2) C11—C14—H14 123.6
C4—C3—H3 119.8 C20—C15—C16 121.34 (19)
C2—C3—H3 119.8 C20—C15—S2 119.11 (16)
C3—C4—C5 119.1 (2) C16—C15—S2 119.55 (16)
C3—C4—H4 120.5 C17—C16—C15 118.7 (2)
C5—C4—H4 120.5 C17—C16—H16 120.6
C4—C5—C6 119.44 (19) C15—C16—H16 120.6
C4—C5—C8 132.60 (19) C18—C17—C16 120.2 (2)
C6—C5—C8 107.96 (16) C18—C17—H17 119.9
C1—C6—C5 121.89 (18) C16—C17—H17 119.9
C1—C6—N1 130.16 (18) C17—C18—C19 120.8 (2)
C5—C6—N1 107.91 (17) C17—C18—H18 119.6
C8—C7—C9 122.62 (18) C19—C18—H18 119.6
C8—C7—N1 108.02 (16) C20—C19—C18 120.0 (2)
C9—C7—N1 129.33 (17) C20—C19—H19 120.0
C7—C8—C12 118.03 (17) C18—C19—H19 120.0
C7—C8—C5 108.38 (16) C19—C20—C15 119.0 (2)
C12—C8—C5 133.58 (18) C19—C20—H20 120.5
C10—C9—C7 117.95 (19) C15—C20—H20 120.5
C10—C9—H9 121.0 C13—S1—C12 91.09 (11)
C7—C9—H9 121.0 O1—S2—O2 120.14 (9)
C9—C10—C11 121.76 (19) O1—S2—N1 106.94 (8)
C9—C10—H10 119.1 O2—S2—N1 106.82 (8)
C11—C10—H10 119.1 O1—S2—C15 108.46 (9)
C12—C11—C10 119.05 (18) O2—S2—C15 108.51 (9)
C12—C11—C14 111.32 (19) N1—S2—C15 104.96 (9)
C10—C11—C14 129.6 (2) C6—N1—C7 107.66 (15)
C11—C12—C8 120.57 (18) C6—N1—S2 124.02 (13)
C11—C12—S1 111.34 (15) C7—N1—S2 124.80 (13)
C6—C1—C2—C3 0.5 (4) C12—C11—C14—C13 0.1 (3)
C1—C2—C3—C4 −0.5 (4) C10—C11—C14—C13 −178.9 (2)
C2—C3—C4—C5 0.2 (4) C20—C15—C16—C17 −0.4 (3)
C3—C4—C5—C6 0.1 (3) S2—C15—C16—C17 178.53 (15)
C3—C4—C5—C8 −179.2 (2) C15—C16—C17—C18 −0.8 (3)
C2—C1—C6—C5 −0.2 (3) C16—C17—C18—C19 0.9 (3)
supporting information
sup-5 Acta Cryst. (2018). E74, 878-883
C4—C5—C6—C1 −0.1 (3) C18—C19—C20—C15 −1.4 (3)
C8—C5—C6—C1 179.39 (19) C16—C15—C20—C19 1.6 (3)
C4—C5—C6—N1 −177.79 (18) S2—C15—C20—C19 −177.40 (15)
C8—C5—C6—N1 1.7 (2) C14—C13—S1—C12 0.00 (19)
C9—C7—C8—C12 −0.6 (3) C11—C12—S1—C13 0.04 (16)
N1—C7—C8—C12 177.62 (16) C8—C12—S1—C13 179.58 (19)
C9—C7—C8—C5 −179.87 (18) C20—C15—S2—O1 −30.91 (17)
N1—C7—C8—C5 −1.6 (2) C16—C15—S2—O1 150.12 (15)
C4—C5—C8—C7 179.3 (2) C20—C15—S2—O2 −162.97 (15)
C6—C5—C8—C7 0.0 (2) C16—C15—S2—O2 18.06 (18)
C4—C5—C8—C12 0.2 (4) C20—C15—S2—N1 83.12 (16)
C6—C5—C8—C12 −179.1 (2) C16—C15—S2—N1 −95.86 (16)
C8—C7—C9—C10 −0.4 (3) C1—C6—N1—C7 179.9 (2)
N1—C7—C9—C10 −178.23 (19) C5—C6—N1—C7 −2.7 (2)
C7—C9—C10—C11 0.9 (3) C1—C6—N1—S2 20.2 (3)
C9—C10—C11—C12 −0.5 (3) C5—C6—N1—S2 −162.32 (14)
C9—C10—C11—C14 178.4 (2) C8—C7—N1—C6 2.7 (2)
C10—C11—C12—C8 −0.6 (3) C9—C7—N1—C6 −179.27 (19)
C14—C11—C12—C8 −179.65 (18) C8—C7—N1—S2 162.11 (14)
C10—C11—C12—S1 179.00 (16) C9—C7—N1—S2 −19.8 (3)
C14—C11—C12—S1 −0.1 (2) O1—S2—N1—C6 −166.71 (15)
C7—C8—C12—C11 1.1 (3) O2—S2—N1—C6 −36.89 (18)
C5—C8—C12—C11 −179.87 (19) C15—S2—N1—C6 78.21 (17)
C7—C8—C12—S1 −178.41 (14) O1—S2—N1—C7 37.08 (18)
C5—C8—C12—S1 0.6 (3) O2—S2—N1—C7 166.91 (15)
S1—C13—C14—C11 0.0 (3) C15—S2—N1—C7 −78.00 (17)
Hydrogen-bond geometry (Å, º)
Cg5 is the centroid of the C15–C20 ring.
D—H···A D—H H···A D···A D—H···A
C1—H1···O2 0.93 2.34 2.935 (3) 121
C1—H1···O2i 0.93 2.62 3.443 (3) 148
C9—H9···O1 0.93 2.35 2.949 (3) 122
C9—H9···O1ii 0.93 2.57 3.382 (2) 146
C13—H13···Cg5iii 0.93 2.82 3.604 (2) 143