Abstract— In this paper, we proposed an efficient data compression strategy exploiting the multi-resolution characteristic of the wavelet transform for wireless sensor network scenarios. We have developed a router node called “Smart Sensor Node; SSN”. The main goals of the SSN design are smart, optimum signal compression algorithm, minimal power consumption, modular design and robust circuitry. The SSN is made up of four basic components which are a sensing unit, a processing unit, a transceiver unit and a power unit. We have developed an optimization technique using the back-propagation neural network to search for an optimal compression ratio to improve the quality of the signal and to improve the energy efficiency of the SSN. Furthermore, we analyze the performance of the proposed method in terms of signal to noise ratio, root mean square error, percentage root mean square difference and compression ratio. The experimental results show that the proposed data compression technique yields recovered signal with good quality and has low complexity with less memory requirements in implementation.
Index Terms— Wireless sensor networks, Signal compression, Wavelet transform, Back-propagation neural networks.
I. INTRODUCTION
Wireless sensor network (WSN) has become one of the most interesting networking technologies since it can be deployed without communication infrastructures. The development of such networks was originally motivated by military applications such as battlefield surveillance. Recently, a lot of research related WSN has been conducted and people have been realizing theirs unlimited applicability. For example, WSN can be used for data collection purposes in situations such as environment and habitat monitoring, healthcare applications, home automation, structural monitoring, and greenhouse monitoring. However, WSN face many challenges, mainly caused by communication failures, limited storage capability and computational constraints and limited power supply. Consequently, energy consumption and data transmission are always considered together in WSN. Therefore, approaches to optimize data transmission are a critical issue.
Manuscript received March 9, 2015. This work was supported by Suranaree University of Technology, Nakhon Ratchasima, THAILAND.
P. Kumsawat is with the School of Telecommunication Engineering, Institute of Engineering, Suranaree University of Technology, Nakhon Ratchasima, 30000, THAILAND (e-mail: [email protected]).
K. Attakitmongcol is with the School of Electrical Engineering, Institute of Engineering, Suranaree University of Technology, Nakhon Ratchasima, 30000, THAILAND (e-mail: [email protected]).
A. Srikaew is with the School of Electrical Engineering, Institute of Engineering, Suranaree University of Technology, Nakhon Ratchasima, 30000, THAILAND (e-mail: [email protected]).
Data compression is a process that reduces the amount of data in order to reduce data transmitted and/or decreases transfer time. Due to the limited processing and storage resources of the wireless sensor nodes, data compression in sensor nodes requires the simple and lightweight algorithms. In recent years, people have done a lot of research work on data compression algorithm and proposed many compression algorithms for WSN [1], [2].
In [3], Kulakov and Davcev proposed data acquisition through hierarchical two-level architecture with algorithms using wavelets for initial data-processing of the sensory inputs and neural networks using unsupervised learning for categorization of the sensory inputs. This architecture provides a big dimensionality reduction and in the same time additional communication saving, since only classification IDs are passed to the cluster head instead of all input samples.
In [4], Goh et al. proposed the compression of neuronal recordings in real-time using a novel discriminating Linde-Buzo-Gray algorithm (DLBG) that preserves spike shapes while filtering background noise. The technique is implemented in a low power digital signal processor (DSP) which is capable of wirelessly transmitting raw neuronal recordings. Depending on the signal to noise ratio of the recording, the compression ratio can be tailored to the data to maximally preserve power and bandwidth.
In [5], Nasri et al. proposed a signal compression approach in WSN consisting of technique to skip computation of certain high-pass coefficients of the discrete wavelet transform (DWT) called SHPS (Skipped High- Pass Sub-band). The simulation results show that the proposed scheme optimizes network lifetime, reduces significantly the amount of required memory and computation energy.
In [6], Chichi et al. proposed new data compression algorithm inspired from Run Length Encoding called K-RLE. The authors also evaluate and compare compression algorithms on an ultra-low power microcontroller from Texas Instrument within the MSP430 series used for designing wireless sensor networks.
Recently, the wavelet-based approach has attracted much attention from researchers due to simplicity and high compression performance. In [7], Nasri et al. proposed an alternative image transmission approach in WSNs, based on JPEG2000 image compression standard. This approach is based on discrete wavelet transform (DWT) and embedded block coding with optimized truncation (EBCOT) which uses a better order of transmission. Performance of the proposed image compression scheme is investigated with respect to image quality and energy consumption.
In [8], Manhas et al. proposed an efficient image transmission strategy exploiting the multi-resolution characteristic of DWT. The authors use selective decodes-and- forward (SDF) cooperation. The experimental
A New Optimum Signal Compression Algorithm
Based on Neural Networks for WSN
results show that the overall energy consumption can be considerably reduced, with a negligible decrease on the average image quality.
In [9], Siao et al. proposed a novel approach for electrocardiogram data compression in a healthcare monitoring system, which helps to reduce power consumption during wireless communication.
In [10], Luo et al. proposed a dynamic compression scheme to deal with the challenge of ultralow power and real-time wireless ECG application. It simply consists of a digital integrate-and-fire sampler and a lossless entropy encoder, which can reduce airtime over energy-hungry wireless links and improve the energy efficiency of the biosensors.
This paper presents a novel approach for wireless signal compression in a wireless sensor monitoring system. In this work, a wireless sensor network has been implemented. It can monitor the air temperature, relative humidity, light intensity and
soil moisture in a cassava field. Furthermore, we have
developed an optimum signal compression scheme using Haar wavelet transform and the artificial neural network. The software coding of the implementation was done using Simulink model and MATLAB. Experimental tests demonstrate that the proposed coder is efficient and has low complexity with less memory requirements in implementation.
II. PRELIMINARIES A. Back-Propagation Neural Networks
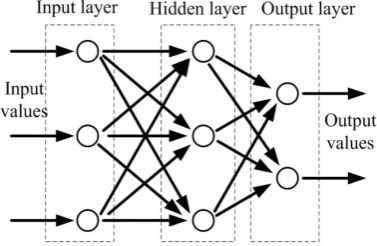
The back-propagation neural network (BPNN) is one type of supervised learning neural networks. It is a potential tool in many signal processing applications. The principle behind BPNN involves using the steepest gradient descent method to reach small approximation. A typical BPNN architecture usually consists of 3 layers which are an input layer, a hidden layer and an output layer. Each layer has one or more neurons and each neuron is fully connected to its adjacent layers. Two neurons of each adjacent layer are directly connected to each other. This connection is called a link. Each link has a weighting value to represent relational degree between two nodes. The illustration of BPNN architecture is shown in Fig. 1. These weighting values are determined by the training algorithm described by the following equations:
ij i j
j t o t
net () , () (1) ))
( ( ) 1
(t f net t
oi act j (2)
, where netj(t) is the activation of the neuron j in the iterationt , oi(t1) is the output of the neuron j in the iterationt1and factis the activation function of the neuron.
In general, the initial weight values i,jare assigned using
random values. In each iteration process, all i,jare modified
using the delta rule according the learning sample. Generally, when neural network is trained with inputs, the error on the training data set decreases gradually with the epochs or goal set. The BPNN stops training when the goal is achieved or the
algorithm reaches the maximum number of epoch specified, whichever condition is met first. After training, neural network can memorize the characteristics of the learning samples, and predict a new output due to its adaptive capability.
Fig. 1.Typical back-propagation neural network architecture
III. PROPOSED METHOD
In this section, we first give a brief overview of the WSN embedded system architecture and wavelet-based signal compression algorithm. We then describe the architecture of the neural networks.
[image:2.595.333.522.122.245.2]A. WSN Embedded System Architecture
Figure 2 shows diagram of a wireless mesh networking of the SSN. Mesh is one of many network topologies and forms inherently the most reliable and scalable network. Each node has routing capabilities and not only passes on packets but also decides which is the best path and ignores any broken nodes.
Figure 3 shows the implementation results of a wireless mesh network. The main controller of the SSN is the FiO Std
evaluation board. The microcontroller unit (MCU) of the SSN
Mesh Network
Router -FiO Std -Xbee -Photocell -Moisture Sensor
-SHT11
Coordinator -Waijung -Sim300CZ
-Xbee
Router -FiO Std
-Xbee -Photocell -Moisture Sensor
-SHT11 Router
-FiO Std -Xbee -Photocell -Moisture Sensor
-SHT11
Router -FiO Std
-Xbee -Photocell -Moisture Sensor
-SHT11
Fig. 2. Diagram of a wireless mesh network
Router Node 1
Coordinator
Waijung+GPRS Router Node 3
[image:3.595.75.264.49.208.2]Router Node 2 Router Node 4
Fig. 3. Implementation of a Smart Sensor Node
B. Wavelet-Based Signal Compression Algorithm
Signal compression is a process that reduces the amount of data in order to reduce data transmitted. Numerous of signal compression techniques have been developed in the past few years, and the wavelet transform techniques have already achieved great success in the signal compression field. The wavelet transform is a time-scale analysis. The signal is analyzed at multiple frequency ranges with different resolutions by decomposing the signal into a coarse approximation and detail information.
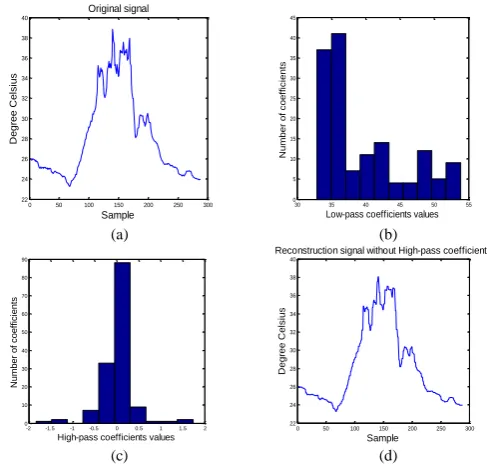
Figure 4 illustrates the distribution of low-pass coefficients (approximation coefficients) and high-pass coefficients (detail coefficients) after applying 1-level Haar wavelet transform to the temperature data sets. The low-pass coefficients represent approximation of the original signal whereas the high-pass coefficients represent detail information of the original signal. We notice that the high-pass coefficients are generally small. Based on the numerical distribution, we can estimate the high-pass coefficients to be zeros and hence avoid computing them. The reconstruction signal without using the high-pass coefficients is shown in Fig. 4(d). In order to save computation energy, we propose a wavelet-based signal compression approach in WSN which does not require computation of certain high-pass coefficients of the DWT. This technique is called ―Skipped High Pass Sub-bands; SHPS‖. Following the same process given in [5], we use Mallat’s pyramid algorithm to implement the DWT. The resulting wavelet coefficients are then encoded using the SHPS technique.
0 50 100 150 200 250 300
22 24 26 28 30 32 34 36 38 40
Original signal
Sample
D
e
g
re
e
C
e
lsi
u
s
30 35 40 45 50 55
0 5 10 15 20 25 30 35 40 45
Low-pass coefficients values
N
u
m
b
e
r
o
f
co
e
ff
ici
e
n
ts
(a) (b)
-2 -1.5 -1 -0.5 0 0.5 1 1.5 2
0 10 20 30 40 50 60 70 80 90
High-pass coefficients values
N
u
m
b
e
r
o
f
co
e
ff
ici
e
n
ts
0 50 100 150 200 250 300
22 24 26 28 30 32 34 36 38 40
Reconstruction signal without High-pass coefficients
Sample
D
e
g
re
e
C
e
lsi
u
s
(c) (d)
Fig. 4. (a) Original signal (b) numerical distribution of low-pass coefficients (c) numerical distribution of high-pass coefficients and (d) reconstructed signal without using high-pass coefficients
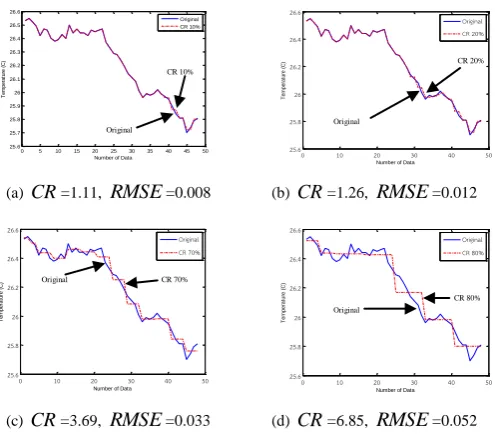
In this work, the signal is 48 data points in length. A Haar wavelet is used to decompose the signal into three levels. The amount of compression ratio can be varied by throw away the fineness or coarseness of the DWT coefficient. For this research, the compression ratio was varied from 10% to 90%. A diagram of the modified SHPS compression technique is shown in Fig.5. Figure 6(a), Fig. 6(b), Fig. 6(c) and Fig. 6(d) give the comparison of the original and the reconstructed temperature data set after applying the proposed compression approach by setting compression ratio as 10, 20, 70 and 80, respectively. Based on the proposed technique, we have designed and implemented a smart sensor node for data collections in farmland environment. The computational blocks in these realizations are implemented in the Simulink model and real-time workshop embedded coder as shown in Fig. 7.
48 data
24 data 24 data
12 data 12 data
6 data 6 data
50% 1 Level
2 Level
3 Level 60%
70%
80%
90% 40%
30%
20%
10%
CD1 CA1
CA2 CD2
CD3 CA3
High-pass subband
[image:3.595.309.553.50.282.2]Low-pass subband
[image:3.595.310.540.555.756.2]0 5 10 15 20 25 30 35 40 45 50 25.6
25.7 25.8 25.9 26 26.1 26.2 26.3 26.4 26.5 26.6
Number of Data
Te
m
p
e
ra
tu
re
(
C
)
Original CR 10%
0 10 20 30 40 50
25.6 25.8 26 26.2 26.4 26.6
Number of Data
Te
m
p
e
ra
tu
re
(
C
)
Original CR 20%
(a) CR=1.11, RMSE=0.008 (b) CR=1.26, RMSE=0.012
0 10 20 30 40 50
25.6 25.8 26 26.2 26.4 26.6
Number of Data
Te
m
p
e
ra
tu
re
(
C
)
Original CR 70%
0 10 20 30 40 50
25.6 25.8 26 26.2 26.4 26.6
Number of Data
Te
m
p
e
ra
tu
re
(
C
)
Original CR 80%
(c) CR=3.69, RMSE=0.033 (d) CR=6.85, RMSE=0.052
[image:4.595.44.292.51.269.2]Fig. 6. Comparison of the original and the reconstructed of temperature signal for different compression ratios
Fig. 7. Simulink model and real-time workshop embedded coder
To demonstrate the effectiveness of our proposed method, a series of experiments have been conducted. The signal to noise ratio (SNR), root mean square error (RMSE), compression ratio ( CR ) and percentage root mean square difference (PRD) are used as performance measures to quantify the difference between the original signal and the processed signal [11]. The compression performance of the proposed algorithm is evaluated in terms of the CR, which is defined as the ratio of the amount of uncompressed data size to the amount of compressed data size. TheCRis defined as
size n Compressio
size ion Uncompress
CR . (3)
In WSN signal compression, quality of the reconstructed signal is an important issue. In this paper, thePRDis usually used for quality criterion. The PRD is defined as:
%, 100 ]
[ ]) [ ˆ ] [ (
1 2 1
2
N n N n
n x
n x n x
PRD (4)
where x[n]and xˆ[n] denote the original and reconstructed data, respectively, andN is the number of samples within one data segment.
C. Architecture of the Neural Network
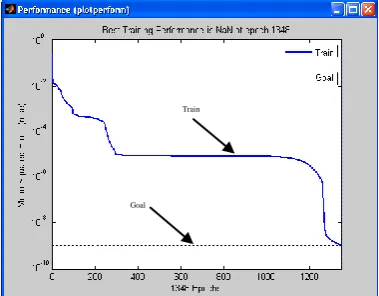
The efficient signal compression considerably reduces the amount of data to be transmitted, which in turn reduces the power consumption but at the expense of higher distortion of recovery signal. So, there is always a trade-off between the power consumption and distortion. In this work, the optimum signal compression system uses a supervised neural network based on the back-propagation learning algorithm, due to its implementation simplicity. In the training process, the SHPS compression technique has been applied to 100 data sets using 9 compression ratios (10%, 20%, 30%,…90%) as shown in an example in Fig. 6. The optimum SHPS compression ratios for the 70 signals were determined using the optimum compression criteria based on visual inspection of the compressed signals, thus providing 70 signals with known optimum compression ratios and the remaining 30 signals with unknown optimum compression ratios. The BPNN could be trained to establish the non-linear relationship between the wavelet transform coefficient of a signal and its compression ratios in search for an optimum ratio. Therefore, the neural network implementation in this paper is feed-forward multilayer neural network. There are four layers including an input layer, two hidden layers and an output layer. All data sets were presented to the neural networks using the one sample-per-node approach, includingRMSE, SNR andCR of each data sets. The desired outputs of neural network are the optimum compression ratio. The ratios vary according to the variations in DWT coefficient values within the signal. The transfer functions of neurons in hidden layers are log-sigmoid function. The transfer function of neurons in output layer is linear transfer function. The architecture of the neural network is shown in Fig. 8. Figure 9 shows the mean square error in each step when the BPNN is trained using the temperature data sets.
1
48 2
49
1
2
10 RMSE
Input Layer
Hidden
Layer OutputLayer Data 1
1
5
SNR
CR 50
51
Optimum Compression Ratio (10%-90%) 1
1
5 Data 2
Data 48
Fig. 8. The architecture of the neural network proposed CR 10%
Original
Original CR 70%
Original
CR 20%
Original
[image:4.595.52.295.320.481.2] [image:4.595.288.549.535.722.2]Fig. 9. Training curve of back-propagation neural networks
IV.EXPERIMENTALRESULTSANDDISCUSSIONS In this experiment, we demonstrate the efficiency of this scheme under real-world applications with limited number of data samples. The four SSNs were deployed in a cassava farmland environment at Suranaree University of Technology (SUT), all within single-hop range of the receiver device, as shown in Fig.10. The compression and transmission is done automatically at the SSN base station. After compressing, the compressed data is transmitted to the web server.
[image:5.595.304.557.53.293.2]The comparison of the original signal and the recovered signal of the temperature, relative humidity, soil moisture and light intensity are shown in Fig. 11(a), Fig.11(b), Fig.11(c) and Fig. 11(d), respectively. It is obviously shown that the compressed data can be reconstructed effectively. Although some of the reconstructed data has some difference from the original data, there is almost no influence on the data series and the total trends of data series are well illustrated. The resulting relationships of the signal distortion and compression efficiency are shown in Table I. The averageSNR,RMSE,PRD, andCR resulting from our approach are 59.72, 1.10, 5.37%, and 3.49, respectively. It is observed that thePRDof all data sets are less than 9%. Therefore, the proposed method can achieve high-quality signal recovery.
Fig. 10. Router node in cassava field
0 0.5 1 1.5 2 2.5
x 104
25 30 35 40
Number of Data
Te
mp
era
tur
e(C
)
Original Decompress
0 0.5 1 1.5 2 2.5
x 104
30 40 50 60 70 80
Number of Data
Hu
mid
ity
(%
)
Original Decompress
(a) (b)
0 0.5 1 1.5 2 2.5 x 10⁴
5 10 15 20 25 30 35
Number of Data
So
il
M
ois
tu
re
(%
)
Original Decompress
0 0.5 1 1.5 2 2.5 x 10⁴
2 2.5 3 3.5 4
Number of Data
Lig
ht(
V)
Original Decompress
(c) (d)
Fig. 11. Comparison between the original and the reconstructed signal of (a) Temperature, (b) Humidity, (c) Soil moisture, and (d) Light intensity.
TABLE I
QUALITY AND COMPRESSION EFFICIENCY OF THE PROPOSED SCHEME
Metric
Sensors SNR RMSE
PRD CR
Temperature 61.235 0.444 0.014 3.428
Humidity 55.547 1.702 0.029 3.427
Light 78.850 0.102 0.034 3.692
Soil moisture 43.250 2.180 0.138 3.428
We experimentally measured the SSN’s power consumption in the digital domain. In our work, we assume a simple model [12] where the radio dissipates 50 nJ/bit to run the transmitter or receiver circuitry and 100 pJ/bit/m2 for the transmit amplifier. The comparison of the size of data collected in different sampling interval, and the energy consumption during transmission are reported in Table II. The average energy dissipated by every node is provided in Fig.8. As Figure 8 shows, data compression reduces the number of bytes to transmit and, hence, the transmission energies of each SSN. It saves energy around 50%. Therefore, the algorithm proposed in this paper can be applied to compress the collected data and reduce the data transmission as well as the energy consumption of the SSN. Thus, the lifetime of SSN can be extended.
V.CONCLUSIONS
In this paper, an adaptive signal compression technique that aims at achieving low-complexity and energy efficient compression is proposed. In designing this compression technique, we have modified SHPS technique which conserves energy by skipping the computation of high-pass wavelet transform coefficients. Furthermore, we have developed an optimization technique using the back-propagation neural network to search for an optimal compression ratio to improve the quality of the signal and to
Decompress
Original
Original
Decompress
Original
Decompress
Original
Decompress
Train
Goal
T
em
pe
ra
ture
(
oC)
Number of Data Number of Data
H
um
idi
ty(%)
Number of Data Number of Data
L
ight
(V
)
S
oi
l
M
oi
st
ure
[image:5.595.81.263.534.772.2]improve the energy efficiency of the smart sensor node. We analyze the performance of the proposed scheme in terms of signal to noise ratio, root mean square error, percentage root mean square difference and compression ratio. The experimental results indicate that the proposed scheme is efficient and has low complexity with less memory requirements in implementation.
TABLE II
COMPARISON OF THE SIZE OF DATA AND THE ENERGY CONSUMPTION
Sampling Interval (minutes)
Original Data Compressed Data
Raw Data (bytes)
Energy Consumption
(mJ)
Sent Data (bytes)
Energy Consumption
(mJ)
1 51,840 434.72 25,920 217.728
5 10,368 87.087 5,184 43.545
10 5,184 43.543 2,592 21.772
15 3,456 29.028 1,728 14.515
20 2,592 21.772 1,296 10.884
The
0 5 10 15 20
0 50 100 150 200 250 300 350 400 450
Sampling Interval (Minutes)
E
n
e
rg
y
C
o
n
su
m
p
ti
o
n
(
m
J)
Original Data Compressed Data
Fig. 12. Computational energy dissipated by every node
REFERENCES
[1] N. Kimura and S. Latifi, ―A Survey on Data Compression in Wireless Sensor Networks," In Proc. the Information Technology: Coding and Computing, Vol. 2, pp: 8 – 13, 2005.
[2] R. V. Kulkarni and G. K. Venayagamoorthy,―Computational Intelligence in Wireless Sensor Networks: A Survey,‖ IEEE Communications Surveys & Tutorials, Vol. 13, No. 1, pp. 68-96, 2011. [3] A. Kulakov and D. Davcev, ―Intelligent Data Acquisition and Processing Using Wavelet Neural Networks,‖ In Proc. IEEE Workshop on Intelligent Data Acquisition and Advanced Computing Systems: Technology and Applications, Vol. 1, pp. 491-494, 2005.
[4] A. Goh, S. Craciun, S. Rao, D. Cheney, K. Gugel, J. C. Sanchez, J. C. Principe, ―Wireless Transmission of Neuronal Recordings Using a Portable Real-Time Discrimination/Compression Algorithm," In Proc. the 30th Annual International Conference on Engineering in Medicine and Biology Society, pp:4439 – 4442, 2008.
[5] M. Nasri, A. Helali, H. Sghaier, and H. Maaref, ―Energy-Efficient Wavelet Image Compression in Wireless Sensor Network," In Proc. the Communication in Wireless Environments and Ubiquitous Systems: New Challenges, Vol.1, pp. 1 – 7, 2010.
[6] E. Chichi, H. Guyennet and J. Friedt, ―K-RLE : A New Data Compression Algorithm for Wireless Sensor Network,‖ In Proc. the 2009 Third International Conference on Sensor Technologies and Applications, Vol. 1, pp. 502-507, 2009.
[7] M. Nasri, A. Helali, H. Sghaier and H. Maaref, ―Adaptive image transfer for wireless sensor networks (WSNs)‖ In Proc. 2010 International Conference on Design & Technology of Integrated Systems in Nanoscale Era, Vol. 1, pp:1 – 6, 2010.
[8] E. Manhas, G. Brante, R. Souza and M. Pellenz, ―Energy-Efficient Cooperative Image Transmission Over Wireless Sensor Networks,‖ In Proc. the 2012 IEEE Wireless Communications and Networking Conference : Mobile and Wireless Networks, Vol. 2, pp. 2014-2019, 2012.
[9] S. R. Siao; C. C. Hsu ; M.P.H. Lin, S. Y. Lee, ―A novel approach for ECG data compression in healthcare monitoring system,‖ In Proc. The 2014 IEEE International Symposium on Bioelectronics and Bioinformatics (ISBB), Vol. 1, pp. 1-4, 11-14 April 2014.
[10] K. Luo, J. Li, J. Wu, ―A Dynamic Compression Scheme for Energy-Efficient Real-Time Wireless Electrocardiogram Biosensors,‖ IEEE Journals & Magazines, Vol. 63(9), pp. 2160 – 2169, Sept. 2014. [11] B. Arvinti, C. Nafornita, I. Alexandru and M. Costache ―ECG Signal
Compression Using Wavelets. Preliminary Results,‖ In. Proc. 2011 10th International Symposium on Signals, Circuits and Systems, Vol. 1, pp. 1-4, 2011.