Development and Validation of an Objective Risk Scoring
System for Assessing the Likelihood of Virus Introduction
in Porcine Reproductive and Respiratory Syndrome
Virus-Free Sow Farms in the US
Derald J. Holtkamp1*, Hui Lin2, Chong Wang1,2, Dale D. Polson3
1
Department of Veterinary Diagnostic and Production Animal Medicine, College of Veterinary Medicine, Iowa State University, Ames, USA
2
Department of Statistics, College of Arts and Sciences, Iowa State University, Ames, USA
3
Boehringer Ingelheim Vetmedica Inc., St. Joseph, USA Email: *[email protected]
Received March 9, 2013; revised April 9, 2013; accepted May 9, 2013
Copyright © 2013 Derald J. Holtkamp et al. This is an open access article distributed under the Creative Commons Attribution Li-cense, which permits unrestricted use, distribution, and reproduction in any medium, provided the original work is properly cited.
ABSTRACT
The lack of validated tools to predict how long sow farms will remain PRRS virus-free following successful elimination of the virus has deterred veterinarians and producers from attempting to eliminate the PRRS virus from sow farms. The aim of this study was to use the database of PRRS Risk Assessments for the Breeding Herd in PADRAP to develop and validate an objective risk scoring system for predicting the likelihood of virus introduction in PRRS virus-free sow farms in the US. To overcome the challenges of dealing with a large number of variables, group lasso for logistic re-gression (GLLR) was applied to a retrospective dataset of PRRS Risk Assessment for the Breeding Herd surveys com-pleted for 704 farms to develop the risk scoring system. The validity of the GLLR risk scoring system was then evalu-ated by testing its predictive ability on a dataset from a long-term prospective study of 196 sow farms to assess risk factors associated with how long PRRS virus-free sow farms remained PRRS virus-free. Receiver operator characteris-tic(ROC) curves were estimated to compare the performance of the GLLR risk scoring system to the risk scoring sys-tem based on expert opinion (EO), currently used in the PRRS Risk Assessment for the Breeding Herd, for predicting whether herds remained PRRS virus-free for 130 weeks. The GLLR risk scoring system (AUC, 0.76; 95% CI, 0.67 - 0.84) performed significantly better than the EO risk scoring system (AUC, 0.36; 95% CI, 0.27 - 0.46) for predicting whether to sow farms in the prospective study survived for 130 weeks (p < 0.001). Dividing farms into 3 risk groups (low, medium and high) using a low and high cutoff values for the GLLR risk score was informative as the differences in the KM survival curves for the 3 groups were both clinically meaningful and statistically significant. The GLLR risk scoring system used in conjunction with the PRRS Risk Assessment for the Breeding Herd survey delivered through PADRAP appears to have the potential to help veterinarians predict the likelihood of virus introduction in PRRS vi-rus-free sow farms in the US.
Keywords: Porcine Reproductive and Respiratory Syndrome (PRRS); Group Lasso; Logistic Regression; Risk Scoring System; Area under the ROC Curve
1. Introduction
Porcine reproductive and respiratory syndrome (PRRS), caused by the highly infectious PRRS virus, is a costly and frustrating challenge to the global swine industry. Productivity losses in the United States swine industry are estimated to be $664 million annually [1]. In 2006, the
169
herd rollovers involve eliminating the virus without com-pletely depopulating and repopulating the site with PRRS virus-free breeding replacements. Herd rollovers are gen-erally less expensive to execute compared to complete depopulation and repopulation. However, keeping farms free of the PRRS virus long enough to recover the costs of eliminating it has proven to be challenging. Further-more, clinical PRRS outbreaks caused by re-introduction of the virus into farms where the virus has been elimi-nated are often more severe due to the lack of immunity in subpopulations or the entire sow farm [1].
The decision to eliminate the virus from a sow farm depends on three factors: 1) the probability of success in eliminating the virus; 2) how much it will cost to elimi-nate the virus and 3) how long the sow farm is expected to stay PRRS virus-free. If done correctly, the probability of success for both complete depopulation and repopula-tion with PRRS virus-free breeding replacements and herd rollovers is highly and reasonably predictable. The cost of eliminating the virus is predictable but will vary according to the method used as well as such things as availability of space for breeding replacements and other factors. How long the sow farm is expected to stay PRRS virus-free, however, is highly variable and unpredictable. An approach that enabled producers and veterinarians to systematically evaluate and predict the risk of virus in-troduction in PRRS virus-free sow farms would remove some of the unpredictability and would be helpful for evaluating whether to attempt PRRS virus elimination.
In human medicine a plethora of scoring systems have been developed and used to systematically evaluate and predict outcomes and there are a few in veterinary medi-cine as well. For example, Rockar et al. developed an animal trauma triage scoring system for comprehensively assessing the veterinary trauma patient [8]. However, development of scoring systems in veterinary medicine at the animal or herd level has been inhibited by the lack of sufficient data on risk factors, and clinical outcomes needed to develop them.
The American Association of Swine Veterinarians (AASV) Production Animal Disease Risk Assessment Program (PADRAP) was developed to help the swine industry better understand, measure and benchmark bio-security and disease risks faced by swine producers [9]. Risk assessment surveys including the PRRS Risk As-sessment for the Breeding Herd are delivered through PADRAP. The PRRS Risk Assessment for the Breeding Herd includes a large number of questions regarding risk factors for clinical PRRS outbreaks for individual sow farms including those caused by the introduction of the PRRS virus in farms previously free of the virus. AASV members use the PRRS Risk Assessment for the Breed-ing Herd to help producers quantify and systematically assess risks that may be associated with PRRS outbreaks.
Risks are quantified using a risk scoring system based on expert opinion (EO). Approximately one hour is required to complete the survey. As assessments are performed the completed surveys are added to the dataset main-tained at the Iowa State University College of Veterinary Medicine. The ability of the current EO risk scoring sys-tem, used to quantify risk in the PRRS Risk Assessment for the Breeding Herd, to predict the likelihood of PRRS virus introduction has not been assessed.
The aim of this study was to use the database of PRRS Risk Assessments for the Breeding Herd in PADRAP to develop and validate an objective risk scoring system for predicting the likelihood of virus introduction in PRRS virus-free sow farms in the US. To overcome the chal-lenges of dealing with a large number of variables in the model, group lasso for logistic regression (GLLR) [10] was applied to the retrospective dataset of PRRS Risk Assessment for the Breeding Herd surveys for 704 farms to develop the risk scoring system. The validity of the GLLR risk scoring system was then evaluated by testing its predictive ability on a prospective dataset. The valida-tion was performed with data from a long-term prospec-tive study of 196 sow farms to assess risk factors associ-ated with how long PRRS virus-free sow farms remained PRRS virus-free.
2. Methods
2.1. Data Used to Develop the Risk Scoring Systems
Version 2 of the PRRS Risk Assessment for the Breeding Herd was developed using a group consensus approach with the aid of the PRRS Risk Assessment Working Group composed of 21 veterinarians and researchers with expertise in PRRS. Questions about risk factors for the occurrence of clinical PRRS outbreaks and possible re-sponses were identified by the group. A Delphi survey approach was used with this group to establish impor-tance levels for the questions and risk scores for each response. These importance levels and risk scores esti-mated on the basis of a consensus of expert opinion were considered an initial estimate.
expert opinion.
Importance levels for each question from the Delphi survey were used to narrow the list of questions to be included in the final survey. From the initial list of 260 survey questions, 155 questions were selected to be in-cluded in the final survey. Of the 155 questions in ver-sion 2 of the PRRS Risk Assessment for the Breeding Herd 31 capture information about internal risk factors and 124 questions about external risk factors. The section of the survey about internal risk factors includes ques-tions about bio-management factors that are important when the virus is already present in the farm. It also in-cludes questions about the PRRS outbreak history of the farm; the PRRS status of the herd; and other factors, such as vaccine use, that are highly correlated with the PRRS status of the herd. External risk factors include those factors that are important for excluding the virus from a farm that is free of the virus or new strains of the virus from a farm where the virus is already present. The in-ternal and exin-ternal categories of risk factors were further subcategorized.
The data used to develop and validate the GLLR risk scoring system includes surveys in the database com-pleted between March 2005 and March 2009. The unit of concern was the sow farm and therefore, the most recent complete survey for 896 sow farms in the United States or Canada were included in the database used to develop and validate the GLLR risk scoring system. Of those, 196 were completed for a long-term prospective study to as-sess risk factors associated with how long PRRS virus- free sow farms remained PRRS virus-free. These were excluded from the retrospective dataset and subsequently used to validate the risk scoring system. Therefore, sur-veys for 704 sow farms were used to develop the GLLR risk scoring system.
The outcome variable used to develop the GLLR risk scoring system was whether the sow farm had one or more PRRS outbreaks in the three years prior to when the survey was completed. In the survey, a clinical PRRS outbreak was defined as an increase in one or more re-productive performance measures that exceeds normal variation with diagnostic confirmation of PRRS virus in-volvement. Three questions from the survey used to de-termine the outcome variable, and a related question that asks for the number of PRRS clinical outbreaks in the previous three to five years, were excluded from the list of explanatory variables. Twenty-four other questions were also excluded because the response for each would generally be caused by a clinical PRRS outbreak and therefore inappropriate as an explanatory variable. Ex-cluded were questions about the PRRS virus status and other factors, such as vaccine use, which is highly corre-lated with the PRRS status of the animals in the herd or incoming breeding replacements. The remaining 127
survey questions, 8 in the internal and 119 in the external risk factor sections of the survey, were used to develop the risk scoring system. Both categorical and continuous responses were included in the survey. All survey ques-tions originally captured as continuous responses were transformed to categorical responses using cutoff values identified by the PRRS Risk Assessment Working Group for the purpose of assigning risk scores.
2.2. Methods for Development of Risk Scoring System
A standard approach to construct a scoring system is multivariate logistic regression. The variable selection is frequently based on variable significance and the coeffi-cient estimates from the logistic regression models can be used as scores assigned to selected variables [11]. “Quasi-complete-separation”, however, can occur when the number of variables is large, as it was for this analy-sis, which leads to unstable coefficient estimates [12]. Meier et al. proposed a GLLR method suitable for high- dimensional multivariate logistic regression problems which estimates coefficients accurately [10]. GLLR is also considered a variable selection method because co-efficients estimated to be 0 do not contribute to the model.
GLLR was applied for this analysis as previously de-scribed by Lin et al. [13]. The possible responses for each survey question were first converted to dummy in-dicator variables. All possible responses for the same question were considered to be in the same group. After excluding the baseline variable from each group, there were 339 dummy variables from the 127 questions (groups). The variable selected as the baseline for each group was the one with the lowest risk score according to the cur-rent risk scoring system based on expert opinion. R package “grplasso” was used to perform the GLLR [14]. We applied leave-one-out cross validation to choose the tuning parameter that maximizes area under the receiver operator characteristic (ROC) curve in the GLLR algo-rithm, using the multiplicative grid method proposed by Meier et al. [10]. The estimated values of coefficients from the GLLR model were used as the risk scores for corresponding responses. The overall GLLR risk score of a farm is the sum of scores from all questions included in the GLLR model. All calculations were programmed in R [15].
2.3. Validation of the Risk Scoring System
171
for the duration of the study. Survival was defined as remaining PRRS virus-free and ended when a sow farm was confirmed by the collaborating veterinarian to be PRRS virus-infected. Confirmation of infection was de-termined and recorded when diagnostics were completed to confirm the sow farm was no longer free of the PRRS virus. For the sow farms identified as infected, the sur-vival time was calculated as the number of weeks be-tween the date the sow farm was enrolled and the con-firmation of positive date. Sow farms that were removed before the end of the analysis period (March 17, 2011) were treated as censored. All sow farms in the study had been enrolled for at least 130 weeks at the end of the analysis period. The dichotomous outcome variable was the survival status at 130 weeks post enrollment.
Version 2 of the PRRS Risk Assessment for the Breed-ing Herd was used to collect information on the risk fac-tors. The risk assessments used for the purpose of vali-dating the GLLR risk scoring system were completed at the time the farms were enrolled in the study. The GLLR risk scoring system was applied to the completed risk assessments to determine an overall risk score for each sow farm. The overall GLLR risk score of a farm was calculated as the sum of all coefficient estimates corre-sponding to the survey responses provided for the farm for all questions included in the GLLR model. The over-all EO risk score was calculated as the sum of the risk scores based on expert opinion corresponding to the sur-vey responses for all questions included in the GLLR model. Calculations of the overall risk scores were per-formed in R [15]. Risk scores for only the questions in the internal and external sections of the survey were also calculated.
ROC curve analysis was used to compare the per-formance of the GLLR risk scoring system to the cur-rently used EO risk scoring system for predicting whether herds survived, that is remained PRRS virus-free for 130 weeks. The dichotomous outcome variable was the sur-vival status at 130 weeks post enrollment. The risk scor-ing system with the higher area under the curve (AUC) was regarded as superior.
Two cutoff values for the overall risk score to catego-rize the risk were selected and evaluated. One cutoff value with a high positive predictive value (PPV) and the other with a high negative predictive value (NPV) were selected to form three risk groups (low, medium and high). Kaplan-Meier survival curves and the log-rank test was applied to compare the difference in how long PRRS virus-free sow farms remained virus-free among the three groups. Sow farms remaining PRRS virus-free at the end of the analysis period were right censored. The survival package in R was used to perform the “survival” analysis [16].
3. Results
Among the 704 sow farms in the dataset of risk assess-ments used to develop the GLLR risk scoring system, 398 (56.8%) sow farms had outbreaks in the past 3 years. The farms were located throughout the US. One hundred and eighty-four (26.1%) farms were located in relatively pig dense Midwest states; 56 (8%) from Iowa; 39 (5.5%) from Minnesota; 33 (4.7%) from Illinois and 15 (2.1%) from Indiana. Forty-one (5.8%) farms were from the other Midwest states. There were 153 (21.7%) from North Carolina and the remaining 367 (52.1%) farms were from the other states in the US. Sow farms were categorized by size; 41 (5.8%) farms had fewer than 300 sows; 151 (21.4%) farms had 300 to 799 sows; 200 (28.4%) had 800 to 1999 sows; 175 (24.9%) had 2000 to 2999 sows and 137 (19.5%) had more than 2999 sows. There were 594 (84.4%) commercial farms and 110 (15.6%) genetic farms. Genetic farms were defined as those where the primary purpose was producing genetic replacements.
Of the 196 farms enrolled in the long-term prospective study of PRRS virus-free sow farms, 156 (79.6%) re-mained negative after 130 weeks. One-hundred eighty two (93%) survived for 1 year or longer. Seventy-nine (40.3%) farms were located in pig dense states in the Midwest; 12 (6%) from Iowa; 38 (19%) from Minnesota; 21 (11%) from Illinois and 8 (4%) from Indiana. Twenty- one (11%) farms were from the other Midwest states. There were 18 (9%) from North Carolina. The remaining 78 (40%) farms were from the other states in the US. Sow farms were categorized by size; 1 (0.5%) farm had fewer than 300 sows; 50 (25.5%) had 300 to 799 sows; 42 (21.4%) had 800 to 1999 sows; 61 (31.1%) had 2000 to 2999 sows and 42 (21.4%) had more than 2999 sows. There were 95 (48.5%) commercial farms and 101 (51.5%) genetic farms.
Eighty-two of the 127 questions in the PRRS Risk Assessment for the Breeding Herd survey in the GLLR model had non-zero variable coefficients and were there-fore included in the GLLR risk scoring system. Table 1 is a summary of the number of survey questions included in the GLLR risk scoring system by category of risk fac-tors in the PRRS Risk Assessment for the Breeding Herd. Five of the eight (62%) internal risk factor questions were included in the GLLR risk scoring system. All the subcategories of risk factors had at least one question included. Seventy-seven of the 119 (65%) external risk factor questions were included in the scoring system.
Table 1. Summary of number of questions in the risk scoring system determined by applying group lasso logistic regression (GLLR) to the database of PRRS Risk Assessment for the Breeding Herd surveys by category of risk factors.
Questions Dummy variables
Category of risk factors in the survey Number included Total Number included Total
Internal risks
Circulation risks
Characteristics of the herd 3 4 9 12
Characteristics of the site 1 2 2 5
Management practices 1 2 5 9
External risks
Pig related risks
Entry of replacement animals into the breeding herd 9 12 33 40
Entry of semen into the breeding herd 16 31 58 105
Non-pig related risks
Transportation of live animals 23 29 64 79
Transportation of feed 1 1 2 2
Employee and service vehicles 2 2 8 8
Disposal of dead animals and waste management 2 8 3 10
Employees and visitors 7 9 16 19
Entry of supplies 1 1 2 2
Facilities 2 4 5 9
Bio-vectors 1 1 2 2
Density of pig farms in the area 3 3 9 9
Neighboring pig farms 6 13 16 32
Distance to pork industry infrastructure 3 4 7 11
Topography and forestation of surrounding area 1 1 3 3
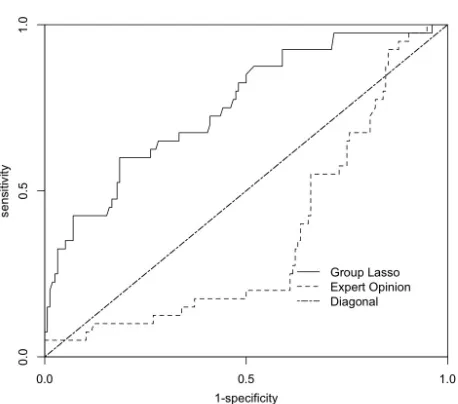
Figure 1. Receiver operator curves for the predicting whether a sow herd had one or more PRRS outbreaks in the previ-ous three years with the risk scoring systems derived from expert opinion (EO) and by applying group lasso logistic regression (GLLR) to the database of PRRS Risk Assess-ment for the Breeding Herd surveys.
risk scoring system (AUC, 0.76; 95% CI, 0.67 - 0.84) performed significantly better than the EO risk scoring
system (AUC, 0.36; 95% CI, 0.27 - 0.46) for predicting whether sow farms in the prospective study survived for 130 weeks (p < 0.001).
[image:5.595.59.288.427.629.2]173
Figure 2. Scatter plot of whether farms in the long-term prospective study of 196 PRRS virus-free sow farms in the US survived for 130 weeks by their standardized internal and external risk scores determined by applying group lasso logistic regression (GLLR) to the database of PRRS Risk assessment for the breeding herd surveys.
45 of the 47 (95.7%) farms with standardized internal and external risk scores below the median, those in the lower left quadrant, remained PRRS virus-free for 130 weeks. For farms in all other quadrants, only 38 of 111 (74.5%) remained PRRS virus-free for 130 weeks.
To further evaluate the validity, and potential use, of the GLLR risk scoring system, the farms were divided into three groups by selecting a low and high cutoff value for the GLLR risk score (Figure 3). The low cutoff value was selected so that the NPV was at least 90 percent. The value with the highest PPV that met the NPV criteria was selected as the low cutoff value. The high cutoff value was selected so that the PPV was at least 80 percent be-cause if a cutoff value was selected so that the PPV was at least 90 percent, only two farms met the criterion. Farms with an overall GLLR score smaller than the low cutoff were assigned to low risk group (88 farms); those with a score larger than the high cutoff were assigned to the high risk group (10 farms). All other farms were in the medium risk group (98 farms).
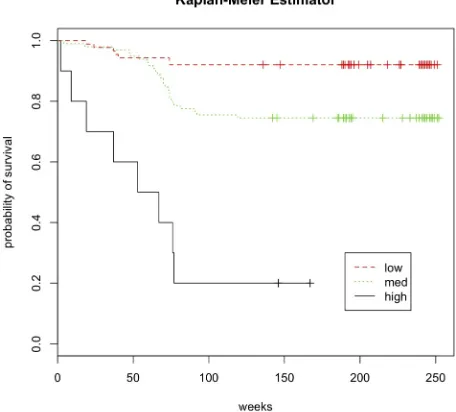
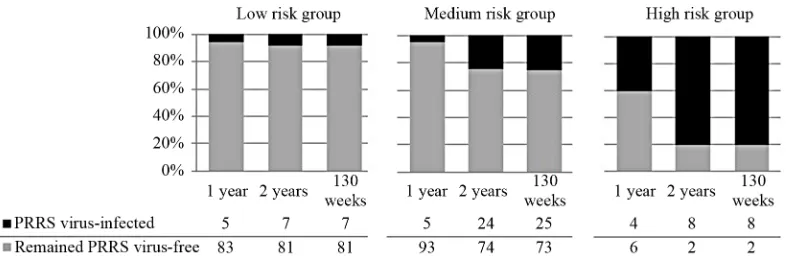
[image:6.595.57.289.82.304.2]Kaplan-Meier survival curves for each of the risk groups are reported in Figure 4. The difference in the survival curves among the three risk groups was statisti-cally significant (p < 0.001) by the log-rank chi-squared test. Figure 5 is a summary of sow farm survival by risk group for year 1, 2 and 130 weeks. Relative to farms in the low and medium risk groups, a greater percentage of farms in the high risk group became PRRS virus infected in 1 year, 2 years and 130 weeks. Only 2 of the 10 (20
Figure 3. Plot of positive and negative predictive values for predicting whether farms in the long-term prospective study of 196 PRRS virus-free sow farms in the US survived for 130 weeks for alternative cutoff values of the risk score de-termined by applying group lasso logistic regression (GLLR) to the database of PRRS Risk Assessment for the Breeding Herd surveys.
Figure 4. Kaplan-Meier survival curve for farms in the long-term prospective study of 196 PRRS virus-free sow farms in the US stratified by risk group. Risk groups de-fined by low and high cutoff value of the risk score deter-mined by applying group lasso logistic regression (GLLR) to the database of PRRS Risk Assessment for the Breeding Herd surveys.
[image:6.595.309.537.367.573.2]Figure 5. Survival of farms for 1 year, 2 years and 130 weeks in the long-term prospective study of 196 PRRS virus-free sow farms in the US by risk group. Risk groups defined by low and high cutoff value of the risk score determined by applying group lasso logistic regression (GLLR) to the database of PRRS Risk Assessment for the Breeding Herd surveys.
group stayed PRRS virus-free for 130 weeks
4. Discussion
The results of this study are encouraging as the GLLR risk scoring system developed to perform well. Dividing farms into 3 risk groups (low, medium and high) using a low and high cutoff values for the GLLR risk score was informative as the differences in the KM survival curves for the 3 groups were both clinically meaningful and sta-tistically significant. The GLLR risk scoring system used in conjunction with the PRRS Risk Assessment for the Breeding Herd survey delivered through PADRAP ap-pears to have the potential to help veterinarians predict the likelihood of virus introduction in PRRS virus-free sow farms in the US. If incorporated into PADRAP, the GLLR risk scoring system would enable producers and veterinarians to more confidently predict how long sow farms will remain PRRS virus-free following successful elimination of the virus. As a result, some of the uncer-tainty that has deterred veterinarians and producers from attempting to eliminate the PRRS virus from sowing farms would be removed.
The results reveal the limitations of relying on expert opinion for developing risk scoring systems in food ani-mal medicine as the EO risk scoring system was a poor predictor of the likelihood of virus introduction into PRRS virus-free sow farms. The results also demonstrate the utility of group lasso for logistic regression for overcom-ing the challenges of dealovercom-ing with the large number of variables.
The questions in the risk assessment survey were as-signed to the internal and external risk sections, in part, on the basis of possible routes of transmission of the PRRS virus. Questions in all of the internal and external risk sections were included in the GLLR risk scoring system suggesting that all of the routes of transmission that were considered in this study were important enough to be included in the risk scoring system. This is consis-tent with the body of research demonstrating the
impor-tance of multiple routes by which PRRS virus is trans-mitted [17].
This study utilized the data in the PRRS Risk Assess-ment for the Breeding Herd survey delivered through PADRAP and used by a community of swine veterinari-ans. This was only possible because veterinarians use of the risk assessment survey has produced a large dataset of information on risk factors, incidence and clinical out-comes for PRRS virus in swine. Because of the resources needed to create these databases they have not previously been developed as they have in human medicine. A pro-gram like PADRAP which relies on a community of vet-erinarians using a program that is supported by a profes-sional association is a way to successfully overcome the resource limitations in veterinary medicine.
5. Acknowledgements
The authors thank AASV, National Pork Board, National Pork Producers Council, Boehringer Ingelheim Vetme- dica Inc., Newport Laboratories, Harrisvaccines and USDA (USDA NIFA Award 2008-55620-19132) for supporting PADRAP financially.
REFERENCES
[1] D. J. Holtkamp, et al., “Assessment of the Economic Impact of Porcine Reproductive and Respiratory Syn- drome Virus on United States Pork Producers,” Journal ofSwineHealthandProduction, Vol. 21, No. 2, 2013, pp. 72-84.
[2] Y. Li, et al., “Emergence of a Highly Pathogenic Porcine Reproductive and Respiratory Syndrome Virus in the Mid-Eastern Region of China,” TheVeterinary Journal, Vol. 174, No. 3, 2007, pp. 577-584.
doi:10.1016/j.tvjl.2007.07.032
[3] S. Dee, H. Joo, B. Park, T. Molitor and G. Bruna, “At- tempted Elimination of Porcine Reproductive and Respi- ratory Syndrome Virus from a Seedstock Farm by Vacci- nation of the Breeding Herd and Nursery Depopulation,”
175
doi:10.1136/vr.142.21.569
[4] S. Dee, M. Bierk, J. Deen and T. Molitor, “An Evaluation of Test and Removal for the Elimination of Porcine Re- productive and Respiratory Syndrome Virus from Five Swine Farms,” CanadianJournalofVeterinaryResearch, Vol. 63, No. 1, 2001, pp. 22-27.
[5] T. Gillespie and A. Carroll, “Methods of Control and Elimination of Porcine Reproductive and Respiratory Syndrome Virus Using Modified Live Vaccine in a Two- Site Production System,” Journal of Swine Health and Production, Vol. 11, No. 6, 2003, pp. 291-295.
[6] C. A. Corzo, E. Mondaca, S. Wayne, M. Torremorell, S. Dee, P. Davies and R. B. Morrison, “Control and Elimi- nation of Porcine Reproductive and Respiratory Syn- drome Virus,” VirusResearch, Vol. 154, No. 1-2, 2010, pp. 185-192. doi:10.1016/j.virusres.2010.08.016
[7] D. J. Holtkamp, et al., “Terminology for Classifying Swine Herds by Porcine Reproductive and Respiratory Syndrome Virus Status,” Journal of Swine Health and Production, Vol. 19, No. 1, 2011, pp. 44-56.
[8] R. A. Rockar, K. S. Drobatz and F. S. Shofer, “Develop- ment of a Scoring System for the Veterinary Trauma Pa- tient,” Journal of Veterinary Emergency and Critical Care, Vol. 4, No. 2, 1994, pp. 77-83.
doi:10.1111/j.1476-4431.1994.tb00118.x
[9] American Association of Swine Veterinarians, “Produc- tion Animal Disease Risk Assessment Program,” 2012. http://www.padrap.org
[10] L. Meier, S. van de Geer and P. Buhlmann, “The Group Lasso for Logistic Regression,” JournaloftheRoyalSta-
tisticalSociety: SeriesB, Vol. 70, 2008, pp. 53-71. doi:10.1111/j.1467-9868.2007.00627.x
[11] E. Barranger, et al., “An Axilla Scoring System to Predict Non-Sentinel Lymph Node Status in Breast Cancer Pa- tients with Sentinel Lymph Node Involvement,” Breast CancerResearchandTreatment, Vol. 91, No. 2, 2005, pp. 113-119. doi:10.1007/s10549-004-5781-z
[12] A. Alert and J. A. Anderson, “On the Existence of Maxi- mum Likelihood Estimates in Logistic Regression Mod- els,” Biometrika, Vol. 71, No. 1, 1984, pp. 1-10. doi:10.1093/biomet/71.1.1
[13] H. Lin, C. Wang, P. Liu and D. J. Holtkamp, “Construc- tion of Disease Risk Scoring Systems Using Logistic Group Lasso: Application to Porcine Reproductive and Respiratory Syndrome Survey Data,” JournalofApplied Statistics, Vol. 40, No. 4, pp. 736-746.
[14] L. Meier, “Grplasso: Fitting User Specified Models with Group Lasso Penalty,” R Package Version 0 4-2, 2009. http://CRAN.R-project.org/package=grplasso
[15] “R: A Language and Environment for Statistical Compu- ting [Computer Program],” Vienna, R Foundation for Sta- tistical Computing, 2011.
[16] R Development Core Team, “R Package Survival,” R Package Version 2 35-8, 2009.
http://CRAN.R-project.org/package=survival