warwick.ac.uk/lib-publications
Manuscript version: Working paper (or pre-print)
The version presented here is a Working Paper (or ‘pre-print’) that may be later published
elsewhere.
Persistent WRAP URL:
http://wrap.warwick.ac.uk/92079
How to cite:
Please refer to the repository item page, detailed above, for the most recent bibliographic
citation information. If a published version is known of, the repository item page linked to
above, will contain details on accessing it.
Copyright and reuse:
The Warwick Research Archive Portal (WRAP) makes this work by researchers of the
University of Warwick available open access under the following conditions.
Copyright © and all moral rights to the version of the paper presented here belong to the
individual author(s) and/or other copyright owners. To the extent reasonable and
practicable the material made available in WRAP has been checked for eligibility before
being made available.
Copies of full items can be used for personal research or study, educational, or not-for-profit
purposes without prior permission or charge. Provided that the authors, title and full
bibliographic details are credited, a hyperlink and/or URL is given for the original metadata
page and the content is not changed in any way.
Publisher’s statement:
Please refer to the repository item page, publisher’s statement section, for further
information.
Case Study of Error Recovery and Error Propagation on Ranger
Edward Chuah
k∗, Arshad Jhumka
∗, Samantha Alt
††, Theo Damoulas
k∗, Nentawe Gurumdimma
∗∗,
Marie-Christine Sawley
††, William L. Barth
¶, Tommy Minyard
¶, James C. Browne
‡kThe Alan Turing Institute, 96 Euston Road, London NW1 2DB, UK. Email: {echuah, tdamoulas}@turing.ac.uk ∗University of Warwick, Coventry CV4 7AL, UK. Email:{E.Chuah, H.A.Jhumka, T.Damoulas}@warwick.ac.uk
††Intel Corporation, USA and France. Email:{samantha.alt, marie-christine.sawley}@intel.com ∗∗University of Jos P.M.B 2084 Jos, Plateau State Nigeria, Post code: 930001. Email: [email protected]
¶Texas Advanced Computing Center, Texas 78758. Email:{bbarth, minyard}@tacc.utexas.edu ‡University of Texas at Austin, Texas 78712. Email: [email protected]
Abstract—We give the details of two new dependability-oriented use cases on recovery attempt and error propagation on the Ranger supercomputer. The use cases are: (i) Error propagation between the Lustre file-system I/O and Infiniband, and (ii) Recovery attempt and its impact on the chipset and memory system.
Index Terms—Large cluster system; Lustre file-system I/O and Infiniband; Chipset and memory system; Case study; Diagnosis
I. CAPTURINGERRORPROPAGATION: LUSTRE FILE-SYSTEMI/OANDINFINIBAND
In this section, we show an example of the process of error propagation inferred through the correlations of Infiniband and Lustre I/O resource use counters and Lustre file-system and communication error events.
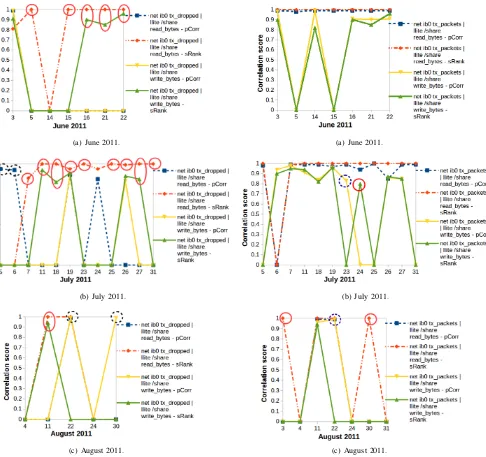
1) Phase 1: Correlated Infiniband & Lustre file-system counters: The Infiniband and Lustre file-system resource use counters can be used to see what happens when the network and file-system are under heavy use. Thenet ib0 tx_dropped counter records the amount of dropped network packets, and the net ib0 tx_packets counter records the amount of transmitted network packets. The llite /share read_bytes counter records the amount of bytes read in the Lustre file-system’s share partition, and the llite /share write_bytes counter records the amount of bytes written to the Lustre file-system’s share partition.
From Fig. 1, we observed that net ib0 tx_dropped is strongly correlated to llite /share read_bytes with scores that range between 0.81 to 1 on 20 dates, and net ib0 tx_dropped is strongly correlated to llite /share write_bytes with scores that range between 0.82 to 0.99 on 12 dates. From Fig. 2, we observed that net ib0 tx_packets is strongly correlated to llite /share read_bytes with scores that range between 0.94 to 1 on 22 dates, and net ib0 tx_packets is strongly correlated to llite /share write_bytes with scores that range between 0.80 to 0.99 on 16 dates. We observed that only Pearson correlation [1] identified the correlated net ib0 tx_dropped and llite /share read_bytes, net ib0 tx_dropped and llite /share write_bytes, and net ib0 tx_packets and llite /share write_bytes counters on five dates. However, we observed that only Spearman-Rank correlation [1] identified the correlated net ib0 tx_packets, net ib0 tx_dropped,
llite /share read_bytes and llite /share write_bytes counters on 18 dates. If Pearson correlation is used as the only correlation method, the correlated Infiniband & Lustre file-system counters on these 18 dates would not be identified. However, if Spearman-Rank correlation is used as the only correlation method, the correlated Infiniband & Lustre file-system counters on the five dates would not be identified. Our results show that:
• There is a strong relationship between Infiniband and Lustre I/O activities on 24 dates.
• Pearson correlation and Spearman-Rank correlation are suitable methods. Pearson correlation identified Infini-band & Lustre I/O activities that follow a linear pattern and Spearman-Rank correlation identified Infiniband & Lustre I/O activities that follow a monotonically increas-ing function.
In Section I-2, we will show how error propagation can be inferred between Lustre I/O and Infiniband activities through the correlations of two different groups of error events.
2) Phase 2: Correlated communication & file-system errors: Communication errors can be identified from error occurred while communicating events. Errors in the file-system can be identified from the failure inode and error reading dir events. From Fig. 3(a) and Fig. 3(b), we observed that the error occurred while communicating events are strongly correlated to failure inode events with scores that range between 0.81 and 1 on 10 dates. From Fig. 3(c), we observed that the error occurred while communicating events are strongly correlated to error reading dir events with a score of 1 on one date. We observed that Pearson correlation identified the correlated communication and file-system errors on 11 dates but Spearman-Rank correlation identified the correlated communication and file-system errors on six of the 11 dates. Our results show that Pearson correlation identified all the dates when communication and file-system errors are correlated on the given dates on Ranger.
(a) June 2011.
(b) July 2011.
[image:3.612.59.300.47.496.2](c) August 2011.
Fig. 1. Correlations between “net ib0 tx dropped”, “llite /share read bytes” and “llite /share write bytes” counters. The full-circled counters were iden-tified by Spearman-Rank correlation only. The dot-circled counters were identified by Pearson correlation only.
accessed, the information that the client needs is lost and the client is unable to access the file. We implemented a function that scanned the error occurred while communicating message and identified the words failed with Lustre and failed with client.c in all the error occurred while communicating messages which are correlated to failure inode on all the 10 dates. As we conjectured in Section I-1, our results show that there is indeed error propagation between the Lustre file-system and Infiniband.
Correlations with failures: Next, we scanned the list of correlated events to determine the correlation strength between error occurred while communicating and soft lockup
(a) June 2011.
(b) July 2011.
(c) August 2011.
Fig. 2. Correlations between “net ib0 tx packets”, “llite /share read bytes” and “llite /share write bytes” counters. The full-circled counters were iden-tified by Spearman-Rank correlation only. The dot-circled counters were identified by Pearson correlation only.
events, and failure inode and soft lockup events. A summary of the strongly correlated events is given in Table I. From Table I, we observed that the communication errors are strongly correlated to soft lockup events, and the failure inode events are strongly correlated to soft lockup events on June 21 and July 23.
[image:3.612.78.564.48.505.2](a) June 2011.
(b) July 2011.
(c) August 2011.
Fig. 3. (a) and (b) Correlations of “error occurred while communicating” and “failure inode”, (c) Correlations of “error occurred while communicating” and “error reading dir”. The dot-circled events were identified by Pearson correlation only.
propagation of inode failures (Lustre error) to communication errors led to compute node hang-ups on two of eleven dates, representing a failure rate of 18%.
Further, we found that correlated communication errors and inode failures on the nine other dates are weakly correlated to soft lockup events. Our results suggest that the following had occurred: When a client requested access to data stored in the file-system, the information needed to retrieve the data was lost because it is stored in a faulty inode. This led to the
communication error being generated and sent to the client. The client then repeated its request for the data and the file-system was able to recover the information. Recovery from propagation of inode failures occurred on nine out of eleven dates, representing a recovery rate of 81%.
I/O errors can be reported when a client reads a directory from the file-system. We identified the words failed with Lustre and failed with client.c in the error occurred while communicating message which is correlated to error reading dir on one date. We manually scanned the list of correlated events and found that error occurred while communicating and error reading dir events are weakly correlated to soft lockups.
Detailed recovery path: When a client requested access to a directory on the file-system, a directory read error was generated and sent to the client. The client repeated its request however, the file-system recovered from the error and complete the client request.
The benefit of combining analysis of Lustre I/O & Infini-band resource use counters and Lustre file-system & commu-nication error events is as follows: When correlations of Lustre I/O & Infiniband resource use and correlations of Lustre file-system & communication errors occur on the same date, it shows that Lustre I/O & Infiniband activities are associated with the generation of Lustre file-system & communication errors. Therefore, these correlations can be used to track errors between the Lustre file-system and Infiniband.
TABLE I
SUMMARY OF CORRELATED“ERROR OCCURRED WHILE COMMUNICATING WITH”AND SOFT LOCKUP,AND CORRELATED“FAILURE INODE”AND
SOFT LOCKUP.
Error event Failure event Date pCorr sRank error occurred while soft lockup June 21 1 -communicatihg with
failure inode soft lockup June 21 1 -error occurred while soft lockup July 23 0.99 -communicating with
failure inode soft lockup July 23 0.99
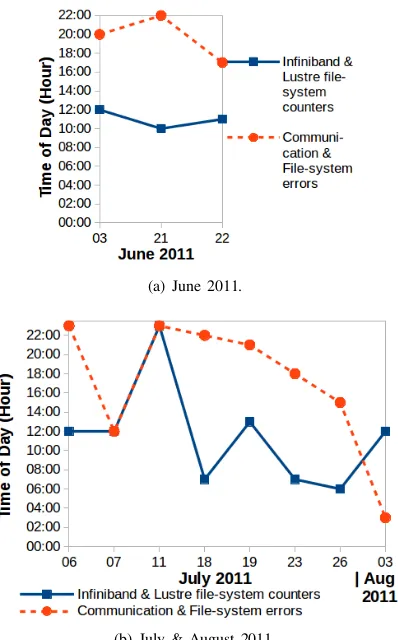
the times of change identified on all dates. The time-windows range from one-hour to 15-hours.
(a) June 2011.
(b) July & August 2011.
Fig. 4. Times of change in the correlated Infiniband & Lustre file-system counters and correlated communication & file-system errors.
4) Validation: Next, we test the significance of: (i) the correlation coefficient of the strongly positive correlated re-source use counter groups, and (ii) the correlation coefficient of the strongly positive correlated error groups. We test all the correlation coefficients against the null hypothesis and obtained the z-scores for all the correlation coefficients and a summary is given in Table II. From Table II, we observed
TABLE II
SUMMARY OFz-SCORES.nCONTAINS THE NUMBER OF HOURLY TIME-BINS IN ONE DAY OF LOGS.
Correlated groups June 2011 July 2011 Aug 2011 Infiniband & 3.71≤zr 3.58≤zr 6.51≤zr
Lustre file-system ≤10.68 ≤10.68 ≤10.68
resource counters (n= 24)
Communication & 3.71≤ze 5.29≤ze ze= 10.68
File-system errors (n= 24) ≤10.68 ≤10.68
that thez-scores for all the correlation coefficients range from 3.58 to 10.68. At the 99% confidence level, under the null hypothesis z0r = 2.64 andz0e = 2.64. Hence, we reject the
null hypothesis in favour of the alternate hypothesis.
Next, we determine the probability of rejecting the null hypothesis when it is true. We apply a one-sided test and use
the significance level,α= 0.01for all given hypothesis tests to obtain aP-value. From Table II, we observed that the lowest z-score is 3.58. Since this is a one-sided test, the P-value is equal to the probability of observing a value greater than 3.58 in the standard normal distribution, or P(Z > 3.58) =
1−P(Z ≤ 3.58) = 1−0.999828 = 0.000172. Using the
Bonferroni correction to counteract the problem of inflation in false positive due to multiple hypothesis tests [2], we obtained the adjustedP-value0.000172×24 = 0.0041where 24 is the number of dates. TheP-value is less than 0.01, indicating it is highly unlikely this result would be observed under the null hypothesis. All the z-scores in Table II are greater than or equal to 3.58 and all the adjustedP-values are less than 0.01, indicating it is highly unlikely these results would be observed under the null hypothesis.
II. CAPTURINGRECOVERYATTEMPT AND ITSIMPACT: CHIPSET ANDMEMORY SYSTEM
In this section, we explain how correlations between CPU and memory resource use counters and correlations between chipset and ECC1 errors can be used to first infer error recovery, and then assess the impact of the ECC recovery mechanism on the system reliability.
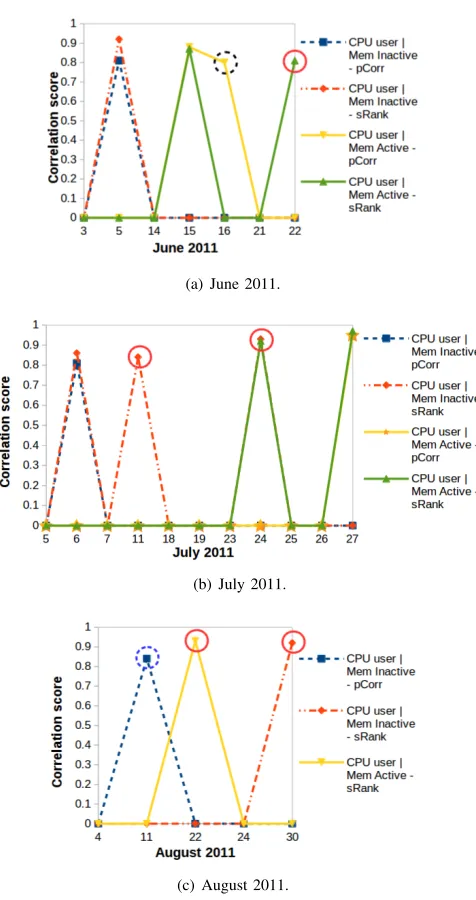
1) Phase 1: Correlated CPU & Memory counters: The CPU and memory resource use counters can be used to see what happens when CPU and memory activities are occurring in the cluster system. The CPU user counter records CPU usage by user, and theCPU systemcounter records CPU usage by the system. TheMEM Inactivecounter records the amount of pages that were not accessed recently in main memory, and theMEM Activecounter records the amount of pages that were accessed recently in main memory.
From Fig. 5, we observed thatCPU user is strongly corre-lated to MEM Inactive with scores that range between 0.81 to 0.93 on five dates, and CPU user is strongly correlated to MEM Active with scores that range between 0.80 to 0.97 on six dates. From Fig. 6, we observed that CPU system is strongly correlated to MEM Inactive with scores that range between 0.84 to 0.97 on eight dates, and CPU system is strongly correlated to MEM Active with scores that range between 0.81 to 0.97 on seven dates. We observed that only Pearson correlation [1] identified the correlated counters on June 16, July 23 and August 04 and 11. We observed that only Spearman-Rank correlation [1] identified the correlated counters on seven different dates. If Pearson correlation is used as the only correlation method, the correlated CPU and memory counters on June 05 and 22, July 06, 11 and 24, and August 22 and 30 would not be identified. However, if Spearman-Rank correlation is used as the only correlation method, the correlated CPU and memory counters on June 16, July 23 and August 04 and 11 would not be identified. Our results show that:
• There is a strong relationship between CPU and memory activities on 13 dates.
[image:5.612.77.276.85.405.2]• Pearson correlation and Spearman-Rank correlation are
suitable methods. Pearson correlation identified the CPU & memory resource usage that follow a linear pattern and Spearman-Rank correlation identified the CPU & mem-ory resource usage that follow a monotonically increasing function.
(a) June 2011.
(b) July 2011.
[image:6.612.313.560.46.499.2](c) August 2011.
Fig. 5. Correlation of “CPU user” and “MEM Inactive” counters, and correlation of “CPU user” and “MEM Active” counters. The full-circled counters were identified by Spearman-Rank correlation only. The dot-circled counters were identified by Pearson correlation only.
2) Phase 2: Correlated Chipset & ECC Errors: The north-bridge is a chip in the core logic chipset architecture on a computer motherboard. The northbridge is connected directly to the CPU and it typically handles communication among the CPU, memory and graphics controller. ECC memory is used in computers where internal data corruption can not be tolerated under any circumstances. When the CPU attempts to
(a) June 2011.
(b) July 2011.
[image:6.612.58.296.130.580.2](c) August 2011.
Fig. 6. Correlation of “CPU system” and “MEM Inactive” counters, and correlation of “CPU system” and “MEM Active” counters. The full-circled counters were identified by Spearman-Rank correlation only. The dot-circled counters were identified by Pearson correlation only.
of CPU and memory resource use counters occurred on all the dates when northbridge, core and ECC errors are correlated.
Correlations with failures: Next, we manually scanned the list of correlated events to determine the strength of the correlation between Northbridge error and soft lockup events, core and soft lockup events, andECC errorand soft lockups events. We found that Northbridge error,coreand ECC errorevents are weakly correlated to soft lockup events on all 26 dates. This represents a recovery rate of 100%.
Detailed diagnosis: When correlations of CPU & memory resource use counters and correlations of chipset & ECC errors occur on the same date, it shows that CPU memory usage activities are associated with the generation of chipset and memory errors. When the CPU accessed corrupted data stored in ECC memory, this triggered an ECC error which was subsequently corrected. Therefore, the correlated CPU & memory resource use counters and correlated chipset & memory errors can be used to monitor recovery from internal data corruption.
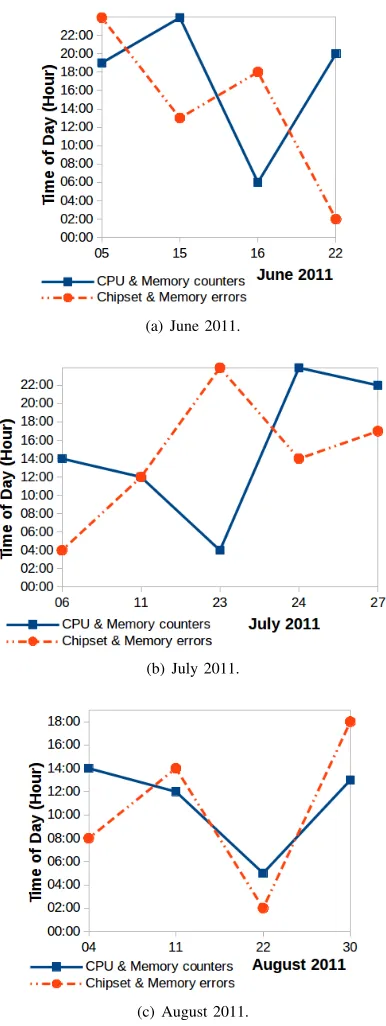
3) Phase 3: Earliest times of change: From Fig. 8, we observed that the earliest times of change in the correlated CPU & memory resource use counters and correlated chipset & ECC errors on each date are different. The times of change: (i) occurred first in the correlated CPU and memory resource use counters on five dates, (ii) occurred first in the correlated chipset and ECC errors on seven dates, and (iii) occurred in both the correlated counters and correlated errors at the same time on one date. If the correlated errors were used as the only source, the earliest times of change on five dates would not be identified. Having said that, if the correlated resource use counters were used as the only source, the earliest times of change on seven dates would not be identified. Our results show that both the correlated resource use counters and correlated errors are required to identify the earliest times of change in the system behaviour on all dates. Further, we observed there are different time-windows between the times of change identified on all dates. The time-windows range from one to 19-hours.
4) Validation: Next, we test the significance of: (i) the correlation coefficient of the strongly positive correlated re-source use counter groups, and (ii) the correlation coefficient of the strongly positive correlated error groups. We test all the correlation coefficients against the null hypothesis and obtained the z-scores for all the correlation coefficients and a summary is given in Table III. From Table III, we observed
TABLE III
SUMMARY OFz-SCORES.nCONTAINS THE NUMBER OF HOURLY TIME-BINS IN ONE DAY OF LOGS.
Correlated groups June 2011 July 2011 Aug 2011 CPU & Memory 3.74≤zr 3.74≤zr 4.17≤zr
counters(n= 24) ≤5.86 ≤8.16 ≤6.18
Chipset & ECC errors ze= 10.68 ze= 10.68 ze= 10.68
(23≤n≤24)
that thez-scores for all the correlation coefficients range from 3.74 to 10.68. At the 99% confidence level, under the null
(a) June 2011.
(b) July 2011.
(c) August 2011.
Fig. 7. Correlation of “Northbridge error” and “ECC error” events, and correlation of “Northbridge error” and “core” events.
hypothesis z0r= 2.64 andz0e= 2.64. Hence, we reject the
null hypothesis in favour of the alternate hypothesis.
(a) June 2011.
(b) July 2011.
[image:8.612.78.271.45.558.2](c) August 2011.
Fig. 8. Times of change in the correlated CPU & memory resource use counters and correlated chipset & ECC errors.
we obtained the adjusted P-value 0.00008×26 = 0.00208 where 26 is the number of dates. TheP-value is less than 0.01, indicating it is highly unlikely this result would be observed under the null hypothesis. All the z-scores in Table III are greater than or equal to 3.74 and all the adjusted P-values are less than 0.01, indicating it is highly unlikely these results would be observed under the null hypothesis.
ACKNOWLEDGEMENTS
We would like to thank the Texas Advanced Comput-ing Center (TACC) for providComput-ing the Ranger cluster log data and granting access to their systems administrators. We also thank Karl Solchenbach (Intel Corporation, Europe) for granting access to his research scientists. This research is supported by The Alan Turing Institute under the EPSRC grant EP/N510129/1, The Alan Turing Institute-Intel partnership and the National Science Foundation under OCI awards #0622780 and #1203604 to TACC at the University of Texas at Austin.
REFERENCES
[1] R. E. Walpole, R. H. Myers, and S. L. Myers,Probability and Statistics for Engineers and Scientists. Prentice Hall International, 1998. [2] J. J. Goeman and A. Solari, “Multiple hypothesis testing in genomics,”