University of Warwick institutional repository: http://go.warwick.ac.uk/wrap
This paper is made available online in accordance with publisher policies. Please scroll down to view the document itself. Please refer to the repository record for this item and our policy information available from the repository home page for further information.
To see the final version of this paper please visit the publisher’s website. Access to the published version may require a subscription.
Author(s): L.E. Green, J.J. Carrique-Mas, S.A. Mason, G.F. Medley Article Title: Patterns of delayed detection and persistence of bovine tuberculosis in confirmed and unconfirmed herd breakdowns in cattle and cattle herds in Great Britain
Year of publication: 2012 Link to published article:
http://link.aps.org/doi/10.1016/j.prevetmed.2012.04.008
1 Patterns of delayed detection and persistence of bovine tuberculosis in confirmed and
1
unconfirmed herd breakdowns in cattle and cattle herds in Great Britain 2
L. E. Green, J. J. Carrique-Mas, S. A. Mason, G. F. Medley 3
4
School of Life Sciences 5
University of Warwick 6
Coventry 7
CV4 7AL UK 8
9
Corresponding author and address: 10
Professor Laura Green telephone, 44 24 765 23797, email [email protected] 11
2 Abstract
15
Approximately 1500 / 6000 cattle farms that were depopulated during the foot and mouth 16
epidemic in GB in 2001 had been repopulated and subjected to two unrestricted (herd 17
considered free from bovine tuberculosis (bTB)) herd tests. Factors associated with herd 18
breakdown(s) (HBD) and individual cattle reactor status at the second test were investigated. 19
There were 96 HBD in total, with a three-fold increased risk of HBD in herds that had had a 20
HBD at the first test after restocking. Two mixed effect models were used to investigate 21
factors associated with 324/246060 reactor cattle at the second bTB test; 228 reactors were at 22
confirmed HBD and 96 at unconfirmed HBD; 253 (79%) reactors at the second test that were 23
present and test negative at the first test. In confirmed HBD, the odds of cattle reacting were 24
higher if the restocked farm had a history of bTB before 2001 and if the source and restocked 25
farms were high frequency tested (HFT) farms (routine bTB tests at ≥ 1 per two years). 26
Reacting cattle were more likely to have been born on the restocked farm before the first test 27
after FMD and less likely to have been purchased from a low frequency tested (LFT) farm 28
(routine bTB tests at 3 – 4 year intervals) after the first test compared with a baseline of cattle 29
purchased from a LFT farm before the first test. Unconfirmed HBD at the second test was 30
more likely when the first test was a confirmed HBD and when there was a history of bTB in 31
the restocked farm. In contrast to confirmed HBD, cattle purchased from a LFT farm after the 32
first test were at increased risk of reacting at an unconfirmed HBD at the second test. 33
We conclude that a farm history of bTB suggests persistence of bTB on the farm. Confirmed 34
tests indicate exposure to bTB for some time indicated by the increased risk from HFT source 35
and restocked farms and a farm history of bTB. The risks for reactors are related to the farm, 36
herd and duration of exposure to those risks. Therefore, the spread of bTB to naïve herds 37
3 farms exposed to bTB. Management of bTB on farms with bTB is complicated because there 39
is undisclosed infection in cattle and environmental contamination. 40
41
Key words: Bovine tuberculosis, herd breakdown, persistence, delayed detection 42
4 1. Introduction
44
In the UK the single intradermal comparative cervical test (SICCT) is used to test cattle for 45
exposure to bovine tuberculosis (bTB). Cattle are given two intradermal injections, one with 46
protein from Mycobacterium bovis and one with protein from Mycobacterium avium. A herd 47
breakdown (HBD) occurs when, under standard interpretation of the SICCT, there is a 48
relatively larger reaction at the M. bovis site of ≥ 5mm skin thickness compared with the M. 49
avium site in at least one animal in the herd. These cattle are investigated further for gross 50
lesions indicative of bTB or culture of M. bovis and if either further test is positive in at least 51
one reactor then the HBD is confirmed. If a HBD is confirmed, then the cattle are retested 52
and the test is changed to severe interpretation in which cattle are classified as reactors if the 53
skin thickness at the M. bovis site is ≥ 3mm more than the M. avium site or a swelling of ≥ 54
1mm at the M. bovis site with no reaction at the M. avium site. The SICCT test is estimated to 55
be 99.2 – 99.99% specific but a range of sensitivities has been reported from 65% to 95% 56
(Adams, 2001; Costello et al., 1997; Monaghan et al., 1994) and most recently 60% (Clegg et 57
al., 2011). Although the effect of different interpretations of the test have not been quantified, 58
it is likely that the sensitivity of the test is higher and the specificity slightly lower when 59
SICCT results are interpreted under severe interpretation. Once there is a HBD the herd 60
remains restricted until it has one / two clear tests at 60 day intervals for unconfirmed / 61
confirmed HBD, respectively. At this point the herd becomes unrestricted again. One concern 62
about this approach is that the sensitivity os the test is lower in animals that are tested at 63
frequent intervals (Radunz and Lepper 1985; Coad et al., 2010) and consequently a herd 64
might become unrestricted when cattle fail to respond to the test rather than when bTB is 65
eliminated. 66
The 2001 foot-and-mouth disease (FMD) epidemic in Great Britain (GB) resulted in the 67
5 farms were subsequently restocked with cattle and these newly formed herds had a
69
compulsory test for bovine tuberculosis (bTB). By August 2004 approximately 3000 herds 70
had had their first test and 6% of herds had a HBD (Carrique-Mas et al., 2008). The main 71
risks associated with HBD at the first test were purchasing cattle from farms that were tested 72
biennially or more frequently for eight years before the FMD epidemic, a history of HBD 73
with bTB on the farm in the five years before destocking and the number of cattle tested 74
(Carrique-Mas et al., 2008). 75
76
Restocked farms in the north of England were primarily only at risk from bTB when they 77
were restocked with cattle from high risk areas (Carrique Mas, 2007). Purchase of infected 78
cattle was, therefore, the most likely explanation for a HBD on these newly restocked farms 79
with no history of bTB. These conclusions have been supported by other studies (Gilbert, 80
2005; Gopal et al., 2006; Ramirez-Villaescusa et al., 2009; Reilly and Courtenay, 2007; 81
Wolfe et al., 2009). 82
83
If cattle are the only source of exposure to bTB for other cattle, then destocking and 84
restocking should have ‘reset’ all herds to time zero, i.e. there should not be a farm (local) 85
effect nor should risks for previous HBD on the depopulated farm carry over to restocked 86
cattle. The identification of a farm risk separate from a herd risk provides evidence for a farm 87
/ environment reservoir which is separate from the cattle infection status. The farm-based 88
environmental risk is likely to be the result, at least in part, of badger (Meles meles) infection 89
with M. bovis, demonstrated by the reduction in risk when badgers are removed (Donnelly et 90
al., 2006; Griffin et al., 2005) and possibly contamination in the environment (Courtenay, 91
2006) or slurry (Reilly and Courtenay, 2007) or contact with cattle from neighbouring herds 92
6 Results from the first bTB test after FMD in these repopulated herds also indicated an
94
exponential decay in the risk of HBD dependent on the time since the last HBD such that the 95
risk was not detectable if the previous HBD occurred >5yrs before the first test after 96
restocking (Carrique-Mas et al., 2008). This decay has two potential explanations. First, that 97
the risk from local / farm reservoirs decays exponentially, i.e. a real time effect. Second, that 98
this decay is an artefact of the testing regime. The testing interval is associated with the 99
historic farm risk so the last test before FMD in annual or biennial testing restocked farms is 100
likely to have occurred more recently than in 3 or 4 year testing restocked farms. If the 101
environmental risk on farms is heterogeneous and relatively constant, then farms that are 102
tested more frequently would have a higher risk of HBD and the interval between HBD 103
would be shorter, leading to a perceived decay in risk. It is important to distinguish between 104
these explanations: if the first is correct, then it is possible that farms can be cleared of M. 105
bovis by exclusion of cattle for a period of time. 106
107
Consequently, the principal risks of a HBD are derived from the farm environment (measured 108
as recent history of HBD) and from cattle history (measured as the history of HBD in herds in 109
which cattle have been resident). The risk of an individual animal being a reactor is 110
dependent on the history of the herds in which an individual has resided. In the current study 111
we examine the risks for both HBD and individual cattle being reactors in the restocked herds 112
investigated by Carrique-Mas et al. (2008) at their second unrestricted herd test for bTB. We 113
were specifically interested in whether cattle moved from high frequency tested (annual and 114
biennial tested) herds were still at high risk of reacting to the second test, and wished to 115
further investigate the pattern of risk associated with a farm’s previous history of bTB. 116
7 2. Materials and methods
118
2.1 Data 119
In 2003, movement data from the cattle tracing system (CTS) and bovine tuberculin testing 120
data from VetNet (Mitchell et al., 2005) were used to construct a dataset of the population of 121
3000 restocked herds that had been tested for bTB after restocking (Carrique-Mas et al., 122
2008). In August 2004 the second unrestricted herd test results for 1500 of these herds were 123
added to the database. The outcome of interest was the second unrestricted bTB test after 124
FMD. For herds negative at the first test this was a check test, whole herd test or routine herd 125
test; these are all herd tests that are done on unrestricted herds that have not recently broken 126
down (see Green and Cornell 2005 for details). For herds positive at the first test the outcome 127
of the six-month test after the lifting of movement restrictions was used; this test is only done 128
on herds that have broken down. 129
130
We used these 1500 unrestricted restocked herds to investigate the risks for a second HBD 131
and risks for individual animal reactors. For the herds, the variables investigated were a 132
confirmed / unconfirmed HBD at the first test after restocking, herd size, annual or biennial 133
testing (farm had had ≥ 4 herd tests in the previous 8 years) i.e. high testing frequency herds 134
(HTFH) versus 3 or 4 year testing interval, i.e. low testing frequency herds (LTFH) in the 135
restocked herd and source herd and a history of bTB on the restocked farm. 136
137
For individual cattle present in the herds at the second unrestricted test, the risk of being a 138
reactor was analysed. The variables investigated were the same as those for the herd. In 139
addition, cattle were classified as purchased before the first test, born in the restocked herd 140
before the first test, purchased after the first test, or born in the restocked herd after the first 141
8 a subject herd were classified on the basis of that herd. Cattle age was calculated as log10 age 143
in months. 144
145
2.2 Data analysis 146
The relationship between the time since the last HBD before FMD and a HBD at the first and 147
second tests was investigated, using t tests and chi squared tests as appropriate, to determine 148
whether there was a decrease in risk with time since last HBD in previously affected herds. 149
150
Two multivariable hierarchical binomial logistic regression models with random effects 151
(Goldstein, 2003) were developed: one with reactors that were identified at confirmed HBD 152
(in which reactors at unconfirmed HBD were coded as missing) and one with cattle that were 153
reactors at unconfirmed HBD (in which reactors at confirmed HBD were coded as missing). 154
It was not possible to define individual reactor cattle as confirmed or unconfirmed because 155
not all cattle are investigated for lesions or culture of M. bovis at confirmed HBD. The model 156
hierarchy was level 1 (animal) clustered by level 2 (the source herd) and by level 3 (the 157
restocked herd). For cattle born in the restocked herd, the restocked and source herds were 158
coded as the same herd. The variables listed above were tested in these multivariable models. 159
The goodness of fit of the model was assessed using the Hosmer-Lemeshow statistic (Dohoo, 160
2003). 161
162
3. Results 163
Of the 1500 herds tested twice by August 2004 after restocking, 1321 were negative on both 164
occasions. Out of 63 unconfirmed first tests, 59, 3 and 1 were negative, unconfirmed and 165
confirmed at the second test, respectively. Out of 50 confirmed tests at the first test 37, 7 and 166
9 herds with HBD at the first test, 17 (15%) also had a HBD at the second test (χ2= 19.7,
168
p<0.01); 13 of these 17 were confirmed HBD at the first test. 169
170
There were 230163, 9927 and 5970 cattle in herds that were test negative, unconfirmed and 171
confirmed at the second test, respectively, with 96 (0.1%) cattle test positive at unconfirmed 172
HBD and 228 (3.82%) cattle test positive at confirmed HBD (Table 1). Of the 96 reactors 173
from unconfirmed HBD, 70, 4 and 22 were from herds with negative, unconfirmed and 174
confirmed HBD at the first test, respectively. Of the 228 reactors from confirmed HBD, 191, 175
7 and 30 were from herds with negative, unconfirmed and confirmed HBD at the first test, 176
respectively. 177
178
The mean inter-test interval did not differ between herds that did not and did break down at 179
the first test (12.6 months vs. 12.4 months, Z=-0.45, p=0.66). Herds in high testing frequency 180
areas were tested at a slightly greater interval than herds in low testing frequency areas (13.2 181
months vs. 12.2 months, Z=1.679;p=0.11), but this difference was not statistically significant. 182
Because of the similarity of this time interval between all types of herd, this variable was not 183
included in further analyses. 184
185
Cattle purchased before the first test and still on the farm and tested at the second test had a 186
median age of 48 months, whereas cattle born after the first test had a median age of 6 187
months. Cattle born on the farm before the first test had a median age of 15 months and those 188
purchased after the first test had a median age of 19 months. There was no significant 189
difference in the mean age of cattle from high or low frequency testing herds and they had 190
10 In the univariable statistics (Table 1) cattle were at increased risk of being classified as a 192
reactor at both confirmed and unconfirmed tests with increasing age. In unconfirmed 193
breakdowns cattle were at reduced risk of being reactors if they were born on the tested farm 194
after the first test and at increased risk if purchased from a HFTH before the first test 195
compared with cattle purchased from LFTH before the first test. In addition, cattle were more 196
likely to be reactors if the restocked herd was HFTH and if the herd had a history of bTB 197
before 2001. In confirmed breakdowns there was an increased risk of cattle being reactors if 198
the source herd (including the restocked herd for cattle born on the farm) was HFTH and 199
cattle purchased or born after the first test were at reduced risk of being reactors compared 200
with cattle purchased or born before the first test. 201
202
The odds ratio (OR) is a magnitude of risk in comparison to a baseline e.g. the risk of an 203
animal being a reactor at an unconfirmed positive second test was 9.27 fold (95% confidence 204
intervals 1.74 – 49.44) if the previous herd test had been a confirmed test (Table 2). From 205
Table 1 we can see that 1.58% cattle were reactors at such a test compared with 0.87% cattle 206
that were in the baseline category (reactors at an unconfirmed test when the first test had been 207
negative) before adjusting for other effects. The confidence intervals indicate that it is 95% 208
likely that the true OR lies between 1.74 and 49.44. These wide confidence intervals indicate 209
large uncertainty in the likely true value of the OR. In this dataset the wide confidence 210
intervals are likely to occur because reactors were rare (324 / 246060 cattle were reactors) 211
and clustered by explanatory variable making some explanatory variables less robust in 212
determining the likely true value of the OR. 213
214
Once these variables were combined in the multivariable mixed model, the risks for cattle 215
11 restocked and source farms being HFTH and that the restocked farm had a history of bTB 217
before 2001 (Table 2). It can be seen from Table 1 that increasing age was an important crude 218
risk for an animal being a reactor, with the risk of reacting increasing dramatically with age 219
from 0.08% with 2 – 8% cattle above two years of age reacting to the test. In the final 220
multivariable model, after adjusting for other variables, the increasing risk with log age 221
equated to a doubling of risk of being a reactor in a HBD for cattle of 5 years of age versus 222
those of 6 months in both confirmed and unconfirmed tests. There was a reduced risk of 223
cattle reacting if they had been sourced from a LFTH after the first test. 224
225
The risks for cattle reacting in unconfirmed tests were increasing age, a confirmed HBD at 226
the first test, purchase from a LFTH after the first test compared with before the first test and 227
a history of bTB before 2001 on the restocked farm. The magnitude of the OR for age was 228
five times greater in cattle reacting at unconfirmed HBD than confirmed HBD. This result is 229
because the baseline risk for young cattle in unconfirmed tests was so low and the OR is 230
relative to the change in risk with increasing age. 231
232
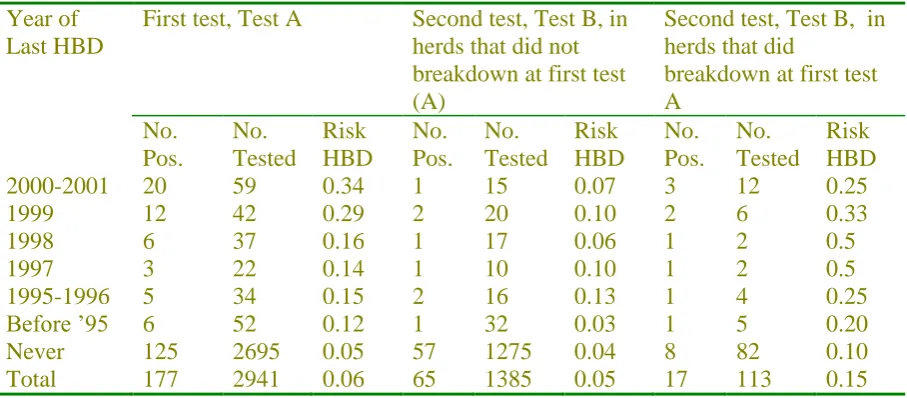
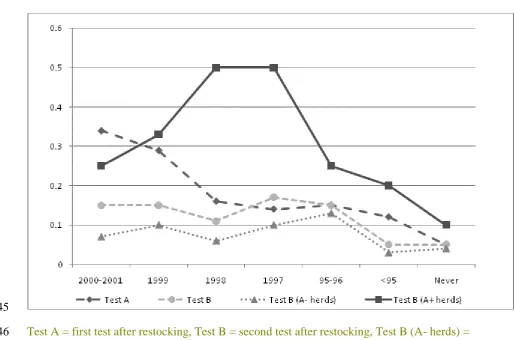
The probabilities of a HBD at the second test by HBD at the first test stratified by the last 233
year that that herd experienced a HBD before FMD (Table 3, Figure 1) were calculated. 234
There were small numbers in each category, especially for the herds that had a HBD at the 235
first and second tests. However, in contrast with the marked decay in risk with time since 236
previous HBD observed at the first test (Carrique-Mas et al., 2008), the risk of HBD at the 237
second test was independent from herd bTB history prior to FMD (compare dashed lines in 238
Figure 1). 239
12 4. Discussion
241
Destocking and restocking of herds during the 2001 foot and mouth epidemic in the UK 242
provided a natural experiment to study the risks of HBD with bTB. All the results from this 243
study come from a small amount of data, but these are all the data that we have from 244
restocked farms that arose from this rare event of depopulation and repopulation of 1500 245
herds. Using mixed effect models enables us to adjust for dependency of cattle within herds, 246
however, a limitation of these models, as with all discrete outcome models, is the 247
approximations used. We have estimated the risks for individual cattle being reactors at the 248
second test following restocking differentiating between cattle detected at confirmed and 249
unconfirmed HBD. Without distinguishing between confirmed and unconfirmed HBD the 250
results from the confirmed HBD dominate (results not shown). 251
252
Herd size is frequently reported as a significant risk for HBD, so it is interesting that this 253
variable was not significant in the multivariable models in the current study. Most analyses of 254
risk of HBD have concentrated on herds as the unit of study, which reflects the control 255
programme. However, individual cattle move between herds in the UK at a rate that means 256
herds are not self-contained units, and risks are carried between herds and distributed over 257
time. In a recent analysis of repeated HBD, Karolemeas et al. (2011) also did not report an 258
effect of herd size, suggesting that the multivariable models have explained the risks that are 259
correlated to herd size. 260
261
The inter-test interval did not vary between herds that had a HBD at the first test and those 262
that did not; this is most likely because the time from a HBD to removal of restrictions plus 263
13 had their second test approximately one year after their first test either because they were in a 265
one year testing area or because they had a further check test after purchasing more cattle. 266
267
There were few cattle that were reactors compared to the number tested in the current cohort 268
of farms. The risks identified in the current study might be less confounded than those from 269
studies where herds have been in continuous existence for many decades; no herd in this 270
study was older than 3 years, although some cattle were as old as 8 years. 271
272
The greatest risk for cattle reacting to the SICCT in the current study, whether at a confirmed 273
or unconfirmed HBD, was increasing age: there was a 9 - 45 fold odds of reacting with each 274
log10 increase in age in months. The high OR do indicate the dramatic increase in risk of 275
reacting with increasing age, with up to a 50 fold crude risk apparent from Table 1. Age is 276
likely to be a proxy measurement of the combined period of exposure to M. bovis and period 277
for development of positive skin reaction after exposure, as well as the number of tests 278
experienced. Since we were unable to disentangle these durations and events we retained age 279
in the analysis. Ideally age would be better explained as durations of exposure and latency to 280
the SICTT test. 281
282
In an unconfirmed HBD all reacting cattle are unconfirmed, that is they have no visible 283
lesions or cultures of M. bovis and so the standard interpretation of the SICCT (a skin 284
reaction of 5mm or more) is used. In the current study an unconfirmed HBD at the second 285
test was more likely to occur in herds that had had a confirmed HBD at the first test than in 286
herds that were negative at the first test. This might suggest that cattle which had been 287
infected for sufficiently long to develop lesions or to have reduced immune response to the 288
14 positive at the second test were more recently exposed. After adjusting for age, result of the 290
first test and herd history of bTB, cattle purchased from a low frequency testing herd were at 291
increased risk of reacting at this second test. There are several possible explanations for this; 292
one is that these cattle were naïve when they arrived on an infected farm and tested negative 293
at the first test but positive at the second test because of exposure that occurred whilst on the 294
farm, either after the first test or at sufficiently low dose that they tested negative at the first 295
test. Another explanation is that whilst low frequency testing herds are considered at lower 296
risk of having cattle exposed to bTB, some herds will be infected but undetected because they 297
have not been tested for some time because of the long intertest interval. However, cattle 298
from these herds pose a risk if moved in this untested interval (Green and Cornell 2005). 299
300
In contrast, there was no association between a confirmed second test and a confirmed first 301
test. Given that both confirmed and unconfirmed HBD were more likely in herds with a 302
history of bTB it does raise the possibility that herds cycle between confirmed and 303
unconfirmed HBD: raising the sensitivity by using severe interpretation removes more 304
infected cattle but is not sufficient to remove bTB from the herd and farm and so infection 305
recrudesces over time, initially with an unconfirmed HBD due to more recent exposure. The 306
unconfirmed HBD does not remove some infected cattle and these are then confirmed at a 307
subsequent HBD. 308
309
In addition, the risks of a confirmed test were different from the risks for an unconfirmed test. 310
However, we do not know which of the reactors at the second test were confirmed – some 311
cattle would have been unconfirmed and presumably have had risks similar to the reactors in 312
the unconfirmed HBD model. After adjusting for age, reacting cattle from a confirmed HBD 313
15 2) than cattle born or purchased after the first test. One explanation for their failure to be 315
detected at the first test is that they were exposed after the first test; another is that they were 316
exposed but missed by the test; 20 – 40% truly exposed cattle would be test negative 317
according to the test sensitivity. A third explanation is that these cattle would have been 318
tested at least once before and that they did react to the skin test but not sufficiently to be 319
reactors under less severe interpretation (Radunz and Lepper 1985), but such cattle were 320
classified as reactors because the test interpretation at the second, confirmed, test was severe. 321
All the other variables associated with cattle being reactors at a confirmed HBD were due to 322
likely persistence of bTB from restocked and source farms with a history of bTB and annual 323
or biennial testing. These patterns of risk for HBD were also reported by Ramirez – 324
Villaescusa et al. (2009). 325
326
In this discussion we have assumed that the animal test specificity is 100%, i.e. that all test 327
positive cattle were truly positive. Whilst with increasing numbers of cattle tested even a 328
specificity of slightly less than 100% would lead to some false positives this. However, this 329
appears a rare event: discussions on those modelling bTB conclude that if specificity was 330
much lower than 100% then there would be many more HBD (personal communication 331
Karolemeas). If all reactor cattle were truly infected, and if these cattle had been purchased 332
already infected, then 91 cattle from annual/biennial testing source herds that were reactors at 333
the second test should theoretically have been detected and removed at the first test. If the 334
sensitivity is 60-95% then the expected number of truly infected animals undetected at the 335
first test would be between approximately 5 and 36. Assuming the same sensitivity the 336
number of these animals detected at the second test would be between 5 and 28. There are 337
three possible explanations for many more animals (91) being detected at the second test. 338
16 changed between the two tests and third, the test has low sensitivity in the field and many 340
infected cattle were not detected at the first test. 341
342
These results are consistent with a less than perfect sensitivity of the test, which is a critical 343
limitation for the control of bTB in GB (Green and Medley, 2008) and elsewhere (de la Rua-344
Domenech et al., 2006). It is inevitable that some cattle purchased at restocking were infected 345
but tested negative at the first test, and it is possible that some of these were infectious and 346
contributed to the persistence of M. bovis in the herd. Another plausible explanation for the 347
failure to detect infection at the initial test after restocking would be a longer latent period 348
than previously estimated. The latent period comprises an ‘unresponsive’ or ‘anergic’ period, 349
followed by a ‘reactor period’; the skin test response only occurs in cattle in the reactor 350
period (Neill et al., 2001). The length of this period is not well established. Although Francis 351
(1947) estimated it at 30-50 days, it has been shown experimentally that the development of 352
skin reactivity depends heavily on the initial dose of M. bovis (Neill et al., 1991). In 353
experimental studies in which animals were inoculated with high doses of M. bovis (i.e. over 354
104 cfu) intra-nasally or via the tonsils there was development of skin reactivity within 10 355
weeks (Costello, 1998; Neill et al., 1988; Palmer et al., 2004). However, when cattle were 356
inoculated with low doses the progression to skin reactivity had not occurred by nine months 357
in some cattle, even though limited shedding and limited serological response was reported 358
(Costello, 1998; Neill et al., 1988). Studies with naïve and infected cattle housed together are 359
more likely to resemble natural infection where low-level exposure occurs over a longer 360
period. In one such study the skin reactivity of two of the four animals that tested positive 361
developed after one year (Costello, 1998). Additionally, the effect of continuous or multiple 362
exposures, and indeed multiple testing of cattle, is unknown. It is therefore highly likely that 363
17 develop a response after a long period of time. If these cattle are infectious they might have a 365
disproportionate effect on dissemination of infection. In Scotland, where pre- and post-366
purchase tests have been carried out on cattle imported from Ireland, more cattle have reacted 367
at the post-purchase test than at the pre-purchase test (Blissit, 2006). This also supports the 368
hypothesis that reactivity following natural exposure may develop over a long period of time, 369
at least several months. 370
371
As in previous studies, there was a strong correlation between the outcome of consecutive 372
bTB tests (Olea-Popelka et al., 2008; White and Benhin, 2004). In all cases a history of bTB 373
was the greatest single predictor of HBD at herd level. This was observed in all farms at both 374
the first and second test (Table 2). The time decay in the risk associated with a HBD before 375
FMD that was observed in restocked herds tested immediately after FMD (the first test) but 376
not by the second test does suggest that infection remains in the farm environment for a 377
limited period of time. The period without cattle allowed the decay in environmental risk to 378
be observed directly, and this has been reset by the change in status due to restocking. Had 379
the risk pattern with past HBD remained at the second test, it would have indicated that the 380
pattern was an artefact of the correlation between risk and testing frequency. Consequently, 381
we can conclude that the removal of cattle from these herds did reduce the local risk of HBD, 382
i.e. removing cattle did reduce the future risk of HBD for the farm. It also suggests that the 383
farm environment remains an infection risk for a period of time greater than the period for 384
which these farms were destocked (3 to 12 months). 385
386
In conclusion, it is likely that the SICCT test does not detect and eliminate infection in all 387
bTB positive herds in one HBD and that there is residual infection in the herd. This is 388
18 were restocked with cattle from unrestricted but previously bTB positive herds. The results 390
from this study and that from the first test after restocking (Carrique Mas et al., 2008) do 391
indicate that bTB is spreading into naïve herds in England as a result of introduction of cattle 392
from herds with a history of bTB. This is externally validated by other authors (Gilbert, 2005; 393
Gopal et al., 2006; Ramirez-Villaescusa et al., 2009; Reilly and Courtenay, 2007; Wolfe et 394
al., 2009). An important consequence of the results of this study and others is that farmers, 395
veterinarians and policy makers must appreciate the risks from purchasing cattle from herds 396
with a history of bTB, even if they have not recently had a HBD, versus known free from 397
bTB. This is a concern even when these cattle have passed a bTB skin test. This is 398
particularly important now that there is pre-movement testing for bTB because some farmers 399
believe that this means that tested cattle are definitely free from bTB (Enticott, 2009). A clear 400
method to prevent introduction of bTB into naïve herds is to prevent movement of cattle 401
previously exposed to bTB (Ramirez-Villaescusa et al., 2009) or with unknown history 402
(current paper). This requires that potential purchasers have reliable information about bTB 403
history of herds and individual cattle over many years so that they can make informed 404
decisions. 405
406
Acknowledgements 407
The authors thank Alan Aldridge at CTS and Andy Mitchell at VLA for supplying cattle 408
movement and bTB testing data respectively. This research was funded by DEFRA Project 409
Number SE3026. 410
411
References 412
19 Adams. L. G. 2001. In vivo and in vitro diagnosis of Mycobacterium bovis infection. Rev Sci 414
Tech; 20: 304-324. 415
Blissit, M. 2006. The introduction of pre and postmovement TB testing in Scotland for cattle 416
from high incidence TB areas. Government Veterinary Journal; 16: 58-64. 417
Carrique-Mas, J. J., Medley, G. F., Green, L. E. 2008. Risks for bovine tuberculosis in British 418
cattle farms restocked after the foot and mouth disease epidemic of 2001. Prev Vet Med 84: 419
85-93. 420
Carrique-Mass, J. J. 2007. Epidemiology of bovine tuberculosis in cattle herds in Great 421
Britain 2001 foot-and-mouth disease epidemic in Great Britain. Ph.D. Thesis University of 422
Warwick, 423
Clegg, T. A. Duignan, A. Whelan, C., Gormley, E., Good, M., Clarke, J., Toft, N., More, S. 424
J. 2011. Using latent class analysis to estimate the test characteristics of the gamma-425
interferon test, the single intradermal comparative tuberculin the first testnd a multiplex 426
immunoassay under Irish conditions. Vet Micro 151 68-76 427
Coad, M., Clifford, D., Rhodes, S. G., Hewinson, R. G., Vordermeier, H. M. and Whelan, 428
A.O. 2010. Repeat tuberculin skin testing leads to desensitisation in naturally infected 429
tuberculous cattle which is associated with elevated 10 and decreased interleukin-430
1 beta responses Vet. Res. 41:14 431
Costello, E., Doherty, M., Monaghan, M., Quigley, F., O'Reilly, P. 1998. A study of cattle-to-432
cattle transmission of Mycobacterium bovis infection. Vet J 155: 245-250. 433
Costello, E., Egan, J. W., Quigley, F. C., O'Reilly, P. F. 1997. Performance of the single 434
intradermal comparative tuberculin test in identifying cattle with tuberculous lesions in Irish 435
herds. Vet Rec 141: 222-224. 436
Courtenay. O., Reilly, L., Sweeney, F., Hibberd, V., Bryan, S., Ul-Hassan, A., Newman, C., 437
20 environment important for the persistence of bovine tuberculosis? Biology Letters 2: 460 - 439
462. 440
Davies, G. 2002. The foot and mouth disease (FMD) epidemic in the United Kingdom 2001. 441
Comp Immunol Microbiol Infect Dis 25: 331-343. 442
Dohoo, I. R., Martyn, S. W., Stryn, H. 2003. Veterinary Epidemiologic Research. Avc Inc, 443
Charlottetown. 444
de la Rua-Domenech R, Goodchild AT, Vordermeier HM, Hewinson RG, Christiansen KH, 445
Clifton-Hadley RS (2006) Ante mortem diagnosis of tuberculosis in cattle: a review of the 446
tuberculin tests, gamma-interferon assay and other ancillary diagnostic techniques. Res Vet 447
Sci 81: 190–210 448
Donnelly, C. A., Woodroffe, R., Cox, D. R., Bourne, F. J., Cheeseman, C. L., Clifton-Hadley, 449
R. S., Wei, G., Gettinby, G., Gilks, P., Jenkins, H., Johnston, W. T., Le Fevre, A. M., 450
McInerney, J. P., Morrison, W. I. 2006. Positive and negative effects of widespread badger 451
culling on tuberculosis in cattle. Nature 439, 843-846. 452
Enticott, G. Franklin, A. 2009. Biosecurity, Expertise and the Institutional Void: The Case of 453
Bovine Tuberculosis. Sociologia Ruralis 49: 375-93 454
Francis J. 1947. Bovine tuberculosis, including a contrast with human tuberculosis. Staples 455
Press Ltd, London. 456
Gilbert, M., Mitchell, A., Bourn, D., Mawdsley, J., Clifton-Hadley, R., Wint, W. 2005. Cattle 457
movements and bovine tuberculosis in Great Britain. Nature 435: 491-496. 458
Goldstein, H. 2003. Multilevel statistical models.. Third Edition. Arnold, London. 459
Goodchild, A.V., Clifton-Hadley, R.S. 2001. Cattle-to-cattle transmission of Mycobacterium 460
21 Gopal, R., Goodchild, A., Hewinson, G., de la Rua Domenech, R., Clifton-Hadley, R.
462
2006Introduction of bovine tuberculosis to north-east England by bought-in cattle. Vet Rec 463
159: 265-271. 464
Green, D. M., Kiss, I. Z., Mitchell, A. P., Kao, R. R. 2008. Estimates for local and 465
movement-based transmission of bovine tuberculosis in British cattle. Proc Biol Sci 275: 466
1001-1005. 467
Green, L. E., Cornell, S. J. 2005. Investigations of cattle herd breakdowns with bovine 468
tuberculosis in four counties of England and Wales using VetNet data. Prev Vet Med. 70: 469
293-311. 470
Green, L.E., Medley, G.F. 2008. Cattle to cattle transmission of bovine tuberculosis: Risk 471
factors and dynamics. Cattle Practice 8: 116-121. 472
Griffin, J. M., Williams, D. H., Kelly, G. E.. Clegg, T. A., O’Boyle, I. Collins, J.D., More S.J. 473
2005. The impact of badger removal on the control of tuberculosis in cattle herds in Ireland. 474
Prev Vet Med; 67: 237-266. 475
Johnston WT, Vial F, Gettinby G, Bourne FJ, Clifton-Hadley RS, Cox DR, Crea P, Donnelly 476
CA, McInerney JP, Mitchell AP, Morrison WI, Woodroffe R. 2011. Herd-level risk factors of 477
bovine tuberculosis in England and Wales after the 2001 foot-and-mouth disease epidemic. 478
Int J Infect Dis. (in the press). [Epub ahead of print] 479
http://dx.doi.org/10.1016/j.ijid.2011.08.004
480
Karolemeas, K., McKinley, T.J., Clifton-Hadley, R.S., Goodchild, A.V., Mitchell, A., 481
Johnston, W.T., Conlan, A.J.K, Donnelly, C.A., Wood, J.L.N., 2011. Recurrence of bovine 482
tuberculosis breakdowns in Great Britain: Risk factors and prediction, Preventive Veterinary 483
Medicine, Volume 102, Issue 1, 1 October 2011, Pages 22-29, ISSN 0167-5877, 484
22 Mitchell, A., Bourn, D., Mawdsley, J. Wint, W. Clifton-Hadley, R. and Gilbert, M. 2005. 486
Characteristics of cattle movements in Britain - an analysis of records from the Cattle Tracing 487
System. Animal Science; 80: 1-9. 488
Monaghan, M. L., Doherty, M. L., Collins, J. D., Kazda, J. F., Quinn, P. J. 1994. The 489
tuberculin test. Vet Microbiol; 40: 111-124. 490
Neill, S. D., Bryson, D. G., Pollock, J. M. 2001. Pathogenesis of tuberculosis in cattle. 491
Tuberculosis (Edinb) 81: 79-86. 492
Neill, S.D., Hanna, J., O’Brien, J.J., McCracken, R.M. 1988 Excretion of Mycobacterium 493
bovis by experimentally infected cattle. Veterinary Record 123, 340–343. 494
Neill, S. D., O'Brien, J. J., Hanna, J. 1991A mathematical model for Mycobacterium bovis 495
excretion from tuberculous cattle. Vet Microbiol; 28: 103-109. 496
Olea-Popelka, F.J. Costello, E. White, P. McGrath, G. Collins, J.D. O’Keeffe, J.. Kelton, D.F 497
Berke, O. More, S. Martin S.W. 2008. Risk factors for disclosure of additional tuberculous 498
cattle in attested-clear herds that had one animal with a confirmed lesion of tuberculosis at 499
slaughter during 2003 in Ireland. Prev Vet Med; 85: 81-91. 500
Palmer, M. V., Waters, W. R., Whipple, D. L. 2004. Investigation of the transmission of 501
Mycobacterium bovis from deer to cattle through indirect contact. Am J Vet Res; 65: 1483-502
1489. 503
Radunz, B.L., Lepper, A.W.D., 1985. Suppression of reactivity to tuberculin in repeat tests. 504
Aust. Vet. J. 62,191 - 194 505
Ramirez-Villaescusa A, Medley, G. F., Green, L. E. 2009. Herd and individual animal risks 506
associated with skin test positivity in herds in south west England. Prev. Vet. Med.; 92:188-507
23 Reilly LA, Courtenay O. 2007. Husbandry practices, badger sett density and habitat
509
composition as risk factors for transient and persistent bovine tuberculosis on UK cattle 510
farms. Prev Vet Med 80: 129-142. 511
White, P. C., Benhin, J.K. 2004. Factors influencing the incidence and scale of bovine 512
tuberculosis in cattle in southwest England. Prev Vet Med 2004; 63: 1-7. 513
Wolfe, D.M.. Berke, O More, S.J. Kelton, D.F., White, P.W.. O’Keeffe J.J, Martin S.W. 514
2009. The risk of a positive test for bovine tuberculosis in cattle purchased from herds with 515
and without a recent history of bovine tuberculosis in Ireland. Prev. Vet. Med. 92: 99-105. 516
24
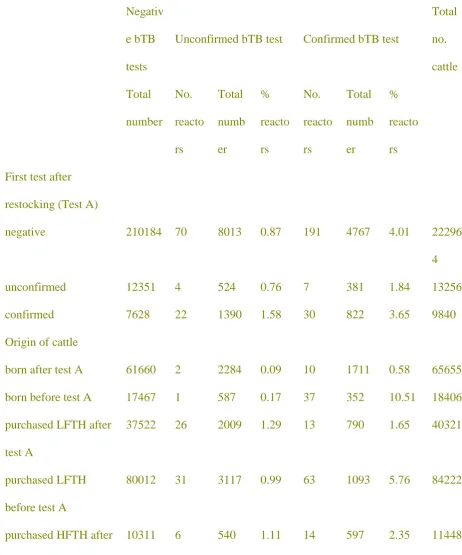
Table 1. Number and percent of 246060 cattle from 1500 herds that were reactors and non
519
reactors by test type negative, unconfirmed and confirmed at the herd’s second bovine
520
tuberculosis test in England, 2002-2004 (Test B) by explanatory variables
521
Explanatory variables Cattle at Test B
Negativ
e bTB
tests
Unconfirmed bTB test Confirmed bTB test
Total
no.
cattle
Total
number No.
reacto
rs
Total
numb
er
%
reacto
rs
No.
reacto
rs
Total
numb
er
%
reacto
rs
First test after
restocking (Test A)
negative 210184 70 8013 0.87 191 4767 4.01 22296
4
unconfirmed 12351 4 524 0.76 7 381 1.84 13256
confirmed 7628 22 1390 1.58 30 822 3.65 9840
Origin of cattle
born after test A 61660 2 2284 0.09 10 1711 0.58 65655
born before test A 17467 1 587 0.17 37 352 10.51 18406
purchased LFTH after
test A
37522 26 2009 1.29 13 790 1.65 40321
purchased LFTH
before test A
80012 31 3117 0.99 63 1093 5.76 84222
purchased HFTH after
test A
25
purchased HFTH
before test A
23191 30 1390 2.16 91 1427 6.38 26008
History of bTB before
FMD
unknown 8229 2 418 0.48 22 196 11.22 8843
no 196308 64 8159 0.78 118 4035 2.92 20850
2
yes 25626 30 1350 2.22 88 1739 5.06 28715
HFT restocked herd
no 189347 65 7800 0.83 146 3036 4.81 20018
3
yes 40816 31 2127 1.46 82 2934 2.79 45877
HFT source herd
unknown 3138 2 103 0.19 20 101 19.80 3342
no 179227 56 7319 0.08 87 2852 3.05 18939
8
yes 47798 38 2505 0.15 121 3017 4.01 53320
Age in years (20548
unknown)
>1 72631 2 2507 0.08 10 1852 0.54 76990
2 47747 7 2317 0.30 29 1277 2.27 51341
3 22009 10 1211 0.83 34 519 6.55 23739
4 24132 15 1156 1.30 38 688 5.52 25976
5 21456 17 838 2.03 21 578 3.63 22872
26
7+ 8082 17 464 3.66 13 323 4.02 8869
Total 230163 96 9927 228 5970 3.82 24606
0
No. = number, % = percent, Test A = first test after restocking, Test B = second herd test
522
after restocking, bTB = bovine tuberculosis, LFTH = low frequency tested herd, HFTH =
523
high frequency tested herd, FMD = destocked because of the 2001 epidemic of foot and
524
mouth disease
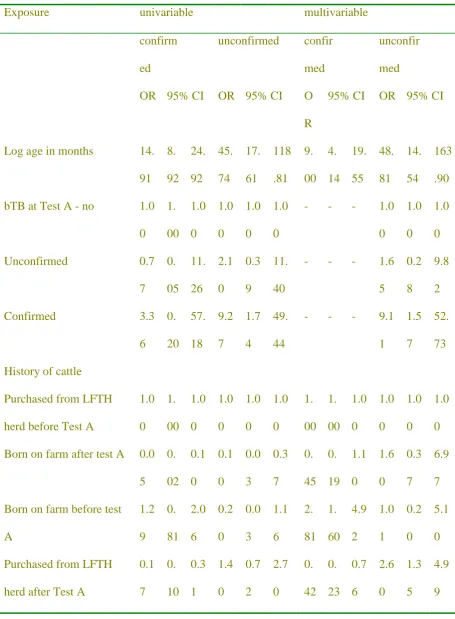
27 Table 2. Univariable and multivariable odds ratios and 95% confidence intervals for risks for 527
bovine tuberculosis at the second herd test for 228 confirmed reactors and 96 unconfirmed 528
reactors out of 246060 cattle from 1500 herds in England, 2002-2004 529
Exposure univariable multivariable
confirm
ed
unconfirmed confir
med
unconfir
med
OR 95% CI OR 95% CI O
R
95% CI OR 95% CI
Log age in months 14.
91 8. 92 24. 92 45. 74 17. 61 118 .81 9. 00 4. 14 19. 55 48. 81 14. 54 163 .90
bTB at Test A - no 1.0
0 1. 00 1.0 0 1.0 0 1.0 0 1.0 0
- - - 1.0
0 1.0
0
1.0
0
Unconfirmed 0.7
7 0. 05 11. 26 2.1 0 0.3 9 11. 40
- - - 1.6
5 0.2
8
9.8
2
Confirmed 3.3
6 0. 20 57. 18 9.2 7 1.7 4 49. 44
- - - 9.1
1 1.5
7
52.
73
History of cattle
Purchased from LFTH
herd before Test A
1.0 0 1. 00 1.0 0 1.0 0 1.0 0 1.0 0 1. 00 1. 00 1.0 0 1.0 0 1.0 0 1.0 0
Born on farm after test A 0.0
5 0. 02 0.1 0 0.1 0 0.0 3 0.3 7 0. 45 0. 19 1.1 0 1.6 0 0.3 7 6.9 7
Born on farm before test
A 1.2 9 0. 81 2.0 6 0.2 0 0.0 3 1.1 6 2. 81 1. 60 4.9 2 1.0 1 0.2 0 5.1 0
Purchased from LFTH
herd after Test A
28
Purchased from HFTH
herd after Test A
0.2 3 0. 09 0.5 9 0.9 9 1.1 8 0.8 4 1. 83 0. 84 3.9 7 0.9 1 0.3 1 2.6 4
Purchased from HFTH
before Test A
1.0 3 0. 64 1.6 8 4.1 3 2.0 4 8.3 7 0. 89 0. 57 1.3 8 1.7 5 0.8 6 3.5 9
Restocked farm is in
HFTH - no
1.0 0 1. 00 1.0 0 1.0 0 1.0 0 1.0 0 1. 00 1. 00 1.0 0 - - -
Restocked farm is in
HFTH –yes 4.0 1 0. 93 17. 32 2.7 8 1.0 7 7.2 7 5. 79 1. 49 22. 47 - - -
History bTB in restocked
herd – no
1.0 0 1. 00 1.0 0 1.0 0 1.0 0 1.0 0 1. 00 1. 00 1.0 0 1.0 0 1.0 0 1.0 0
History bTB in restocked
herd –yes 1.9 1 0. 97 3.7 8 2.8 3 1.3 0 6.2 0 1. 57 1. 04 2.3 7 3.4 5 1.8 1 6.5 9
Source farm is in HFTH
–no 1.0 0 1. 00 1.0 0 1.0 0 1.0 0 1.0 0 1. 00 1. 00 1.0 0 - - -
Source farm is in HFTH
–yes 1.8 3 1. 03 3.2 6 1.9 6 0.9 7 3.9 8 5. 73 1. 53 21. 41 - - - 530
bTB = bovine tuberculosis, Test A = first herd test after restocking, Test B = second herd test
531
after restocking, LFTH = low frequency tested herd, HFTH = high frequency tested herd, - =
532
not significant in multivariable model, 1.00 = baseline risk
29 Table 3. Risk of herd breakdown (HBD) with bovine tuberculosis at first (Test A) and second 536
(Test B) herd tests after restocking by time since last HBD before destocking because of foot 537
and mouth disease in 2001 in 1500 herds in England, 2002-2004 538
Year of Last HBD
First test, Test A Second test, Test B, in
herds that did not breakdown at first test (A)
Second test, Test B, in herds that did
breakdown at first test A
No. Pos.
No. Tested
Risk HBD
No. Pos.
No. Tested
Risk HBD
No. Pos.
No. Tested
Risk HBD
2000-2001 20 59 0.34 1 15 0.07 3 12 0.25
1999 12 42 0.29 2 20 0.10 2 6 0.33
1998 6 37 0.16 1 17 0.06 1 2 0.5
1997 3 22 0.14 1 10 0.10 1 2 0.5
1995-1996 5 34 0.15 2 16 0.13 1 4 0.25
Before ’95 6 52 0.12 1 32 0.03 1 5 0.20
Never 125 2695 0.05 57 1275 0.04 8 82 0.10
Total 177 2941 0.06 65 1385 0.05 17 113 0.15
HBD = herd breakdown, No. = number of herds, Pos.= Positive
30
Figure 1. Risk of herd breakdown with bovine tuberculosis since last herd breakdown by first
543
and second bTB tests after restocking in 1500 herds England, 2002-2004
544
545
Test A = first test after restocking, Test B = second test after restocking, Test B (A- herds) =
546
Test B result for herds that did not breakdown and Test A, Test B (A+ herds) = herds that
547
were tested at B that had had a herd breakdown at Test A.
methyl}piperidin 1 ium trichloroacetate: crystal structure and Hirshfeld surface analysis](data:image/gif;base64,R0lGODlhAQABAIAAAP///wAAACH5BAEAAAAALAAAAAABAAEAAAICRAEAOw==)