1
How Much Influence Does the Chinese State have
over CEOs and Their Compensation?
Alex Bryson, John Forth and Minghai Zhou1
Abstract
All that we know about the CEO labour market in China comes from studies of public listed companies and State-owned enterprises (SOEs). This paper is the first to examine the operation of the CEO labour market across all industrial sectors of the Chinese economy. We find that the influence of the State extends beyond SOEs into many privately-owned firms. Government is often involved in CEO appointments in domestic firms and, when this is the case, the CEO has less job autonomy and is less likely to have pay linked to firm performance. Nevertheless, we find that incentive schemes are commonplace and include contracts linking CEO pay directly to firm performance, annual bonus schemes, the posting of performance bonds, and holding company stock. The elasticity of pay with respect to company performance is one or more in two-fifths of the cases where CEOs have performance contracts, suggesting many face high-powered incentives. We also show that State-owned and domestic privately-owned firms are more likely than foreign-owned firms to use incentive contracts.
JEL Classification: G34; J31; J33; M12; M52; O16; P31
Key words: executive compensation; job autonomy; CEO's; China; the State Acknowledgements
We thank the ESRC (grant RES-538-25-0029) and the NSFC (grant 71161130175) for funding. We thank seminar participants at the Center for Labor Economics and Public Policy (LEPP), Zhejiang University, for comments on an earlier version of this paper.
1. Introduction
In the last few decades a huge privatisation programme has reduced State ownership of enterprises in China (Xu, 2011). Nevertheless, the State continues to play a pivotal role in the corporate sector through its ownership of firms and in appointing Chief Executive Officers (CEOs). Little is known about State influence within corporations since the economic reform programme began. This paper focuses on three issues, namely the influence the State has on the appointment of CEOs, the way CEOs are paid and how much decision-making autonomy CEOs have. To date evidence has been confined to the role State ownership plays in determining CEO compensation in large State-owned Enterprises (SOEs) (Mengistae and Xu, 2004) and public listed firms (Bryson et al., 2014). In this paper we extend the analysis to the executive labour market and CEO compensation across the whole industrial sector in China. We do so with World Bank Enterprise Data from surveys conducted in 2003 and 2005, two decades after the initial market-inspired reforms and a phenomenal period of economic growth.2 We consider the role played by the State in CEO appointments and the autonomy CEOs have over decisions relating to production, investment and employment. Then we consider whether State involvement in corporations affects the way CEOs are paid, focusing primarily on the incidence and correlates of various aspects of CEO incentives.
We find the State is often involved in the appointment of CEOs and that, where the corporation is State-owned, CEOs have far less decision-making autonomy. Incentive schemes are commonplace and include contracts linking CEO pay directly to firm performance, annual bonus schemes, the posting of performance bonds, and holding company stock. The elasticity of pay with respect to company performance is one or more in two-fifths of the cases where CEO's have performance contracts, suggesting many face high-powered incentives. We show foreign-owned firms are less likely than State-owned and domestic, privately-owned firms to use incentive contracts. However, where government is involved in the CEO's appointment in a domestic, privately-owned firm, the CEO has less job autonomy and is less likely to have pay linked to firm performance.
In Section Two we consider the role of the State in China's corporations and the possible implications for CEOs. Section Three analyses the links between State involvement in corporations and CEO's autonomy in making decisions. Section Four examines the degree to which CEOs in China are exposed to incentive contracts. Section Five estimates influences of CEO incentive contracts, focusing again on State ownership and State involvement in the appointment of CEOs before we discuss the results and conclude in Section Six.
2. The Role of the State in China's Corporations and Its Implications for CEOs The standard principal-agent problem described in the CEO compensation literature assumes CEOs are recruited to maximise shareholder value by raising the profitability of the firm but that, in the absence of perfect monitoring, CEOs may invest time in improving their own future career prospects, perhaps to the detriment of the firm (Holmström and Milgrom, 1991). Shareholders therefore use incentive mechanisms and the threat of dismissal to hold CEOs accountable.3
The Chinese setting is different because the State and economic activity are inextricably linked in China. The State exerts direct influence over corporations as the owner (principal). For example, despite divesting itself of many previously State-owned enterprises and reducing its stake in publicly listed firms in recent decades, the State continued to have a majority stake in over two-fifths of publicly listed firms in 2010, and these accounted for three-quarters of the employment in the sector and four-fifths of its output (Bryson et al., 2014). State ownership is also common in the economy as a whole. According to the World Bank 2003 Enterprise Survey, the mean State ownership stake in enterprises was 22%, ranging from 63% in the one-third of organizations which were SOEs, a 20% stake in public listed firms, one-sixth State ownership in cooperatives, and near-zero involvement in privately held firms. Twenty-one percent of corporations were majority State-owned, 12% were majority foreign-owned, and the remainder were majority domestically-owned.
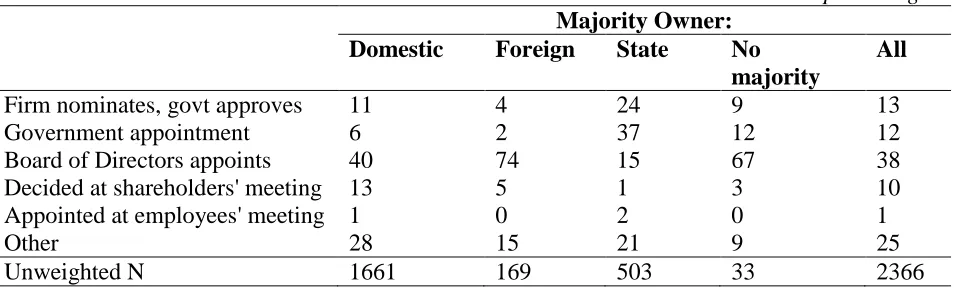
The State's influence extends beyond ownership to the appointment or endorsement of CEOs. In 2003 the State had direct influence over who was appointed to the CEO position in a quarter of all firms, directly appointing them in 12% of cases and rubber-stamping the firm's nominee in another 13% (Table 1). The role of the State was most prominent in firms that were majority State-owned with government directly appointing over one-third of CEOs and rubber-stamping firm nominees in another one-quarter of cases. In domestic and foreign firms, it was the Board of Directors that usually made appointments. But State involvement was not uncommon even in these firms. A similar picture emerges from the 2005 survey: CEOs were State appointments in around one-tenth (12%) of all firms, ranging from 48% in SOEs to only 2% in foreign-owned firms.
[INSERT TABLE 1]
China remains a one-party State governed by the Communist Party. Cao et al. (2012) showed that the political system offers strong career incentives to CEOs which may compensate for monetary incentives. We are able to glimpse the role that political advancement might play in the CEO labour market in China in Table 2 which shows the Communist Party membership of CEOs in 2003. Two-thirds of all CEOs were Party members. The figure varies markedly by ownership status: over nine-in-ten CEOs of SOEs are Party members, compared to two-thirds of those in private domestic firms and only one-quarter of those in the foreign-owned sector.4 Furthermore, many CEOs hold senior positions in the Party, with around one-quarter holding the post of Party Secretary.
[INSERT TABLE 2]
Although this evidence points to an important role for the State in corporate affairs, this does not necessarily mean that politically motivated CEOs operate simply as
"bureaucrats" with few incentives and little autonomy. This is because political preferment often depends on CEOs demonstrating business success (Xu, 2011). As early as the 1980s a market for corporate executives started to emerge as a result of government initiatives to reform SOEs. Prompted by career incentives to enhance the productivity and performance of SOEs, local government officials opened up competition for CEO posts in SOEs through auctions for managerial contracts (Xu, 2011). These contracts offered CEOs greater autonomy in corporate decision-making and replaced direct control from above with managerial incentives (Groves, 1995: 874), a process which received a further fillip with the programme of privatisation which began in the 1980s.
In the remainder of this paper we consider what difference State ownership and influence makes to the role CEOs play and how they are compensated. If State ownership leads to CEO "bureaucrats" we would expect to see a negative association between State involvement and CEO job autonomy and a negative association between State involvement and the use of incentive contracts. On the other hand, if the reforming ethos of the 1980s has persisted, one might anticipate quite the reverse.
3. State Involvement in Corporations and CEO Autonomy
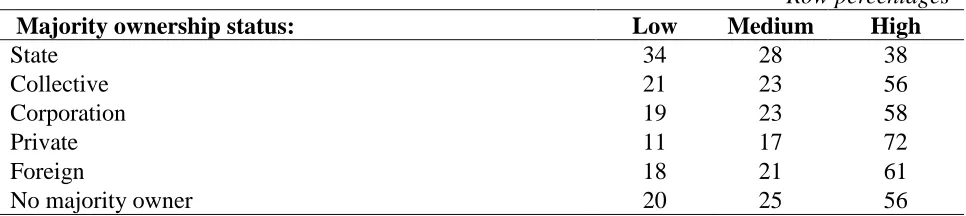
If China's CEOs were simply bureaucrats, paid to perform tasks required by the State, one might expect their behaviours to be governed by procedures laid down by the State, in which case they would have little of the operational autonomy which one normally associates with the position of CEO. The 2005 survey asks what degree of autonomy CEOs have over decisions relating to production, investment and employment, defining autonomy as non-intervention by government. As Table 3 indicates, CEOs generally have a high degree of autonomy over operational decision-making which means that firms' owners will be concerned to align CEO interests with those of the firm, whether it be through political preferment, financial incentives, or via the threat of dismissal. Six-in-ten (61%) CEOs score the maximum autonomy score.5 However, there is heterogeneity
across firms both within and across ownership-type. CEOs in SOEs tend to have lower autonomy than those in other firms, with those in the private domestic sector having significantly more autonomy than others.6
[INSERT TABLE 3]
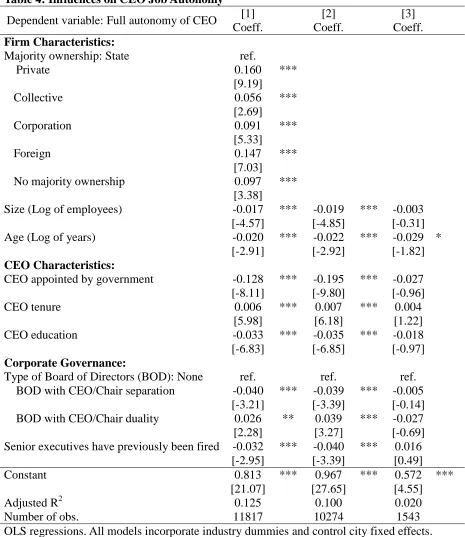
To see whether this relationship is a robust association that is independent of other firm and CEO characteristics, we ran linear estimation models for the probability of a CEO having "full autonomy" on the additive scale shown in Table 3, which combines autonomy on three dimensions of decision-making (production, investment and employment). These models are city fixed-effects models, allowing us to compare firms within the same city. There is a strong negative association between majority State ownership of the firm and CEO autonomy (Table 4, column 1). The State ownership effect is quantitatively large and statistically significant relative to all other forms of ownership. Furthermore, if the CEO was appointed by government this is associated with even lower CEO autonomy: a CEO is 13 per cent less likely to have "full autonomy" if appointed by government, ceteris paribus. However, the effect is confined to firms that are not State-owned (Table 4, columns 2 and 3).
If one focuses on each component of autonomy the differential between State ownership and other forms of ownership tends to be statistically significant throughout but the effects are largest with respect to decisions over investment and are least pronounced with respect to production issues.7 The same pattern is apparent with respect to the association with government appointment.
It is therefore clearly the case that State involvement in corporations, whether through ownership or through the appointments process, is associated with CEO's having more limited decision-making autonomy.
6 We get similar results using the 2003 survey.
[INSERT TABLE 4]
4. Is CEO compensation linked to firm performance and if so, how?
The suspicion that the State appoints "bureaucrats" to CEO positions, together with a common assumption that political advancement is the preferred career path for many CEOs in China, suggests State-owned firms may be less likely than other firms to resort to incentive pay to resolve principal-agent problems. On the other hand, the State has a strong track record in experimenting with incentive structures in SOEs (Xu, 2011) and, more recently, in paving the way for the use of stock options and other incentive mechanisms in the publicly listed sector (Bryson et al., 2014).
[INSERT TABLE 5]
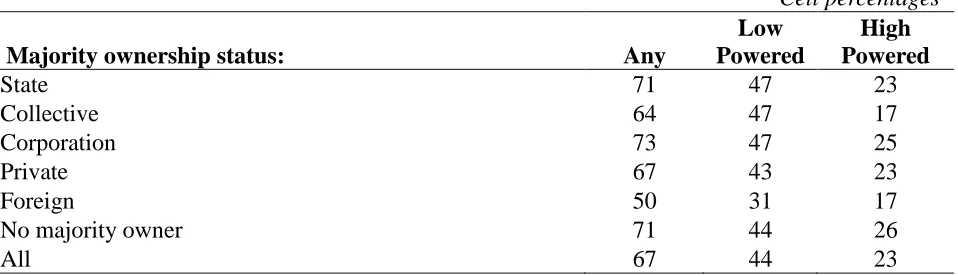
The 2005 survey indicates that two-thirds (67%) of firms linked their CEO's annual income directly to the company's performance (Table 5). What is more, in one-quarter (23%) of firms, these were "high powered" incentives in the sense that more than 10% of the CEO's annual income depended on whether or not the company's performance met the agreed target. Incentive contracts were common across all ownership types, though they were less common in foreign-owned firms than elsewhere.
[INSERT TABLE 6]
The 2003 survey contains more detail on the means by which firms can link CEO compensation to firm performance (Table 6). It distinguishes between being on an incentive plan which links CEO income to performance (what we term an incentive contract); receipt of a wage paid annually which, under the Chinese system, is a method of paying annual bonuses; and the payment of an upfront bond by the CEO which is recovered if the CEO meets the performance targets set under the contract.8 One-quarter (28%) of CEOs in the survey were on incentive contracts. In most cases annual income was linked to performance measured in terms of both profits and sales.
One-fifth (19%) of CEOs were on annual pay contracts, and 11% paid a performance bond. Taken together, two-fifths (42%) of CEOs had their pay subject to performance based on at least one of these mechanisms and 15% were subject to more than one of these links between income and performance. These figures are lower than the incentive contract incidence in the 2005 survey due in part to differences between the two samples and the survey questions9, but the 2003 survey confirms that the incidence of incentive-based contracts for CEOs was lowest in foreign owned firms.
Incentives are often high powered. The median elasticity of pay with respect to company performance was 1.10 The performance bonds paid by CEOs often constituted a sizeable proportion of their total annual income (Bryson et al., forthcoming).
The 2003 survey also asked whether CEOs held company stock, another potentially important way in which CEOs' performance can affect their wealth. Almost a third (30%) of CEOs held stock (Table 6, row 6). In 13% of domestically owned private firms the CEO actually held a majority stake in the firm as owner-manager.
The four incentive mechanisms identified in the 2003 survey are positively and significantly correlated, suggesting that they may complement one another, rather than operate as substitutes.11
This section clearly demonstrates that incentive payments are widespread among CEOs in China, that they take a variety of forms but appear complementary to one another, and that the link between pay and performance is quite substantial.
9
For example, average firm size is lower in the 2003 survey.
10 Respondents were asked how much the CEO's income would increase if the performance measure increased by 1%. They were asked this for the first and second most important measures of performance used to make the decision. They were also asked the same question in relation to decreases in performance. Thus there are four questions asked. In each case the median elasticity of pay to performance was 1.0. 11 The correlation coefficients for a CEO incentive contract and other incentive mechanisms are all statistically significant at a 99% confidence level and are: annual pay contract (bonuses) 0.29; performance bond 0.16; holds company stock 0.09. The correlation coefficients for annual pay contract and a
5. The State's Influence on CEO compensation
The overall impression from the two surveys is that incentive contracts were widely used to link CEO income to company performance in the mid 2000s and that, in many instances, these were high powered incentives which placed a sizeable percentage of CEO income at stake. However, there is quite a bit of variance in their usage, as is clear from the cross-tabulations with ownership. In this section we seek to isolate the association between CEO incentive contracts and the role of the State in corporations using multivariate analyses. In doing so, we control for other firm characteristics (such as size, industry and location), the firm's corporate governance arrangements, other policies used by the firm such as the threat of dismissal, and the characteristics of the CEO.
Models therefore take the following form:
1) Compifc xCGf yIndi zXf CITYcfi
where Compifc is a dummy identifying contracts linking pay to performance for CEO i in firm f in city c; CGf is a vector of corporate governance variables in firm f, including whether the CEO was a government appointee; Indi are individual CEO demographic and job attributes; Xf are structural firm attributes which include the majority owner of the firm; CITYc are the city fixed effects; epsilon is the error term and the betas are coefficients to be estimated. In practice, the absence of panel data means that we observe only one CEO per firm and so the i and f are non-separable.
contract, namely: a simple dummy identifying whether the CEO has a contract linking pay to firm performance; a dummy variable identifying any of the three incentive forms of contract (a link to performance; an annual bonus; and a performance bond); and finally a count of up to three identifying the number of types of incentive mechanism to which the CEO is subject.
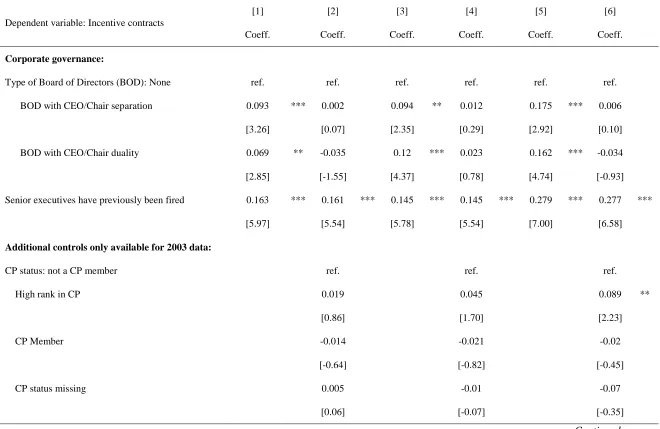
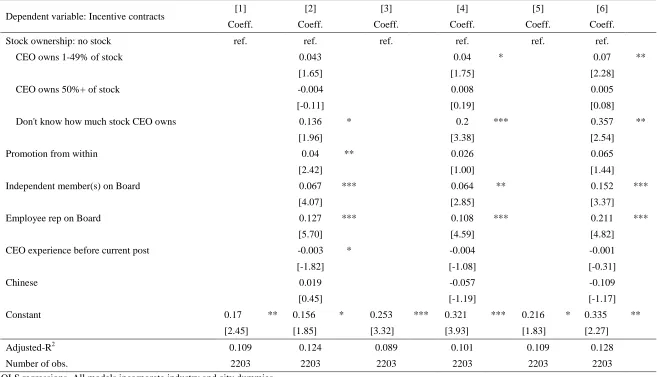
Table 7 presents the factors associated with CEO incentive contracts in 2005. Table 8 then presents six models using the 2003 survey data. Columns 1, 3 and 5 in Table 8 are model specifications similar to those for Column 1 in Table 7 but for each of the three alternative incentive contract measures in turn (paid via a contract linking pay to performance, any of the three types identified, and the count of the three types of incentive contract). Columns 2, 4 and 6 run the same models but include additional controls that are only available in the 2003 data. The models explain between 7 and 13 per cent of the variance in incentive contracts, depending on the model specification and dependent variable.
[INSERT TABLE 7]
We focus the discussion on firm ownership, the role government plays in appointing CEOs, and Communist Party membership of the CEO. But we also briefly discuss the links between performance pay and CEO autonomous decision-making.12
In the 2005 analyses, when ownership and a dummy for government involvement in CEO appointments are entered alone (not shown in the table), without controls, majority state ownership is associated with a higher probability of a CEO being paid under an incentive contract than those in other firms. However, the only difference that is robust to the inclusion of controls is that between state-ownership and foreign ownership: foreign
owned firms are significantly less likely to use incentive contracts for CEOs (column 1).13 The 20 percentage point differential is large. However, government involvement in the appointment of the CEO is negatively associated with the use of CEO incentive contracts. When splitting the sample into firms where the state holds a majority stake and those where it does not, it is apparent that the role of government in appointments is only significant where the firm is majority-owned by government (columns 2 and 3).
From a principal-agent perspective it makes sense to incentivise CEO’s via a performance pay contract if the CEO has sufficient autonomy to make meaningful operational decisions affecting the firm’s fortunes. Both surveys distinguish between CEO’s autonomy over decision-making in three domains: production, employment and investment. In the 2005 survey the likelihood of employing a CEO on an incentive contract rises with autonomy over production matters, but falls where the CEO has greater autonomy over investment decisions, while autonomy over employment-related matters (hiring, firing and wages) is not significantly associated with incentive contracts. These findings seem to hold in both the state-owned and non-state owned sectors (columns 2 and 3). This negative association between incentive contracts and investment autonomy makes intuitive sense since principals may be concerned that a CEO’s judgement regarding the appropriateness of an investment decision may be clouded by any direct personal interest in the impact of that decision. For example, CEO’s may choose to forego investment opportunities in the short-run, even if they are in the best interests of the firm, if making the investment negatively affects the short-term company performance metrics used in an incentive contract to reward CEO’s.
[INSERT TABLE 8]
In Table 8 we turn to similar analyses for the 2003 survey. The negative significant association between incentive contracts and foreign ownership is also apparent in the 2003 data regardless of model specification and across the three incentive contract
measures (Table 8). There is also a negative association between the use of CEO incentive contracts and the appointment of the CEO by government, one that is statistically significant in four of the six models. This is consistent with the possibility that government may have a direct interest in appointing more “bureaucratic” CEOs capable of achieving political and social objectives, rather than CEO’s intent on maximising firm performance.
We see further influence of government influence in the corporate sector in terms of the link between Communist Party membership and CEO status. There is a positive and significant correlation between being a Party Secretary or Deputy Party Secretary (denoted by "high rank in the CP") and being paid for performance. This is consistent with the idea that firms use incentive contracts to attract the most talented employees to the position of CEO since achievement of high status in the Communist Party is often viewed as a marker of ability (Li et al., 2007).14 However, we cannot discount the possibility that status in the Communist Party simply proxies the quality of individuals' political connections which gives them access to the best education and jobs.
In 2003, the use of incentive contracts is positively associated with autonomy in employment decision-making, whereas autonomy in production is not significant. But, as in the 2005 survey, the 2003 survey reveals a negative association between investment autonomy and the use of incentive contracts.
6. Conclusion
This paper is the first to examine the operation of the CEO labour market across all industrial sectors of the Chinese economy. We do so using World Bank enterprise data for the first part of the 21st Century. Incentive schemes are commonplace and include contracts linking CEO pay directly to firm performance, annual bonus schemes, the posting of performance bonds, and holding company stock. These incentive mechanisms appear to complement rather than substitute for one another. The elasticity of pay with
respect to company performance is one or more in two-fifths of the cases where CEOs have performance contracts, suggesting many face high-powered incentives.
References
Bai, C-E., Xu, L. C. (2005) "Incentives for CEOs with multitasks: evidence from Chinese State-owned enterprises", Journal of Comparative Economics, 33: 517-539
Bertrand, M. and Mullainathan, S. (2001) "Are CEOs Rewarded for Luck? The Ones Without Principals Are", The Quarterly Journal of Economics, 901-932
Bryson, A., Forth, J. and Zhou, M. (2014) "Same or Different? The CEO Labour Market in China's Public Listed Companies", The Economic Journal, 124, F90-F108
Bryson, A., Forth, J. and Zhou, M. (forthcoming) "CEO Bonding: Who Posts Performance Bonds and Why?", China Economic Review
Bryson, A. Gomez, R.., Kretschmer, T. and Willman, P. (2007) "The Diffusion of Workplace Voice and High-Commitment Human Resource Management Practices in Britain, 1984-1998", Industrial and Corporate Change, 16, 3: 395-426
Cao, J., Lemmon, M., Pan, X., Qian, M. and Tian, G. (2012) "Political Promotion, CEO Incentives, and the Relationship between Pay and Performance", mimeo
Conyon, M. and He, L. (2012) "CEO Pay, Equity Ownership and Corporate Governance in China", mimeo
Groves, T., Hong, Y., McMillan, J., and Naughton, B. (1995) "China's Evolving Managerial Labor Market", Journal of Political Economy, 103, 4: 873-892
Harris, M. And Raviv, A. (1979) “Optimal incentive contracts with imperfect competition”, Journal of Economic Theory, 20: 231-259
Holmström, B. and P. Milgrom (1991). "Multi-task principal-agent analyses: Incentive contracts, asset ownership, and job design", Journal of Law, Economics, and Organization 7, 24-52
Jensen, M. and Murphy, K. J. (1990) "Performance Pay and Top Management Incentives", Journal of Political Economy, 98, 225-264
Lazear, E. (1979) “Why is there mandatory retirement?”, Journal of Political Economy, 87: 1261-1284
Lazear, E. (1981) “Agency, earnings profiles, productivity and hours restrictions”, American Economic Review, 71: 606-620
Lazear, E. (2000) “Performance pay and productivity”, American Economic Review, 90, 1346-1361
Li, H., Liu, P. W., Zhang, J. and Ma, N. (2007) “Economic Returns to Communist Party Membership: Evidence from Urban Chinese Twins”, The Economic Journal, 117: 1504-1520
Milgrom, P. and Roberts, J. (1995) "Complementarities and fit strategy, structure and organizational change in manufacturing", Journal of Accounting and Economics, 19, 2-3: 179-208
Murphy, K. J., 1999. “Executive Compensation” in Ashenfelter O., and Card D. (Ed.),
Handbook of Labor Economics, Vol. 3b, Elsevier Science North Holland, pp. 2485-
2563.
Rosen, S. (1990) "Contracts and the Market for Executives", NBER Working Paper #3542
Table 1: Who Appoints the CEO's?
Column percentages Majority Owner:
Domestic Foreign State No majority
All
Firm nominates, govt approves 11 4 24 9 13
Government appointment 6 2 37 12 12
Board of Directors appoints 40 74 15 67 38
Decided at shareholders' meeting 13 5 1 3 10
Appointed at employees' meeting 1 0 2 0 1
Other 28 15 21 9 25
Unweighted N 1661 169 503 33 2366
Note: authors' calculations from the World Bank Investment Climate Survey 2003. Figures are column percentages.
Table 2: Communist Party Position of CEOs
Column percentages Majority Owner:
Domestic Foreign State No Majority
All
Party Secretary 20 9 34 45 23
Deputy Party Secretary 5 1 16 0 7
Committee or Executive Member
11 3 23 6 13
Ordinary member 28 12 19 16 25
Not a member 37 74 8 32 33
Unweighted N 1651 163 505 31 2350
Table 3: Job autonomy Among CEOs In China, 2005
Row percentages
Majority ownership status: Low Medium High
State 34 28 38
Collective 21 23 56
Corporation 19 23 58
Private 11 17 72
Foreign 18 21 61
No majority owner 20 25 56
Table 4: Influences on CEO Job Autonomy
Dependent variable: Full autonomy of CEO [1] [2] [3]
Coeff. Coeff. Coeff.
Firm Characteristics:
Majority ownership: State ref.
Private 0.160 ***
[9.19]
Collective 0.056 ***
[2.69]
Corporation 0.091 ***
[5.33]
Foreign 0.147 ***
[7.03]
No majority ownership 0.097 ***
[3.38]
Size (Log of employees) -0.017 *** -0.019 *** -0.003
[-4.57] [-4.85] [-0.31]
Age (Log of years) -0.020 *** -0.022 *** -0.029 *
[-2.91] [-2.92] [-1.82]
CEO Characteristics:
CEO appointed by government -0.128 *** -0.195 *** -0.027
[-8.11] [-9.80] [-0.96]
CEO tenure 0.006 *** 0.007 *** 0.004
[5.98] [6.18] [1.22]
CEO education -0.033 *** -0.035 *** -0.018
[-6.83] [-6.85] [-0.97]
Corporate Governance:
Type of Board of Directors (BOD): None ref. ref. ref.
BOD with CEO/Chair separation -0.040 *** -0.039 *** -0.005
[-3.21] [-3.39] [-0.14]
BOD with CEO/Chair duality 0.026 ** 0.039 *** -0.027
[2.28] [3.27] [-0.69]
Senior executives have previously been fired -0.032 *** -0.040 *** 0.016
[-2.95] [-3.39] [0.49]
Constant 0.813 *** 0.967 *** 0.572 ***
[21.07] [27.65] [4.55]
Adjusted R2 0.125 0.100 0.020
Number of obs. 11817 10274 1543
OLS regressions. All models incorporate industry dummies and control city fixed effects. Model 1: full sample.
Model 2: firms that are not majority State-owned. Model 3: firms that are majority State-owned.
Table 5: Performance Pay Among CEOs In China, 2005
Cell percentages
Majority ownership status: Any
Low Powered
High Powered
State 71 47 23
Collective 64 47 17
Corporation 73 47 25
Private 67 43 23
Foreign 50 31 17
No majority owner 71 44 26
All 67 44 23
Note: authors' calculations from the World Bank Investment Climate Survey 2005. Figures are cell percentages. Respondents asked "Is the CEO's annual income directly related to the
company's performance?" Unweighted N=12,242. Follow up questions ask how CEO's income increases/decreases if company performance exceeds/fails the target with 7 categorical responses recording the percentage change running from 1-5% to >61%. "Low powered" identifies incentive contracts with <11% income at stake. "High powered" identifies incentive contracts with 11% or more income at stake. Columns 2 and 3 based on unweighted N=11,938. Table 6: Types of CEO Performance Pay
Cell percentages Majority Owner:
Domestic Foreign State No majority
All
Incentive plan linking income to firm performance
28 20 20 18 28
Annual pay contract (Nian Xin Zhi) 20 26 16 18 19
Performance Bond 11 3 17 9 11
Any of 3 above 42 39 42 39 42
More than 1 of 3 above 15 9 16 6 15
Holds company stock 37 23 8 6 30
Unweighted N 1676 171 519 33 2399
Table 7: OLS of the Probability that a CEO’s Pay is Linked to Performance, 2005
Dependent variable: CEO incentive contract
[1] [2] [3]
Coeff. Coeff. Coeff
. Firm Characteristics:
Majority ownership: State ref.
Private -0.016
[-1.02]
Collective -0.003
[-0.16]
Corporative 0.015
[1.02]
Foreign -0.203 ***
[-10.27]
No majority ownership -0.02
[-0.79]
Size (Log of employees) 0.028 *** 0.023 *** 0.055 ***
[8.10] [5.83] [6.04
]
Age (Log of years) -0.006 0.005 -0.02
7 **
[-.094] [0.63] [-2.0
0] CEO Characteristics:
CEO appointed by government -0.064 *** -0.018 -0.10
7 ***
[-4.36] [-0.92] [-4.3
3]
CEO tenure 0.002 ** 0.002 ** 0.003
[2.30] [2.05] [1.17
]
CEO education 0.044 *** 0.038 *** 0.040 **
[8.75] [7.09] [2.34
]
Production autonomy of CEO 0.014 *** 0.019 *** 0.015 *
[3.07] [3.20] [1.65
]
Investment autonomy of CEO -0.016 *** -0.018 *** -0.01
6 ***
[-5.65] [-5.33] [-2.7
2]
Employment autonomy of CEO -0.003 -0.006 0.001
[-0.57] [-0.99] [0.11
] Corporate Governance:
BOD with CEO/Chair separation 0.044 *** 0.013 0.065 **
[3.59] [0.95] [2.22
]
BOD with CEO/Chair duality 0.035 *** 0.024 * 0.055 ***
[2.94] [1.85] [6.04
] Senior executives have previously been fired 0.057 *** 0.071 *** 0.011
[5.73] [6.51] [0.41
]
Constant 0.290 *** 0.317 *** 0.185
[6.64] [7.11] [1.52
]
Adjusted R2 0.088 0.069 0.137
Number of obs 11817 10274 1543
OLS regressions. All models incorporate industry dummies and control city fixed effects. Model 1: full sample.
Model 2: firms that are not majority State-owned. Model 3: firms that are majority State-owned.
23 Table 8: OLS Models for CEO Incentive Contracts, 2003
Dependent variable: Incentive contracts [1] [2] [3] [4] [5] [6]
Coeff. Coeff. Coeff. Coeff. Coeff. Coeff.
Firm characteristics:
Majority ownership: State ref. ref. ref. ref. ref. ref.
Domestic -0.049 -0.041 -0.027 -0.017 -0.049 -0.031
[-1.46] [-1.21] [-0.77] [-0.48] [-0.84] [-0.52]
Foreign -0.225 *** -0.181 *** -0.145 *** -0.121 ** -0.338 *** -0.287 ***
[-4.17] [-3.50] [-2.62] [2.17] [-4.43] [-3.50]
No majority ownership -0.199 ** -0.180 * -0.130 -0.126 -0.336 ** -0.327 *
[-2.36] [-1.98] [-1.12] [-1.04] [-2.08] [-1.86]
Size (Log of employees) 0.017 ** 0.016 ** 0.026 *** 0.022 ** 0.053 *** 0.045 ***
[2.73] [2.33] [3.48] [2.59] [4.32] [3.50]
Age (Log of years) -0.039 ** -0.049 *** -0.005 -0.014 -0.006 -0.026
[-2.47] [-3.00] [-0.30] [-0.86] [-0.26] [-0.97]
CEO characteristics:
CEO tenure 0.001 0.001 0.002 0.002 0.001 0.001
[0.60] [0.72] [0.51] [0.56] [0.28] [0.32]
Education: Less than graduate degree ref. ref. ref. ref. ref. ref.
Has graduate degree 0.082 ** 0.074 * 0.056 0.046 0.123 ** 0.102 *
[2.34] [2.08] [1.54] [1.24] [2.23] [1.79]
Has postgraduate degree 0.153 *** 0.147 *** 0.149 *** 0.138 *** 0.313 *** 0.29 ***
[4.67] [4.38] [3.76] [3.45] [5.45] [4.99]
Production autonomy of CEO 0.004 0.004 0.003 0.004 -0.007 -0.005
[0.43] [0.51] [0.40] [0.53] [-0.48] [-0.38]
Investment autonomy of CEO -0.021 *** -0.022 *** -0.021 *** -0.022 *** -0.026 ** -0.028 **
[-3.02] [-3.11] [-3.23] [-3.39] [-2.18] [-2.26]
Employment autonomy of CEO 0.01 * 0.012 * 0.002 0.004 0.018 0.022 *
[1.76] [2.09] [0.20] [0.50] [1.54] [1.89]
CEO appointed by government -0.045 -0.045 -0.09 *** -0.093 *** -0.156 *** -0.165 ***
[-1.45] [-1.37] [-4.25] [-4.52] [-3.65] [-3.76]
Table 8 continued
Dependent variable: Incentive contracts
[1] [2] [3] [4] [5] [6]
Coeff. Coeff. Coeff. Coeff. Coeff. Coeff.
Corporate governance:
Type of Board of Directors (BOD): None ref. ref. ref. ref. ref. ref.
BOD with CEO/Chair separation 0.093 *** 0.002 0.094 ** 0.012 0.175 *** 0.006
[3.26] [0.07] [2.35] [0.29] [2.92] [0.10]
BOD with CEO/Chair duality 0.069 ** -0.035 0.12 *** 0.023 0.162 *** -0.034
[2.85] [-1.55] [4.37] [0.78] [4.74] [-0.93]
Senior executives have previously been fired 0.163 *** 0.161 *** 0.145 *** 0.145 *** 0.279 *** 0.277 ***
[5.97] [5.54] [5.78] [5.54] [7.00] [6.58]
Additional controls only available for 2003 data:
CP status: not a CP member ref. ref. ref.
High rank in CP 0.019 0.045 0.089 **
[0.86] [1.70] [2.23]
CP Member -0.014 -0.021 -0.02
[-0.64] [-0.82] [-0.45]
CP status missing 0.005 -0.01 -0.07
[0.06] [-0.07] [-0.35]
Table 8 continued
Dependent variable: Incentive contracts [1] [2] [3] [4] [5] [6]
Coeff. Coeff. Coeff. Coeff. Coeff. Coeff.
Stock ownership: no stock ref. ref. ref. ref. ref. ref.
CEO owns 1-49% of stock 0.043 0.04 * 0.07 **
[1.65] [1.75] [2.28]
CEO owns 50%+ of stock -0.004 0.008 0.005
[-0.11] [0.19] [0.08]
Don't know how much stock CEO owns 0.136 * 0.2 *** 0.357 **
[1.96] [3.38] [2.54]
Promotion from within 0.04 ** 0.026 0.065
[2.42] [1.00] [1.44]
Independent member(s) on Board 0.067 *** 0.064 ** 0.152 ***
[4.07] [2.85] [3.37]
Employee rep on Board 0.127 *** 0.108 *** 0.211 ***
[5.70] [4.59] [4.82]
CEO experience before current post -0.003 * -0.004 -0.001
[-1.82] [-1.08] [-0.31]
Chinese 0.019 -0.057 -0.109
[0.45] [-1.19] [-1.17]
Constant 0.17 ** 0.156 * 0.253 *** 0.321 *** 0.216 * 0.335 **
[2.45] [1.85] [3.32] [3.93] [1.83] [2.27]
Adjusted-R2 0.109 0.124 0.089 0.101 0.109 0.128
Number of obs. 2203 2203 2203 2203 2203 2203
OLS regressions. All models incorporate industry and city dummies.
Model 1, 2: Dependent variable is “paid via a contract linking pay to performance.”
Model 3, 4: Dependent variable is “Whether or not three types of incentive contracts (incentive plan linking income to firm performance, annual pay contract (Nian Xin Zhi) or performance bond) identified.”
Model 5, 6: Dependent variable is “the count of the three types of incentive contract.” t statistics in brackets.
26 Data Appendix
We use data from two World Bank Enterprise Surveys (www.enterprisesurveys.org). Our primary data source is the 2005 World Bank Investment Climate Survey undertaken by the National Bureau of Statistics in China. It covers 12,400 firms located in 120 cities throughout China. One hundred firms are surveyed in each city except in the four largest cities (Shanghai, Tianjin, Beijing and Chongqing) where 200 were surveyed. All provincial capitals are sampled together with cities selected based on the economic size of the province. Firms were randomly selected within the ten largest industries in each province (by value added). Consequently, the survey covers all major cities and is broadly representative of China as a whole.
We also use the World Bank Enterprise Survey from 2003. This comprises a sample of 2,400 enterprises from 18 cities: 150 from each of 12 larger cities and 100 from each of 6 smaller cities. Of the cities surveyed, four are in the northeast (Benxi, Changchun, Dalian and Harbin), four along the coast (Hangzhou, Jiangmen, Shenzhen and Wenzhou), four in the central region (Changsha, Nanchang, Wuhan and Zhengzhou), and six in the western region (Chongqing, Guilin, Kunming, Nanning, Lanzhou and Xi’an). Both surveys are completed by the most senior manager at the firm. The rationale for using both surveys is two-fold. First, although smaller than the 2005 survey, the 2003 survey contains information on aspects of executive compensation and corporate governance which are absent from the 2005 data. Second, the sample frames are different for the two surveys. For example, the 2003 survey consists of smaller firms, and they are not drawn from the same locations as the 2005 survey. Thus running similar multivariate analyses on both samples provides an opportunity to establish the external validity of findings based on the 2005 survey. Simple descriptive statistics from the two surveys are presented below.
Appendix Table A1: Descriptive statistics, 2005
Variable Obs Mean Std. Dev. Min Max
Whether CEO Pay linking to Firm Performance 11817 0.669 0.470 0 1
Corporate governance:
Type of Board of Directors (BOD): No BOD 11817 0.279 0.449 0 1 BOD with CEO/Chair separation 11817 0.357 0.479 0 1 BOD with CEO/Chair duality 11817 0.364 0.481 0 1 Fire or demotion of CEO, last 4 years 11817 0.222 0.416 0 1
CEO characteristics:
CEO tenure (years) 11817 6.399 4.721 1 56 Education of CEO 11817 5.575 0.994 1 7 CEO appointed by government 11817 0.119 0.324 0 1
Production autonomy of CEO 11817 7.410 1.490 1 8 Investment autonomy of CEO 11817 6.868 2.054 1 8
Employment autonomy of CEO 11817 7.305 1.587 1 8
Firm characteristics:
Majority ownership: State 11817 0.131 0.337 0 1
Collective 11817 0.082 0.275 0 1 Legal persons 11817 0.259 0.438 0 1
Private 11817 0.367 0.482 0 1 Foreign 11817 0.130 0.337 0 1
No majority ownership 11817 0.031 0.174 0 1 Size (Log of employees) 11817 5.619 1.473 1.8 13.5
Age (Log of years) 11817 2.277 0.786 1.1 4.9 Coefficient of variance in sales, last 3 years 11817 0.324 0.251 0 1.7
Number of power outages annually (divide by 100) 11817 0.114 0.239 0 4 Industry: Petroleum 11817 0.014 0.119 0 1
AgProcess 11817 0.079 0.269 0 1 BlackMetal 11817 0.040 0.196 0 1
ChemFiber 11817 0.004 0.063 0 1 ChemMat 11817 0.116 0.321 0 1
ClothShoeHat 11817 0.017 0.127 0 1 ColorMetal 11817 0.028 0.164 0 1
CommunicateEquip 11817 0.046 0.210 0 1 Craft 11817 0.009 0.093 0 1
DrinkManufacture 11817 0.014 0.117 0 1 EduSportGood 11817 0.003 0.057 0 1
Electronics 11817 0.069 0.254 0 1
Appendix Table A1 continued
Variable Obs Mean Std. Dev. Min Max
FoodManufacture 11817 0.020 0.140 0 1
Furniture 11817 0.004 0.067 0 1 GeneralEquip 11817 0.087 0.282 0 1
Instruments 11817 0.005 0.069 0 1 Leather 11817 0.012 0.107 0 1
Medical Equip 11817 0.034 0.182 0 1 Metal 11817 0.030 0.170 0 1
NonMetal 11817 0.105 0.306 0 1 Paper 11817 0.019 0.137 0 1
Plastic 11817 0.027 0.163 0 1 Printing 11817 0.005 0.069 0 1
Recycle 11817 0.000 0.016 0 1 Rubber 11817 0.002 0.040 0 1
SpecificEquip 11817 0.040 0.196 0 1 Textile 11817 0.077 0.267 0 1
Tobacco 11817 0.003 0.059 0 1 TransEquip 11817 0.079 0.270 0 1
Appendix Table A2: Descriptive statistics, 2003
Variable Obs Mean Std. Dev. Min Max
Paid via a contract linking pay to performance 2203 0.286 0.452 0 1 Any of the three types identified 2203 0.429 0.495 0 1 The count of the three types of incentive contract 2203 0.606 0.796 0 3
Corporate governance:
Type of Board of Directors (BOD): No BOD 2203 0.489 0.500 0 1 BOD with CEO/Chair separation 2203 0.268 0.443 0 1 BOD with CEO/Chair duality 2203 0.243 0.429 0 1 Fire experience of senior executives 2203 0.176 0.381 0 1 CEO appointed by government 2203 0.124 0.330 0 1
CEO characteristics:
CEO tenure (years) 2203 5.730 4.223 1 33 Has graduate degree 2203 0.680 0.466 0 1 Has postgraduate degree 2203 0.155 0.362 0 1 Production autonomy of CEO 2203 7.082 1.699 1 8 Investment autonomy of CEO 2203 5.694 2.624 1 8 Employment autonomy of CEO 2203 6.568 2.135 1 8
Firm characteristics:
Majority ownership: Domestic 2203 0.698 0.459 0 1
Foreign 2203 0.070 0.255 0 1
State 2203 0.218 0.413 0 1 No majority ownership 2203 0.014 0.118 0 1 Industry: Clothing 2203 0.147 0.354
Food 2203 0.029 0.168 0 1 Metals and machinery 2203 0.064 0.245 0 1 Electronics 2203 0.225 0.417 0 1 Chemicals and pharmaceuticals 2203 0.036 0.187 0 1 IT services 2203 0.084 0.277 0 1 Telecommunications 2203 0.003 0.052 0 1 Accounting and finance 2203 0.069 0.253 0 1 Advertising and marketing 2203 0.064 0.244 0 1 Other services 2203 0.112 0.316 0 1 Auto and auto components 2203 0.168 0.374 0 1 Size (Log of employees) 2203 4.869 1.495 0.0 11.2 Age (Log of years) 2203 2.297 0.885 0.7 4.0
Appendix Table A1 continued
Variable Obs Mean Std. Dev. Min Max
Additional controls only available in 2003
CP status: Not member 2203 0.326 0.469 0 1 High rank in CP 2203 0.420 0.494 0 1
CP Member 2203 0.241 0.428 0 1
CP status missing 2203 0.013 0.112 0 1 Stock ownership: No stock 2203 0.695 0.461 0 1 CEO owns 1-49% of stock 2203 0.181 0.385 0 1 CEO owns 50%+ of stock 2203 0.102 0.302 0 1 Don't know how much stock CEO owns 2203 0.022 0.148 0 1 Promotion from within 2203 0.356 0.479 0 1 Independent member(s) on Board 2203 0.166 0.372 0 1 Employee rep on Board 2203 0.235 0.424 0 1 CEO experience before current post (years) 2203 1.422 2.863 0 22
Chinese 2203 0.959 0.199 0 1
![Table 7: OLS of the Probability that a CEO’s Pay is Linked to Performance, 2005 [1] [2]](https://thumb-us.123doks.com/thumbv2/123dok_us/8686826.379158/21.612.76.538.83.715/table-ols-probability-ceo-s-pay-linked-performance.webp)
![Table 8: OLS Models for CEO Incentive Contracts, 2003 [1] [2]](https://thumb-us.123doks.com/thumbv2/123dok_us/8686826.379158/23.792.76.725.89.527/table-ols-models-ceo-incentive-contracts.webp)