E co L I b R I u m • A P R I L 2 0 12
44
A Smart School of Thought:
Natural Ventilation With Ground
Coupled Radiant Slab Cooling/Heating
Dr Eddy Rusly, m.AIRAH, senior building scientist, meinhardt building Science Group; andDr mirek Piechowski, group leader, meinhardt building Science Group
2. IntRoDuctIon
In the school environment, good internal air quality (IAQ) and space comfort are critical in the process of teaching and learning that takes quite a number of hours everyday but these elements are often not getting adequate attention at times. Most schools particularly in regional areas are one storey tall. These schools have large play grounds in the surroundings that can be used as the bed for Ground Heat Exchanger (GHE) to utilise Earth’s natural thermal energy storage. This large space suits the cheaper horizontal type GHE thus more feasible for implementation.
As for IAQ and space comfort, natural ventilation is a feasible option because this ventilation strategy does not involve large investment at all. Windows and openings can provide air flow distribution of fresh air to replenish the stale inside air and concurrently take away some of the excess heat generated by the internal loads from occupants, equipment and lighting. A supplementary system is usually beneficial to maintain comfort during extreme outdoor conditions at the heights of summer and winter. Radiant systems can enhance thermal comfort by manipulating the perception of human senses. This robust and efficient system is perfectly suited to support the natural ventilation system.
This paper strives to demonstrate that a hybrid natural ventilation system with basic control strategies complemented by slab radiant cooling/heating that harnesses the geothermal renewable energy source using a highly efficient water to water heat pump can not only provide energy savings but also deliver sufficiently comfortable internal condition. The typical
Melbourne climatic condition suits this hybrid system due to its heating dominated seasons with abundant opportunities to make use of the mild outside air in summer through natural ventilation, with the exception of a few random extreme days.
2.1 natural ventilation
Natural ventilation systems are designed to provide sufficient outside air to achieve appropriate standards of indoor air quality and to provide free cooling or reduce summer overheat as necessary. The limited cooling capacity of natural ventilation and its dependence on the ambient mean good solar control and proper management of internal gains should be in place. The connection to outside also provides better occupant acceptance to more fluctuating or less controlled room
conditions. Naturally ventilated buildings do not aim to achieve constant environmental conditions but rather to utilise the dynamics of air flow to provide comfortable and controllable conditions for the occupants. As the climate warms, occupants tend to adapt and shift their perception of the room condition where they start to feel discomfort to a higher temperature, first of all, by suiting their clothing.
Controllable ventilation rates across a wide range from 0.5 to 5 ACH or more are an essential feature in natural ventilation. Quite commonly, a complete shut down is acceptable to minimise discomfort from wintry drafts. The most appropriate strategy has to consider the type of space and whether wind or buoyancy forces are likely to predominate. Buoyancy ventilation may be temperature-induced (stack ventilation) or humidity induced (shower/cool tower, malquaf) that results from the difference in air density. Within the room,
1. AbStRAct
In the school environment, students and teachers spend many hours a day doing creative activities. The emphasis on indoor air quality, comfort and energy efficiency needs to be ascertained such as that of commercial buildings. This paper proposes a feasibly ‘smart’ education facility by incorporating natural ventilation assisted with radiant slab cooling/heating for optimal energy savings and occupant comfort. It also highlights climate change awareness through renewable energy technology utilisation in the GeoExchange technology. Pros and cons (e.g. condensation) were illustrated with the most obvious positive coming from the large playing grounds in these schools to function as the bed for the cheaper horizontal type ground heat exchanger. An energy model based on this system was developed for the full year sub-hourly time step simulation to Melbourne’s weather condition in EnergyPlus. A sophisticated control strategy was implemented in the building energy simulation and compared with two other conventional systems in terms of energy consumption, comfort and economics where the proposed system was shown to have better energy efficiency and thermal comfort with reasonable payback periods to render this eco-friendly and renewable energy oriented system a widespread application.
F O R U M
heat and humidity given off by occupants and other internal sources both tend to make air rise. The stale, heated air escapes from openings in the ceiling or roof and permits fresh air to enter lower openings to replace it. Stack effect ventilation is effective in winter, when indoor/outdoor temperature difference is at a maximum but will not work in summer for the undesirable indoor temperature required to be warmer than ambient. Comparatively, wind causes a positive pressure on the windward side and a negative pressure on the leeward side of a building. To equalise pressure, fresh air will enter any windward opening and exit from any leeward opening. In summer, wind is used to supply as much fresh air as possible while in winter, ventilation is normally reduced to levels sufficient to remove excess moisture and pollutants [4]. Inside a naturally ventilated building the air movement is governed by the size and placement of openings and connection between rooms that form the air flow network. The internal design of the building has to facilitate this air movement effectively to maximise the benefits from this strategy.
2.2 Radiant slab cooling/heating
Radiant heating and cooling maintains room thermal conditions primarily by direct transfer of radiant energy rather than convection heating and cooling through the use of radiant panels with controlled temperature surfaces on floors, walls or ceilings maintained by circulating water, air, or electric current through a circuit embedded in them. The two most common types of panel systems are hydronic and electrical systems. In hydronic systems, heated or cooled water is being circulated through the radiant panels whereas in the electrically heated systems, light metal panel ceiling systems are preferred because ceilings are better exposed and faster response time through higher surface temperature can be effected [2].
Despite the many benefits radiant systems can offer such as better comfort levels [7], absence of space-conditioning equipment, reduced air quantities for a minimum draft environment, no noise associated with fan-coil or induction units, reduced peak loads due to thermal energy storage in the panel structure etc, there are some disadvantages such as slow response time, condensation risk in cooling and limited heating capacity, to overcome during the design stage. Radiant floor/slab systems have the benefits of bringing the sensible heating/cooling directly to the occupied space and enhancing thermal comfort through improving the mean radiant temperature of the floor. The floor as the heat sink/heat source is thus responsible for a large portion of the room’s sensible load so that the room supply air could be reduced close to the quantity required for ventilation. A hybrid system combines radiant panel systems with other systems be it natural ventilation or forced air systems where latent and fresh air loads are assigned to the convective system and most of the sensible load to the radiant system. Because the room air temperature and mean radiant temperature (MRT) can be controlled independently, better comfort conditions and system efficiency can be achieved – at the expense of higher control complexity and capital cost [1].
2.3 GeoExchange and ground source heat pump (GSHP)
Unlike ordinary air conditioning systems or furnaces that create heat by burning a fuel, typically natural gas, propane, or oil, GeoExchange systems harness Earth’s natural heat in winter
through a series of pipes, called a loop, installed below the surface of the ground or submersed in a pond or lake with no combustion – apart from the electricity to run the heat pump. Fluid (water or refrigerant) circulating in the loop carries and transfers this heat for space heating or pre-heat domestic hot water. An indoor system typically compressor-driven vapour compression systems will concentrate this thermal energy and release it inside the home at a higher temperature. Generally, duct fans distribute the heat to various rooms or more effectively, a water-to-water transfer system can be used in a radiant floor system.
In summer, the process is reversed to provide space cooling. Excess heat is drawn from the space, transferred to the loop, and rejected to the Earth. Geoexchange systems provide cooling by removing heat from the interior, not by injecting cold air, in the same way a refrigerator keeps its contents cool. GSHPs work differently from conventional Air Source Heat Pumps (ASHP) that use the outdoor air as their heat source or heat sink. GSHP systems are more energy efficient because the temperature of the heat source or sink is more stable and moderate unlike the daily or seasonal fluctuations in ambient facing the ASHPs.
Efficiency apart, a large proportion of the energy used in a GSHP system is renewable energy from geothermal source. The remainder is electrical energy employed to concentrate heat and transport it between the conditioned space and ground. Besides the cost savings due to its high energy efficiency, the other advantages of a GSHP system are:
1. No combustion of fossil fuels for heating with no direct CO or CO2 as by products
2. Simple design, operation and maintenance 3. Additional hot water production in summer 4. No unsightly/noisy outdoor fan driven unit
5. Safe, compact indoor unit, robust and space-efficient
3. mEtHoDoLoGy
This study evaluates and compares three HVAC systems for application in schools. The intent is to provide a good insight into system performance in terms of energy efficiency, comfort and economics through the vast capabilities of energy modelling/simulation using an advanced energy simulation software called DesignBuilder [5] and its calculation engine, EnergyPlus.
The holistic approach of this study detracts from the usual steady state ventilation scenarios over snap shot time frames (through envelope flow models or CFD analyses [9]) where details of the magnitude and pattern of natural air movement depends strongly on the strength and direction of the natural driving forces (wind turbulence) and the resistance of the flow path. Instead, it bundles together the whole building with everything about it where the full yearly weather profile was put in motion, a robust control strategy was developed to resemble both user and automated controls for the natural ventilation system with a dedicated outdoor air system – in compliance with the health and regulatory ventilation standard, the GSHP model was calibrated based on a selected manufacturer’s data for its capacity and performance, the slab radiant floor was carefully fined tuned to give optimal performance whilst avoiding condensation, in
E co L I b R I u m • A P R I L 2 0 12
46
the quest to present the ‘full picture’ data on thermal comfort, system performance and energy consumption for all the systems involved. Additionally, a sophisticated high level hybrid control for the system operation management was also implemented for energy savings.
The EnergyPlus software version 5.0 was used to perform the energy simulations of this study with the relevant components embedded into the designated models. Three distinct models were derived to form a basis for comparison from the energy, comfort and economics perspectives simulated on sub-hourly time steps under the realm of complete annual local weather data. The target building was modelled with the respective detailed HVAC systems factoring effects imposed by transient external weather conditions in temperature, humidity, wind speed & direction as well as buoyancy and stack. The two other models being compared to were of comparative yet conventional in nature and as such used as a benchmark in the comparison.
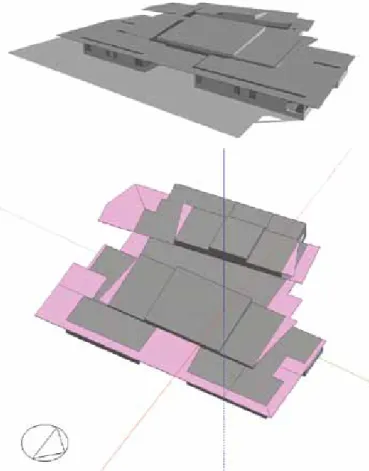
3.1 building model
The modelling procedure starts with geometry creation for the building in DesignBuilder. The physique, fabric and envelope of the building was derived from a school in Melbourne, Australia. The building was built in compliance with the BCA 2006 with fairly extensive shading as shown in Fig. 1. The building geometry was prepared and set up for the Air Flow Network (AFN) modelling to analyse dependence of air fl ow on wind pressure, buoyancy and stack effects following certain modelling requirements in EnergyPlus. At this stage, all other aspects of building energy consumption including occupant, building fabric, lighting, HVAC were to be defi ned as well.
The next step was to export the model into the EnergyPlus idf format. This is where plant equipment was constructed for GSHP and GHE and the active slab component was laid for the fl oors in all the occupied rooms. This step involves detailed set up, checking and adjustments of input defi nitions, parameters and components, fi ne tuning and validation as well as integrity check for the branches and nodes as part of the air loop, system and plant components.
Subsequently, all the windows and openings were set up by defi ning their opening and availability schedules along with ventilation control, set point, venting open factor for wind impact based on the standard wind pressure coeffi cients from the EnergyPlus library data.
Following on was clarifi cation of output variables and allocation of an appropriate weather fi le prior to running the calculation. The local Melbourne weather data – selected based on the actual building location – was used to check the feasibility and functionality of this system and was set as a basis of comparison to other locations of different climate such as Sydney and Brisbane in possible future studies.
Afterward, the model was tested and run parametrically to fi ne tune the openings so that the slab radiant fl oor could perform optimally without condensation risks before running the model for the full year. The energy results were collected, analysed and compared with two other benchmarking models.
3.2 HvAc components modelled in EnergyPlus
3.2.1 natural ventilation modelling through Air Flow network (AFn)
The bulk-fl ow natural ventilation can be simulated using the Air Flow Network model in EnergyPlus. The multi-zone AFN provides the ability to simulate multi-zone airfl ows in a building through open or partially open openings, windows, doors with zone or individual surface control, zone pressure due to envelope leakage or air fl ow through cracks in exterior or interzone surfaces driven by wind of transient speed and direction with regard to surface orientation, buoyancy or stack effect and also by a forced air distribution system when it is modelled [6]. 3.2.2 Low temperature hydronic
radiant slab heating/cooling
This low temperature hydronic radiant system is a
component of zone equipment to model any radiant system where water is used to supply/remove energy to/from a building surface e.g. wall, ceiling, or fl oor. Generally secondary in control hierarchy, this component is designated to meet any remaining zone load not met by other HVAC systems in the zone of higher priority. The control is accomplished by throttling the hot or chilled water fl ow to the unit based on the set points defi ned for the radiant system and not the zone thermostat. This component is not intended to simulate high temperature electric or gas radiant heaters [6].
3.2.3 GSHP with surface (horizontal) ground heat exchanger (GHE)
There are two water-to-water heat pump models in EnergyPlus i.e. parameter estimation and equation fi t heat pump models. The equation-fi t model [10], used in this study, has its performance based on the curve-fi tted catalog data which resembles a black box with no usage of heat transfer equations.
F O R U M
The other one [8] uses physical parameters generated from the catalog data to predict performance of the heat pump using thermodynamic laws and heat transfer equations.
The supply side of the heat pump is usually connected to a GHE, in this case a horizontal surface type. Figure 2 shows the layout and piping diagram of the water-to-water heat pump. This surface heat exchanger model is to simulate hydronic surface ground heat exchangers that include pavement surfaces with embedded pipes for snow-melting or heat rejection from hybrid ground source heat pump systems. The heat exchanger may be ground coupled or exposed to the wind but not solar gains, it may be a stand alone condensing unit or connected in parallel with other condensing equipment such as a cooling tower.
Figure 2: Schematic diagram of GSHP with GHE in EnergyPlus.
3.2.4 Dedicated outdoor air system (DoAS) The DOAS in EnergyPlus is designated to provide either additional outside air or a limited amount of sensible and/or latent air conditioning. It is a subsystem of an HVAC air loop with a mixed air box that has a controller to provide outdoor air ventilation or free cooling/heat recovery as applicable. Several limit controls are available for fl ow rate modulation between the minimum OA requirement and matching the mixed air temperature to its set point or even engaging humidity control and night cycle duty for the fan [6].
3.3 Simulation models
The set point temperatures in the rooms are dual-set point with dead band control of 20–24°C. The radiant fl oor surface temperatures are set at 18 and 23°C for heating and cooling, respectively. The control room dew point temperature cut off is set at 1°C below the fl oor surface temperature where water fl ow through the fl oor coils is to be stopped to avoid condensation. The window openings have individual control
to mimic occupant behaviour as to when and how much to open based on outdoor dry bulb temperature. Three models were developed as follows and where applicable the AFN component was of the same settings to set a similar basis for comparison.
Model A: Natural ventilation with radiant slab cooling/heating
powered by GSHP with DOAS and hybrid ventilation control.
This is the proposed model that utilises natural ventilation with slab cooling/heating for all the occupied zones. In addition to this base system, a stand alone additional DOAS is also in place to supply the minimum fresh air requirement (10 L/s/person for persons over 16 years of age) in all the occupied rooms to meet the health and regulatory standards [3] based on occupancy.
The model has a hybrid ventilation control, meaning that whilst the slab radiant cooling/heating is operating based on occupancy hours, the natural ventilation and DOAS are under a control scheme that does not allow simultaneous operation of the two systems taking cues from the minimum fresh air requirement in the control zone (in this case Studio 2) whereby when outdoor air entering the zone through windows is less than the required amount (based on feed-signals from CO2 sensors for example), the windows will be shut off for the DOAS to operate to supply the minimum fresh air or in the other case, the natural ventilation will be fully operational based on the openings control at the external windows with the DOAS off. The GSHP performance (capacity and compressor power) is based on Macquay water to water source heat pump GRW 420 capacity data for a range of Entering Water Temperature (EWT), fl ow rates and Leaving Water Temperature (LWT) on the source and load sides for cooling and heating.
Model B: Natural ventilation with FCU system
and DOAS on hybrid ventilation control. This is a hybrid ventilation model that combines natural and forced ventilation systems. The control settings for all the external windows as far as natural ventilation is concerned are the same as Model A for a consistent comparison. The hybrid control works in the same manner as Model A as well. The chiller for this system is assumed to have a COP of 5.5 with the boiler having thermal effi ciency of 83%.
Model C: Forced ventilation model with FCU system.
This model relies solely on forced air ventilation from the FCU units as the building’s HVAC system. Fresh air requirements of 10 L/s/person are embedded in the FCU outdoor unit based on occupancy density. No natural ventilation is incorporated apart from normal infi ltration of 0.5 ACH for all the rooms. The chiller for this system is assumed to have a COP of 5.5 with the boiler having thermal effi ciency of 83%.
4. RESuLtS
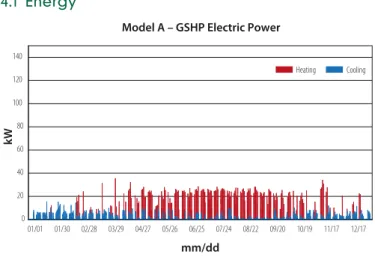
4.1 Energy
Figure 3: Annual cooling and heating electrical power consumption for GSHP, chiller/boiler of the three models.
Condenser Supply Side Condenser Demand Side Plant Demand Side Plant Supply Side
GSHP
Ground Heat
Exchanger
Building zones
Model A – GSHP Electric Power
0 20 40 60 80 100 120 140 Cooling mm/dd kW 01/01 01/30 02/28 03/29 04/27 05/26 06/25 07/24 08/22 09/20 10/19 11/17 12/17 Heating
49
A P R I L 2 0 12 • E co L I b R I u m
AIRAH technical publications
Purchase online at www.airah.org.au
Consult the cornerstone
Consult the DA manual
The Design Application (DA) series of publications produced by
AIRAH are best practice guidelines to assist HVAC&R practitioners
with their day to day tasks in the design, operation and
maintenance of mechanical building services.
ST ST STITUTE OF REITUTE OF REITUTE OF REFRIGERFRIGERFRIGERATATATION, AIR ION, AIR COION, AIR COCONDITIONING AND HENDITIONING AND HENDITIONING AND HEATATATINININGGG
AIAIAIR COR COR CONDITIONINGNDITIONINGNDITIONING WA
16
16
16
WAWATER PIPITER PIPITER PIPIION, AIR ION, AIR ION, AIR COCOCONDITIONING AND HENDITIONING AND HENDITIONING AND HE
THE THE
THE AUAUAUSTSTSTRARARALIAN INLIAN INLIAN INSTSTSTITUTE OF REITUTE OF REITUTE OF REFRIGERFRIGERFRIGERATATATION, AIR ION, AIR ION, AIR COCOCONDITIONING AND HENDITIONING AND HENDITIONING AND HEATATATINININGGG
BUILDING BUILDING
BUILDING COMMISSIONINGCOMMISSIONINGCOMMISSIONING
DA
DA
DA27
27
27
HV HV HVACACAC HVAC HV HV HVAC HVAC HVAC HV HV HVAC HV &R&R&R MAINTENANCE MAINTENANCE MAINTENANCEDA
DA
DA19
19
19
DA19
DA
DA
DA19
DA19
DA19
DA
DA
DA19
DA
THE THETHE AUAUAUSTSTSTRARARALIAN INLIAN INLIAN INSTSTSTITUTE OF REITUTE OF REITUTE OF REFRIGERFRIGERATFRIGERATATION, AIR ION, AIR ION, AIR COCOCONDITIONING AND HENDITIONING AND HENDITIONING AND HEATATATINININGGG
AL AL AL
DA
DA
DA20
20
20
THE THETHE AUAUAUSTSTSTRARARALIAN INLIAN INLIAN INSTSTSTITUTE OF REITUTE OF REITUTE OF REFRIGERFRIGERFRIGERATATATION, AIR ION, AIR ION, AIR COCOCONDITIONING AND HENDITIONING AND HENDITIONING AND HEATATATINININGGG
HUMI HUMI
HUMID TROPD TROPD TROPICICICAL AL AL AIAIAIR COR COR CONDITIONINGNDITIONINGNDITIONING
DA
DA
DA16
16
16
DA16
DA
DA
DA16
DA16
DA16
DA
DA
DA16
DA
ITUTE OF RE ITUTE OF RE ITUTE OF REFRIGERFRIGERFRIGERATATATION, AIR ION, AIR ION, AIRDA27 BUILDING COMMISSIONING BUILDING COMMISSIONING DA27
•••
24 •••25
The commissioning manager can assist the owner and building designers define the POR, the content of which is discussed in Section 5.
3.4.3. Assemble commissioning team
The next step is to put together the commissioning team. The role of the commissioning team is to oversee the entire commissioning process.
The commissioning team will: • Provide a forum for inter trade communication. • Provide a mechanism for the clear allocation of
responsibilities. • Participate in commissioning reviews. • Assist with non-conformance resolution. • Approve the commissioning and tuning plans. • Approve the commissioning report.
The commissioning manager chairs the commissioning team meetings and is ultimately responsible for assigning commissioning task responsibilities and signing off on required verification steps. Stakeholders that should be represented on the commissioning team include: • Owner’s representative. • Facility management staff. • Maintenance manager. • Occupant or tenant representative. • Main contractor. • Building services subcontractors. • Specific equipment manufacturers. • Building designers and architect. • Controls contractor or supplier. • Building services designers. Not all of these stakeholders will be available at the beginning of the project. The commissioning team will evolve over the course of the project as key stakeholders become and depending on the contractual It is essential however, that all key included at the earliest possible stage to ensure that the owner’s expectations and individual responsibilities are clearly allocated and understood. It is also essential that once these stakeholders are engaged in the project, the actions and responsibilities delegated to them and the commissioning expectations of them are clearly communicated to them and understood and accepted by them. Periodic meetings of the commissioning team are essential to a successful building commissioning frequent team meetings are generally required during the later stages of construction, testing and handover as this when most errors or conflicts can arise and when there is the least amount of time and resources available to resolve them.
Pre-design meeting
process is to hold a pre-design meeting of the commissioning team. This is an opportunity for the commissioning manager and owner to introduce all stakeholders, explain the commissioning process, allocate all responsibilities (clarifying any overlaps), coordinate the commissioning activities, and clearly outline the The owner should fully empower the commissioning manager at this time to ensure that all stakeholders in the
owner’s expectations with commissioning. The pre-design meeting is also an opportunity for commissioning team members to share lessons learned from previous commissioning projects.
3.4.5. Roles and responsibilities
Not all project stakeholders (e.g. specialist contractors and subcontractors) will be engaged in the project at this early stage however, their roles and responsibilities still need to be allocated and defined at this point. Once these stakeholders are engaged in the project and join the commissioning team they should be asked to sign off or confirm the roles and responsibilities that have been allocated to them. These roles and responsibilities should be detailed as part of the conditions of contract, not after the awarding of the contract or subcontract works.
3.4.6. Define scope of work
One of the pre-design deliverables of the commissioning team is a well-defined and agreed scope of work for the project so that the design phase can be carried out. The scope of work will form part of the commissioning plan.
Draft commissioning plan (outline)
Once the scope of work has been defined, an outline of the commissioning plan will be developed by the commissioning manager. The commissioning plan is a document that evolves project and is reviewed and updated at several stages project. See figure 3.2. Developing an outline
plan at the pre-design stage helps the commissioning team to focus on the commissioning of the design stage of the project. The commissioning plan serves as a focus point for the
team throughout the project. At pre-design stage it will specify the design related commissioning tasks At design stage it will specify the construction tasks and schedules. At construction stage it will specify the handover related commissioning schedules. At handover stage it will specify the building tuning related commissioning tasks.
Figure 3.2: Commissioning Plan updated after each phase
Final commissioningplan
Install Test Design
Outline The commissioning process
Figure 3.1: The Commissioning Process • Assign a commissioning manager • Document owner’s requirements • Assemble commissioning team • Pre-design commissioning meeting • Draft scope of work • Outline commissioning plan Pre design • System design reviews • Design review reports • Commissioning ream review • Design issues and changes • Commissioning specification • Updated commissioining plan (Design) Design • Construction documentation • Systems installation / site • Building documentation Install • Test reports • Diagnostic monitoring • Functional tests and TAB tests Test • Final building documentation • Training • Operations review and Handover • Tuning and maintenance • Persistance strategies • Continuous commissioning • Recommissioning • Retrocommissioning • Replacement Owning CENT CENT CENTRIFURIFURIFUGALGALGAL PUMPSPUMPSPUMPS
DA
DA
DA01
01
01
DA01
DA
DA
DA01
DA01
DA01
DA
DA
DA01
DA
NDITIONING AND HE NDITIONING AND HENDITIONING AND HEATATATINININGGG THE THE THE AUAUAUSTSTSTRARARALIAN INLIAN INLIAN INSTSTSTITUTE OF REITUTE OF REITUTE OF REFRIGERFRIGERFRIGERATATION, AIR ATION, AIR ION, AIR COCOCONDITIONING AND HENDITIONING AND HENDITIONING AND HEATATATINININGGG THE AUTHE THE AUAUSTSTSTRARARALIAN INLIAN INLIAN INSTSTST
DA
DA
DA13
13
13
THE THE THE AUAUAUSTSTSTRARARALIAN INLIAN INLIAN INSTSTITUTE OF RESTITUTE OF REITUTE OF REFRIGERFRIGERFRIGERATATATION, AIR ION, AIR ION, AIR COCOCO
FANS FANS
FANS
13
13
13
DA15
DA15
DA
DA
DA15
DA15
DA15
DA
DA
DA15
DA
DA
DA
AIR AIR FIFIFILTAIR LTERLTERSSSER15
15
DA27 BUILDING COMMISSIONING BUILDING COMMISSIONING
•••
24
The commissioning manager can assist the owner and building designers define the POR, the content of which is discussed in Section 5.
3.4.3. Assemble commissioning team
The next step is to put together the commissioning team. The role of the commissioning team is to oversee the entire commissioning process.
The commissioning team will: • Provide a forum for inter trade communication. • Provide a mechanism for the clear allocation of
responsibilities. • Participate in commissioning reviews. • Assist with non-conformance resolution. • Approve the commissioning and tuning plans. • Approve the commissioning report.
The commissioning manager chairs the commissioning team meetings and is ultimately responsible for assigning commissioning task responsibilities and signing off on required verification steps. Stakeholders that should be represented on the commissioning team include: • Owner’s representative. • Facility management staff. • Maintenance manager. • Occupant or tenant representative. • Main contractor. • Building services subcontractors. • Specific equipment manufacturers. • Building designers and architect. • Controls contractor or supplier. • Building services designers. Not all of these stakeholders will be available at the beginning of the project. The commissioning team will evolve over the course of the project as key stakeholders become and depending on the contractual It is essential however, that all key included at the earliest possible stage to ensure that the owner’s expectations and individual responsibilities are clearly allocated and understood. It is also essential that once these stakeholders are engaged in the project, the actions and responsibilities delegated to them and the commissioning expectations of them are clearly communicated to them and understood and accepted by them. Periodic meetings of the commissioning team are essential to a successful building commissioning frequent team meetings are generally required during the later stages of construction, testing and handover as this when most errors or conflicts can arise and when there is the least amount of time and resources available to resolve them.
Pre-design meeting
process is to hold a pre-design meeting of the commissioning team. This is an opportunity for the commissioning manager and owner to introduce all stakeholders, explain the commissioning process, allocate all responsibilities (clarifying any overlaps), coordinate the commissioning activities, and clearly outline the The owner should fully empower the commissioning manager at this time to ensure that all stakeholders in the
owner’s expectations with commissioning. The pre-design meeting is also an opportunity for commissioning team members to share lessons learned from previous commissioning projects.
3.4.5.
Not all and subcontractors) this early stage however, their roles and responsibilities still need to be allocated and defined at this point. Once these the commissioning team they should be asked to sign off or confirm the roles and responsibilities that have been allocated to them. These roles and responsibilities should be detailed as part of the conditions of contract, not after the awarding of the contract or subcontract works.
3.4.6.
One of team project scope of work will form part of the commissioning plan. Once the scope of work has been defined, an outline of the commissioning plan will be developed by the commissioning manager. The commissioning plan is a document that evolves the commissioning team to focus on the commissioning The commissioning plan serves as a focus point for the stage it will specify the design related commissioning tasks stage it will specify the handover related commissioning building tuning related commissioning tasks.
Test
The commissioning process
Figure 3.1: The Commissioning Process • Assign a commissioning manager
• Document owner’s requirements • Assemble commissioning team
• Pre-design commissioning meeting • Draft scope of work • Outline commissioning plan
Pre design
• System design reviews • Design review reports • Commissioning ream review
• Design issues and changes • Commissioning specification • Updated commissioining plan (Design)
Design
• Construction documentation • Systems installation / site • Building documentation
Install
• Test reports • Diagnostic monitoring • Functional tests and TAB
tests
Test
• Final building documentation • Training • Operations review and
Handover
• Tuning and maintenance • Persistance strategies • Continuous commissioning • Recommissioning • Retrocommissioning • Replacement Owning APPLIC ATION MANU AL
DA
BUILDINGCOMMISSIONING27
THE AUSTR
ALIAN
INSTITUTE
OF RE
FRIGERATION
, AIR C ONDITION ING AN D HEAT ING Australian I nstitute o f Refrigera tion Air C
onditioning and H eating
Level 3, 1 Elizabeth Street, M elbourne VIC 3000 Tel : +61 3 8623 3 000 Fax: +61 3 9614 8 949 www.a irah.org .au DA 27 — BU ILD ING CO M M ISS ION ING APPLICATION MANUAL CENTRIFUGAL PUMPS DA01
THE AUSTRALIAN INSTITUTE OF REFRIGERATION, AIR CONDITIONING AND HEATING
APPLICATION MANUAL
DA11 THE AUSTRALIAN INSTITUTE OF REFRIGERATION, AIR CONDITIONING AND HEATING
STEAM AND CONDENSATE
APPLICATION MANUAL WATER TREATMENT
DA18
THE AUSTRALIAN INSTITUTE OF REFRIGERATION, AIR CONDITIONING AND HEATING
APPLICATION MANUAL THE AUSTRALIAN INSTITUTE OF REFRIGERATION, AIR CONDITIONING AND HEATING
DABUILDING MANAGEMENT28 AND CONTROL SYSTEMS (BMCS) APPLICATION MANUAL HVAC&R MAINTENANCE DA19 THE AUSTRALIAN INSTITUTE OF REFRIGERATION, AIR CONDITIONING AND HEATING
APPLICATION MANUAL EVAPORATIVE AIR COOLING SYSTEMS THE AUSTRALIAN INSTITUTE OF REFRIGER ATION, AIR CONDITIONING AND HEATING
DA29 APPLICATION MANUAL
NOISE CONTROL
DA02 THE AUSTRALIAN INSTITUTE OF REFRIGERATION, AIR CONDITIONING AND HEATING
APPLICATION MANUAL
DA13 THE AUSTRALIAN INSTITUTE OF REFRIGERATION, AIR CONDITIONING AND HEATING
FANS
APPLICATION MANUAL
DA20
THE AUSTRALIAN INSTITUTE OF REFRIGERATION, AIR CONDITIONING AND HEATING
HUMID TROPICAL
AIR CONDITIONING
APPLICATION MANUAL
DA03 THE AUSTRALIAN INSTITUTE OF REFRIGERATION, AIR CONDITIONING AND HEATING
DUCT WORK FOR AIR CONDITIONING
APPLICATION MANUAL
DA15 THE AUSTRALIAN INSTITUTE OF REFRIGERATION, AIR CONDITIONING AND HEATING
AIR FILTERS
APPLICATION MANUAL
DA21
THE AUSTRALIAN INSTITUTE OF REFRIGERATION, AIR CONDITIONING AND HEATING
AMMONIA
REFRIGERATION APPLICATION MANUAL
DA08
THE AUSTRALIAN INSTITUTE OF REFRIGERATION, AIR CONDITIONING AND HEATING
HVAC&R AN INTRODUCTION APPLICATION MANUAL AIR CONDITIONING WATER PIPING DA16
THE AUSTRALIAN INSTITUTE OF REFRIGERATION, AIR CONDITIONING AND HEATING
APPLICATION MANUAL
DA24
THE AUSTRALIAN INSTITUTE OF REFRIGERATION, AIR CONDITIONING AND HEATING
WATER SYSTEM
BALANCING APPLICATION MANUAL
AIR CONDITIONING LOAD ESTI MATION
DA09
THE AUSTRALIAN INSTITUTE OF REFRIGERATION, AIR CONDITIONING AND HEATING
APPLICATION MANUAL
DA17
THE AUSTRALIAN INSTITUTE OF REFRIGER ATION, AIR CONDITIONING AND HEATING
COOLING TOWERS
APPLICATION MANUAL
DA26 THE AUSTRALIAN INSTITUTE OF REFRIGERATION, AIR CONDITIONING AND HEATING
INDOOR AIR QUALITY
Application Manuals in this series:
DA01Centrifugal Pumps
– selection and applica
tion
DA02Noise Contr
ol in and ar
ound buildings
DA03 Ductwork
for air conditio ning DA08HVAC&R an introduction DA09Load Estimation and psychr ometrics DA11Steam – distribution and condensate r ecovery DA13 Fans
– selection and appl ication
DA15Air Filters
– selection and a pplication
DA16Water Piping
for air condit ioning DA17Cooling T owers DA18 Water T reatment DA19 HVAC&R Maintenance DA20Humid T ropical air co nditioning DA21Ammonia Refrigeration
DA24Water System Balan
cing
DA26 Indoor Air Quality
DA28Building Management
and Contr ol Systems
(BMCS)
DA29Evaporative Air Coo
ling Systems
DA
DA
DA11
11
11
LIAN IN LIAN IN LIAN INSTSTSTITUTE OF REITUTE OF REITUTE OF REFRIGERFRIGERFRIGERATATATION, AIR ION, AIR ION, AIR COCOCONDITIONING AND HENDITIONING AND HENDITIONING AND HEATATATINININGGGSTEAM STEAM STEAM AND CONDENSATEAND CONDENSATEAND CONDENSATE
TTT
18
18
18
28 BUILDING M ANAGEM ENT & CON TROL SY STEMS BUILDIN G MANA GEMENT & CON TROL SY STEMS DA28 ••• 62 ••• 63 as-installed drawings reflect what has been co
rrected to gain a m
ore efficient and m anageable build
ing system. 10.9. Sy stem manag ement 10.9.1. S yste m access It is im
portant to decide who has access to th
e BMCS controls. The follow
ing stakeholders generally nee d some form of access to system settings: • System operators – Day to d ay operational tasks. • Main
tenance providers
– System
interrogation, m onitoring. • Build
ing tuning team
– Fine tunin g control loops • Specialist or vend
or representatives – Updates and fixes. The le
vel of access and au thority to m
ake changes mu
st be clearly id entifi
ed and defined for each individual. 10.9 .2. Change m anagement It is im portant for BM CS, or any DDC control system
, that a formal ch
ange management system is put in place. Unau
thoris ed changes and quick
fixes are common reas
ons why system controls o
perate inefficiently. Only specified p
eople should be given access to the BMCS and the respon sibility or authorit y for ch anging controls settin gs, control routin es, and controls logic should be nom
inated.
Control s ettings
– Changing set points and targets, room tem
perature settin gs, set back tem
peratures.
Control routines – Changing parameters ass
ociated with system s control philoso
phy.
Con trol logic – Changin
g code in the con
troller programming. When making change
s to system operatin g controls or settings, it is importa
nt to con sider all of the consequences of the ch
ange made. The system should be set up to record and show
who was logged onto the system, what ch
anges if any were m ade, and the underlying reas ons why the ch anges were m ade. Documen ting cha nges Ideally a building tunin
g plan should be in p lace to introduce a standardised p
rocess for managing ch anges to the control system. All ch
anges that are authorised should be fully documented and the building documentation and BM
CS inform ation updated as appropriate. 10.9
.4. Verify ing systems Even with strong polici
es in place, it may be diffi
cult to gu
arantee that unauthorised ch anges have not been made and it is worthw
hile to periodically verify and sign off that rogue control strategies or ch
anges have not been implemented.
10.10. Po st oc cupancy evalu ation Also term
ed building performance evalu ation, this activity focuses on d
etermining how well the building is m
eeting its define d operatin
g requirements a nd assesses the le
vel of satisfaction or dissatis faction of b
uilding occupants
and users. Post occupancy evaluation usua
lly focuse s on e
nergy usage figu
res and occupant evaluation surveys, although criteria w
ill vary from faci lity to facil
ity. Any evaluation p
rocess needs to include a form al evaluation of the buildin
g performance information and survey results, generally by
a tunin g or building performance team. some form of review to adjust system s to the specific requirem ents. Where no particular ch anges have occurred, systems will still need to be fin
etuned. Minor ch anges may lead to a recom
missionin g program whereas
major changes in the o
perating requirements m ay lead to system or buildin g retrocommiss ioning. • Fine tun ing as detailed in the buildin g tuning m anual. • procedureRecomms asissio utilisninged for the original comm issioning program. • Retrocom missioning – Uses ne w tests and procedure
s developed specifically for the new or m odified system. 10.12. Re commiss ioning Recomm issionin g begins w ith a review of th e project operating requirements (POR) to determ
ine what, if any, changes have occurred. The POR needs to be updated or confirmed prior to any recommissionin
g activities com
mencing. If ch
anges have occurred, syste ms are review
ed to establish if corre
sponding changes to equipm ent, controls or operation procedures are required. Syste ms are th en fully surveye d and a lis t of findin gs or issues c ompiled. System trend logs or functional perform
ance tests may be used to determin
e if the system s meet the perform
ance defined in the reviewed an
d updated pro ject operating requirem ents (POR). 10.13. Up grades Replacem
ent strategy – scheduling th e replacement of inefficient equipment with m
odern high efficiency alternatives (always review the lo
ad requirements for changes).
This A ppendix provides a b
road overview of co ntrol system fundamen tals and expla ins so me of the com mon terms used when discuss
ing control systems. For m ore detailed techni cal inform ation on any o f thi s material refer to CIBSE Guide H Building Control Systems or sim
ilar publications. Manual co
ntrol requires direct c ontrol of a system by hum
an intervention. Automatic controls
function w ithout direct hum
an intervention once set in motion. Automatic controls act to maintain
a predetermin ed set point in resp onse to changin g conditio ns. At its most fundam
ental, a control system
com prises a sensor, a controller, a controlled device, a process, and a feedback
to the system. Close
d loop syste ms have a direct feedback via
the sensor; open loop systems have no direct feedb
ack. The set point is the desired or pre
-set value of the variable fo r the feedback
loop to compare against, e.g. th
e temperature of a space or the pressure of a fl uid. Figure A1: Basic co ntrol loop A sensor detects and m easures a v ariable an d sends this inform
ation to the controller. Sensors typically m
easure tem
perature, pressure, humidity, veloc ity, flow, illuminance, movement, substance concentration, elec
trical resistance, or elec
tronic voltage. Sensor output bec omes controller input. The controller
receives the inform ation from the sensor and uses a pre set logic or control algorithm
to compute an output sign
al which it sends to the controlled device. Controller o
utput becomes con trolled device input. The controlled device
receives the inform ation
from the contr
oller and acts on it to make the required ch
ange to the system
. Exam ples of controlled devices are modulating
valves and dampers, lightin g dimmers, varia
ble speed motors (that drive fans, pumps and com
pressors), e lectrical or electronic switches and cap
acitors. A sensor, controller and co
ntrolled device can all live in the same box or they can be in three separate places. They need to be conn
ected to commu nicate, conn
ections can be wired or wireless. S
ensor output becom es controller in put and controll er output becom es device input. A therm
ostat is both a sensor and a controller; a therm
ostatic valve is a sensor, a controller and a controlled devic
e. The load or process typically includ
es building ventila
tion, c ooling, heatin
g, lightin g, transport, and security a ccess. Figure A2: D DC inputs and outputs A direct actin
g control action m eans
the output increases with increases in
the m easured v
ariable. A reverse acting control
action m eans the output decreases as
the m easured variable increases. Examples of controllers are
thermostats, program mable timers, microp
rocessor controls, direct dig ital control systems (DDC), a
nd buildin g management and control systems (BMCS). How the controller functions, its in
ternal logic, determin
es the relationship between the controllers input and output. Thi
s is called the control res ponse. Typical control resp
onses employ ed in build
ing HVAC are: •Two
position
– This is essentially an o n/off control based on the speci
fied set point and diff erential. The o utput is o ff when th e set poin t is reach ed, and o
n when the difference betw een the set point and the m
easured v ariable (th
e differential) reach es the speci fied value. Controls fundame ntals App endix A C CD Cooling Coil S Controller Controlled Device Chilled Water Supply Chilled Water Return Controlled Medium (Air t emperature) Normally Open Sensor C S Controller Into DDC Out of D DC OUTPUT LOGIC INPUT CD Controlled Device Sensor AAAPPLPPLPPL
DA
DA
DA
THE THE THE AUAUAUSTSTSTRARARALIAN INLIAN INLIAN INSTSTSTITUTE OF REITUTE OF REITUTE OF REHV HV HVACACAC HVAC HV HV HVAC HVAC HVAC HV HV HVAC
HV &R&R&R AN AN AN
TER PIPI TER PIPI TER PIPINGNGNG
16
16
16
NDITIONING AND HE NDITIONING AND HE NDITIONING AND HEATATATINININGGGDA
DA
DA
THE THE THE AUAUAUSTSTSTRARARALIAN INLIAN INLIAN INSTEAM STEAM STEAM ITUTE OF RE
ITUTE OF RE ITUTE OF REFRIGERFRIGERFRIGERATATATION, AIR ION, AIR ION, AIR COCOCONDITIONING AND HENDITIONING AND HENDITIONING AND HEATATATINININGGG
PPL PPL PPLICICICATATAT
DA
DA
DA08
08
08
DA08
DA
DA
DA08
DA08
DA08
DA
DA
DA08
DA
ITUTE OF RE ITUTE OF RE ITUTE OF REFRIGERFRIGERFRIGERATATATION, AIR ION, AIR ION, AIR COCOCONDITIONING AND HENDITIONING AND HENDITIONING AND HEATATATINININGGGAN AN
AN INININTRODUCTITRODUCTITRODUCTIONONON
DA
DA
DA17
17
17
DA17
DA
DA
DA17
DA17
DA17
DA
DA
DA17
DA
COOLINGCOOLINGCOOLING TOTOTOWEWEWERSRSRS28 BUILDING M ANAGEM ENT & CON TROL SY STEMS BUILDIN G MANA GEMENT & CON TROL SY STEMS ••• 62 as-in stalled drawings reflect what has been co
rrected to gain a m
ore efficient and m anageable build
ing system. 10.9. Sy stem manag ement 10.9.1. S yste m access It is im portant to decide who has access
to th e BMCS controls. The follow
ing stakeholders generally nee d some form of access to system settings: • System operators – Day to d ay operational tasks. • Main
tenance providers
– System interrogation, m
onitoring. • Build
ing tuning team
– Fine tunin g control loops • Specialist or vend
or representatives
– Updates and fixes. The le
vel of access and au thority to m
ake changes mu
st be clearly id entifi
ed and defined for each individual. 10.9.2. Change m anagement It is im portant for BM
CS, or any DDC control system , that a formal ch
ange management system is put in place. Unau
thoris ed changes and quick
fixes are common reas
ons why system controls o
perate inefficiently. Only specified p
eople should be given access to the BMCS and the respon sibility or authorit y for ch anging controls settin gs, control routin es, and controls logic should be nom
inated.
Control s ettings
– Changing set points and targets, room tem
perature settin gs, set back tem
peratures.
Control routines – Changing parameters ass
ociated with system s control philoso
phy.
Con trol logic – Changin
g code in the con
troller programming. When making change
s to system operating controls or settings, it is importa
nt to con sider all of the consequences of the ch
ange made. The system should be set up to record and show
who was logged onto the system, what ch
anges if any were m ade, and the underlying reas ons why the ch anges were m ade. Documen ting cha nges
Ideally a building tunin g plan should be in p
lace to introduce a standardised p
rocess for managing ch anges to the control system. All ch
anges that are authorised should be fully documented and the building documentation and BM
CS inform ation updated as appropriate.
10.9.4. Verifying
systems
Even with strong polici es in
place, it may be diffi cult to gu
arantee that unauthorised ch anges have not been made and it is worthw
hile to periodically verify and sign off that rogue control strategies or ch
anges have not been implemented.
10.10. Po st oc cupancy evalu ation Also term ed building performance evalu
ation, this activity focuses on d
eterminin g how w
ell the building is m
eeting its define d operatin
g requirements a nd assesses the le
vel of satisfaction or dissatis faction of b
uilding occupants
and users. Post occupancy evaluation usua
lly focuse s on e
nergy usage figu
res and occupant evaluation surveys, although criteria w
ill vary from faci lity to facil
ity. Any evaluation p
rocess needs to incl ude a formal evaluation of the buildin
g performance information and survey results, generally by
a tunin g or building performance team. some form of review to adjust system s to the specific requirem ents. Where no particular ch anges have occurred, systems will still need to be fin
etuned. Minor ch anges may lead to a recom
missionin g program whereas
major changes in the o
perating requirements m ay lead to system or buildin g retrocommiss ioning. • Fine tun ing as detailed in the buildin g tuning m anual. • procedureRecomms asissio utilisninged for the original comm issioning program. • Retrocom missioning – Uses ne w tests and procedure
s developed specifically for the new or m odified system. 10.12. Re commiss ioning Recomm issionin g begins w ith a review of th e project operating requirements (POR) to determ
ine what, if any, changes have occurred. The POR needs to be updated or confirmed prior to any recommissionin
g activities com
mencing. If ch
anges have occurred, syste ms are review
ed to establish if corre
sponding changes to equipm ent, controls or operation procedures are required. Syste ms are th en fully surveye d and a lis t of findin gs or issues c ompiled. System trend logs or functional perform
ance tests may be used to determin
e if the system s meet the perform
ance defined in the reviewed an
d updated pro ject operating requirem ents (POR). 10.13. Up grades Replacem ent strategy – scheduling th
e replacement of inefficient equipment with m
odern high efficiency alternatives (always review the lo
ad requirements for changes).
This A ppendix provides a b
road overview of co ntrol system fundamen tals and expla ins so me of the com mon terms used when discuss
ing control systems. For m ore detailed techni cal inform ation on any o f thi s material refer to CIBSE Guide H Building Control Systems or sim
ilar publications.
Manual co ntrol requires direct c
ontrol of a system by
Manual co ntrol requires direct c
ontrol of a system by
Manual co ntrol
hum an intervention.
Automatic controls
function w ithout direct hum
an intervention once set in motion. Automatic controls act to maintain
a predetermin ed set point in resp onse to changin g conditio ns. At its most fundam
ental, a
control system
com prises a sensor, a controller, a controlled device, a process, and a feedback
to the system.
Close d loop systems have a direct feedback via
the sensor; open loop
systems have no direct feedb
ack. The
set point is the desired
set point is the desired
set point
or pre -set value of the variable fo
r the feedback loop to compare against, e.g. th
e temperature of a space or the pressure of a fl uid. Figure A1: Basic co ntrol loop A sensor detects and m easures a v ariable an d sends this inform
ation to the controller. Sensors typically m easure tem
perature, pressure, humidity, veloc ity, flow, illuminance, movement, substance concentration, elec
trical resistance, or elec
tronic voltage. Sensor output bec omes controller input. The controller
receives the inform ation from the sensor
controller
receives the inform ation from the sensor
controller
and uses a pre set logic or control algorithm to compute an output sign
al which it sends to the controlled device. Controller o
utput becomes con trolled device input. The controlled device
receives the inform ation
from the contr
oller and acts on it to make the required ch ange to the system
. Exam ples of controlled devices are modulating
security a ccess. A direct actin
g control action m eans
the output increases with increases in
the m easured v
ariable. A reverse acting control
action m eans the output
reverse acting control
action m eans the output
reverse acting control
decreases as the m
easured variable increases. Examples of controllers are
thermostats, program mable timers, microp
rocessor controls, direct dig ital control systems (DDC), a
nd buildin g management and control systems (BMCS). How the controller functions, its in
ternal logic, determin
es the relationship between the co input and output. Thi
s is called the control res ponse
Typical control resp onses employ
ed in build ing HVAC are: •Two
position
– This is essentially an o n/off control based on the speci
fied set point and diff erential. The o utput is o ff when th e set poin t is reached, and o
n when the difference betw een the set point and the m
easured v ariable (th
e differential) reach es the speci fied value. App endixA C CD Cooling Coil S Controller Controlled Device Chilled Water Supply Chilled Water Return Controlled Medium (Air t emperature) Normally Open Sensor S LOGIC INPUT Sensor APPLICATION M ANUAL
DA
28
BUILDING MANAGEMEN T AND CONTROL SYSTEMS (BMCS)THE AUSTRALIAN
INSTITUTE OF RE FRIGERATION, A IR CONDITIONIN G AND HEATING
26
26
26
NDITIONING AND HE NDITIONING AND HE NDITIONING AND HEATATATINININGGGQUALITY QUALITY QUALITY
EvaporativE air Coolin g SyStEmS
DA29
•••
11
EvaporativE air Coolin g SyStEmS
n efficiency of the evaporative air referred to as effectiveness) is a measure of the effectiveness of the wate
r/air heat exchange process within the unit. Effective water distribution over the evaporative media is essential for optimised system operation. As th
e contact between the air and water improves so too does the efficiency of the system and the cooling output. The bigger
the area of contact between the air and water, the more evaporation takes place resulting in more cooling. T
he speed of the air passing through the wetted m
edia also affects contact time and evaporation efficiency. Tests to determine the evaporation efficiency are carried out in accordance w
ith AS 2913; this is the core o
f the standard.
2.2.5. Rated s ound power
The rated soun d power is the radiated sound power level of the evaporative air cooler measured during the evaporative efficiency tests in a
ccordance with AS 2913.
This sound power data is useful for comparing different makes and models but, to evaluate acceptability for particular installa
tions, the sound pressure levels need to be calculated and this requires more information about the unit, t
he location and some further calculations.
2.2.6. Rated e lectrical consumption
The rated electrical consumption of the evaporative air cooler is measured during th
e evaporative efficiency tests and reported in accordance with AS 2913.
2.3. Wet bulb temperature and humidity
Evaporative air c oolers rely on the difference between the wet bulb and the dry bulb temperatures for their cooling effect. The wet bulb temperature is different from the dry bulb temperature that we are used to considering. The wet bulb temperature is a function of the dry bulb temperature an
d the moisture content of the air. It is easily measured using an instrument such as a sling p
sychrometer; it can be calculated from air dry bulb temperature an
d relative humidity data or read dir
ectly off a psychrometric chart.
5 10 10 15 15 20 20 25 A = Line of saturation B = L ines of constant r elative humidity C = L
ines of constant temperature D = Lines of constant energy E
= Lines of constant water content 25 30 30 35 40 45 50 5 10 15 20 25 30 80%
Dew Point Temperature
Dry Bulb Temperature °C Relative Humiidty % M ois ture C on te nt g /kg We t Bulb and Dew P oint Te mpera ture °C Enthalpy kJ/kg Wet B ulb Tempera ture D ry B ulb T em p er atu re 60% 40% 20% B C D E A
Evaporative Cooling Pyschro metric Chart
The difference b etween the wet bulb and the dry bulb temperatures of the outdoor air is called the Wet bulb Depression (WBD). A p
roperly designed and installed evaporative air coolin
g system can reduce the dry bulb temperature of the outdoor air by a factor equivalent to the rated evaporation efficiency of the evaporative air c
ooler, multiplied by the wet bulb depression of the outdoor air. For example, for a direct evaporative air cooler rated at 80% evaporative efficiency and w
ith a wet bulb depression of 12°C, the evaporative air cooler should reduce a 34°C outdoor dry bulb temperature to:
34 – (0.80 x 12) = 34 – 9.60 = 24.4°C
In this case the e vaporative air cooler will reduce the outdoor air temperature by 80% of the 12 degrees available, resulting in a 9.6 degree drop and a supply air temperature from the evaporative air cooler o
f 24.4 degrees. Evaporation efficiencies of parti
cular units will vary between brand, model and pad types and are determined in accordance with AS 2913. If the unit evaporation efficiency in this ex
ample was 85% the supply air temperature would be 23.8°C; if it was 90% the supply air temperature would be 23.2°C. It is the supply air temperature, in
conjunction with the supply air quantity delivered by
the unit, that determines the room temperature that can be achieved or the cooling capacity of the system under those specified conditions. From an evaporative air cooling performance point of view the wet bulb depression a
vailable from the outdoor air conditions will dictate the system cooling potential; the greater the difference between the two tem
peratures,
the greater the evaporative cooling effect. The wet bulb depression is often the limiting factor when considering comfort or relie
f cooling applications. Wet bulb temp
erature, dry bulb temperature, humidity and moisture content can all be represented on a psychrometric chart (see fi
gure 2.1). The chart includes lines of constant dry bulb (vertical) constant wet bulb (diagonal) and relative humidity
(curved) or humidity ratio (kg water/k
g air). The 100% relative humidity curve is the saturation line.
2.4. Evaporative air cooler type
Even though evaporative air cooling applications have been around for much of human history the technology employed in evaporative air co
oling systems is constantly in development with innovative technical solutions and improvements frequently being applied. The t
hree types of evaporative a
ir cooler used in Australia can be broadly described as follows: • Direct • Indirect • Two stage
2.4.1 Direct evaporative air coolers
These are the sim plest, oldest and most widespread type of evaporative air cooler applied. The system uses a fan to draw air over wetted pads and delivers the cooled air into the conditio
ned space either directly or via an air distribution system. Warm dry air is converted to cool moist air as the heat in the air e
vaporates the water.
Figure 2.1: Psychrometric chart
Figure 2.2: Direct evaporative air coolers outdoor air fan reservoir evaporative pa ds /media pump water s upply 1 3 2 5 5 10 10 15 15 20 20 25 25 30 30 35404550 5 10 15 20 25 30 80%
Dry Bulb Temperature °C Relative Humidity % M oisture C ontent g /kg 60% 40% 20% 2 1 Direct C ooling
Wet Bulb and D ew Point Temperature °C
100%
Typical arrangement
Psychrometrics
Air enters at condition 1. Air leaves wet pads and is supplied to room at condition 2. Air discharges from space at condition 3 and dissipates to atmosphere at condition 1.
THE THE THE ION MANU ION MANU ION MANUALALAL
DA
DA
DA
THE THE THE AUAUAUSTSTSTRARARALIAN INLIAN INLIAN INEvaporativEair Cooling SyStE
n efficiency of the evaporative air referred to as effectiveness) is a measure of the effectiveness of the wate
r/air heat exchange process within the unit. Effective water distribution over the evaporative media is essential for optimised system operation. As th
e contact between the air and water improves so too does the efficiency of the system and the cooling output. The bigger
the area of contact between the air and water, the more evaporation takes place resulting in more cooling. T
he speed of the air passing through the wetted m
edia also affects contact time and evaporation efficiency. Tests to determine the evaporation efficiency are carried out in accordance w
ith AS 2913; this is the core o
f the standard.
2.2.5. Rated s ound power
The rated soun d power is the radiated sound power level of the evaporative air cooler measured during the evaporative efficiency tests in a
ccordance with AS 2913.
This sound power data is useful for comparing different makes and models but, to evaluate acceptability for particular installa
tions, the sound pressure levels need to be calculated and this requires more information about the unit, t
he location and some further calculations.
2.2.6. Rated e lectrical consumption
The rated electrical consumption of the evaporative air cooler is measured during th
e evaporative efficiency tests and reported in accordance with AS 2913.
2.3. Wet bulb temperature and humidity
Evaporative air c oolers rely on the difference between the wet bulb and the dry bulb temperatures for their cooling effect. The wet bulb temperature is different from the dry bulb temperature that we are used to considering. The wet bulb temperature is a function of the dry bulb temperature an
d the moisture content of the air. It is easily measured using an instrument such as a sling p
sychrometer; it can be calculated from air dry bulb temperature an
d relative humidity data or read dir
ectly off a psychrometric chart.
5 10 10 15 15 20 20 25 A = Line of saturation B = L ines of constant r elative humidity C = L
ines of constant temperature D = Lines of constant energy E
= Lines of constant water content 25 30 30 35 40 45 50 5 10 15 20 25 30 80%
Dew Point Temperature
Dry Bulb Temperature °C Relative Humiidty % M ois ture C on te nt g /kg We t Bulb and Dew P oint Te mpera ture °C Enthalpy kJ/kg Wet B ulb Tempera ture D ry B ulb T em p er atu re 60% 40% 20% B C D E A
Evaporative Cooling Pyschro metric Chart
Figure 2.1: Psychrometric chart
APPLICATION MANUAL EVAPORATIVE
AIR COOLING SYSTEMS
THE AUSTR ALIAN INSTITUTE OF REFRIGER ATION, AIR CONDITIONING AND HE ATING