Received 14 Nov 2016
|
Accepted 24 May 2017
|
Published 5 Jul 2017
Brain network dynamics in high-functioning
individuals with autism
Takamitsu Watanabe
1
& Geraint Rees
1,2
Theoretically, autism should be underpinned by aberrant brain dynamics. However, how brain
activity changes over time in individuals with autism spectrum disorder (ASD) remains
unknown. Here we characterize brain dynamics in autism using an energy-landscape analysis
applied to resting-state fMRI data. Whereas neurotypical brain activity frequently transits
between two major brain states via an intermediate state, high-functioning adults with ASD
show fewer neural transitions due to an unstable intermediate state, and these infrequent
transitions predict the severity of autism. Moreover, in contrast to the controls whose IQ is
correlated with the neural transition frequency, IQ scores of individuals with ASD are instead
predicted by the stability of their brain dynamics. Finally, such brain–behaviour associations
are related to functional segregation between brain networks. These findings suggest that
atypical functional coordination in the brains of adults with ASD underpins overly stable
neural dynamics, which supports both their ASD symptoms and cognitive abilities.
DOI: 10.1038/ncomms16048
OPEN
1Institute of Cognitive Neuroscience, University College London, 17 Queen Square, London WC1N 3AR, UK.2Wellcome Trust Centre for Neuroimaging,
University College London, 12 Queen Square, London WC1N 3BG, UK. Correspondence and requests for materials should be addressed to T.W. (email: [email protected]).
C
oordinated whole-brain neural dynamics are essential for
proper control of functionally different brain systems
1–6,
efficient
integration
of
complex
and
multimodal
information
7–9, and smooth adaption to transient daily-life
situations
6,10. Given such integrative roles of macroscopic brain
dynamics in our cognitive and neural information processing, it is
reasonable to assume that the aberrance of large-scale neural
dynamics is a key biological mechanism underlying autism
spectrum disorder (ASD)
10,11, which is often explained as
impairment of global information processing
12,13.
Despite such neurobiological and aetiological importance,
temporal changes in whole-brain neural activity patterns in
autism remain understudied
10. Previous neuroimaging studies
examining the brains of individuals with ASD reported
aberrant
responses
in
focal
brain
regions
14–18,
atypical
functional/anatomical brain network architectures
18–22and
disturbed
neural
synchronization
between
specific
brain
areas
11,23,24. Although a recent study has found atypical
temporal interactions between different brain networks in
individuals with autism and associated them with their aberrant
behavioural inflexibility
25, how whole-brain neural activity
patterns change over time in individuals with ASD is still
poorly understood. Thus, the relationships between such brain
dynamics and ASD symptoms remain to be identified.
Here we aim to characterize such large-scale brain dynamics in
autism and specify the associations between the neural dynamics
and autistic behaviours by exploiting energy-landscape
analy-sis
26–28. We adopt this analysis because it can automatically
identify relatively stable and dominant brain activity patterns in
high-dimensional neural data without any
a priori
behavioural
information, and illustrate brain dynamics as staying in and
transitions between such dominant brain states.
This data-driven method reveals that brains of individuals with
ASD show fewer neural transitions compared to those of
neurotypical controls, and such atypically stable brain dynamics
underlie both core symptoms in ASD and general cognitive
ability. In addition, we find that the neural dynamics are
supported by specific functional coordination between large-scale
brain networks.
Results
Accuracy of model fitting. We analysed publicly shared
resting-state functional magnetic resonance imaging (fMRI) data
29from
24 high-functioning adults with ASD and 26
age-/sex-/IQ-matched typically developing (TD) individuals (Table 1). We
used a data set collected at a single site (University of Utah) to
avoid adverse effects of multisite recording.
To investigate dynamic coordination between functionally
different brain systems, we first prepared a time series of average
fMRI signals of seven functional brain networks
30(Fig. 1a,b). We
then binarized the seven network activities, and fitted a pairwize
maximum entropy model (MEM)
26,27,31to them (Supplementary
Fig. 1). This model could accurately predict the empirical data in
both the TD and ASD groups (accuracy
Z
96.4%,
r
126Z
0.98,
P
o
10
5in a test of no correlation; Fig. 1f).
Dominant brain states. Next, based on this accurately fitted
model, we specified dominant brain states that occurred
fre-quently enough to represent brain activity patterns during rest
(Fig. 1c). Technically, we calculated so-called energy values of all
the possible brain activity patterns (2
7patterns; Fig. 1g),
exam-ined hierarchal relationships between the 2
7energy values and
systematically searched for dominant brain activity patterns that
showed locally minimum energy values and were more likely to
be observed than similar activity patterns
26,27(Fig. 1c). Note that
this energy value does not indicate any biological energy; rather, it
is a statistical index inversely indicating the appearance
probability of each brain activity pattern. For example, activity
patterns with lower energy values tend to appear more frequently
and should be stable.
We found that the TD and ASD groups had energy landscapes
with similar hierarchal structures (Fig. 2a) consisting of the same
six locally stable brain activity patterns (local minima A–F;
Fig. 2b). In both cohorts, the local minima A and B belonged to
the same branch, and the local minima C and D were in another
branch. Moreover, compared to these four local minima, energy
values of the local minima E and F were relatively high, which
suggests that these two local minima were not so dominant and
stable as the other four.
On the basis of such hierarchal characteristics and similarity
between the two groups, we summarized these six local minima
into two major brain states (local minima A and B to the major
state #1; local minima C and D to the major state #2) and two
minor states (local minima E and F to the minor state #1 and #2,
respectively; Fig. 2a).
Such an accurate model fitting and the hierarchal structures
of energy landscapes were preserved when we changed the
threshold for the binarization of brain activity (Supplementary
Fig. 2).
Table 1 | Demographic data.
TD ASD Pvalue
Number of participants 26 24 –
Age 25.3±6.3 (18.2–39.3) years 25.3±5.5 (18.4–38.9) years 0.96
Sex Male Male –
Handedness Right Right –
Full IQ* 112.6±12.0 (89–131) 109.9±14.2 (90–134) 0.47 Verbal IQ 112.1±12.1 (88–127) 107.5±14.2 (83–130) 0.22 Performance IQ 110.3±10.4 (90–125) 110.25±16.0 (83–133) 0.98 Mean head motion 1.2±0.6 (0.34–2.9) mm 1.3±0.8 (0.28–2.8) mm 0.41 ADOS total 1.2±1.4 (0–4)w 12.8±3.6 (6–21) o1014 ADOS social 0.5±0.7 (0–2)w 4.8±2.1 (2–13) 0.001 ADOS communication 0.7±0.9 (0–3)w 7.0±2.3 (4–11) o1010
ADOS RRB 0w 1.1±1.1 (0–3) o1014
ADOS, Autism diagnostic observation schedule; ASD, autism spectrum disorder; IQ, intelligence quotient; Max, maximum; Min, minimum; RRB, restricted and repetitive behaviour; TD, typically developing; WASI-III, Wechsler abbreviated scale of intelligence.
Mean±s.d. (Min–Max).
*IQ was measured based on WAIS-III.
Sizes of the dominant brain states. We then quantified the
dominance of these major and minor states by calculating
how large an area was occupied by each brain state in
an energy landscape (that is, the size of ‘Brain state’ shown in
Fig. 1c).
In the TD group, the two minor brain states occupied
B
10% of
the entire energy landscape (minor state #1: 11.7%, minor state
#2: 10.9%), whereas those in the ASD group occupied only
B
1.6% (minor state #1: 1.56%, minor state #2: 1.43%). These
distributions of the brain state size were significantly different
between
the
two
groups
(w
3¼
21.9,
P
o
10
4in
a
w
2-test; Fig. 2c), and the sizes of the minor states were
significantly smaller in the ASD group than in the controls
(
Z
4
3.1,
P
uncorrectedo
0.0019,
P
Bonferronio
0.05 in
post hoc
residual
tests).
Such differences in the brain state size were confirmed by
directly counting the appearance frequency of each brain state in
the empirical data. The two major brain states appeared more
frequently in the ASD group than in the TD group (
t
484
7.8,
P
uncorrectedo
10
9,
P
Bonferronio
0.05
in
two-sample
t
-tests,
P
¼
0.0001 in permutation tests, Cohen’s
d
Z
2.0; Fig. 2d), whereas
the two minor states showed significantly less appearance
frequency in the ASD group (
t
484
10.6,
P
uncorrectedo
10
13,
P
Bonferronio
0.05 in two-sample
t
-tests,
P
¼
0.0001 in permutation
tests, Cohen’s
d
Z
2.4; Fig. 2e).
These results suggest that the minor brain states are
atypically unstable and infrequently appeared in individuals with
ASD.
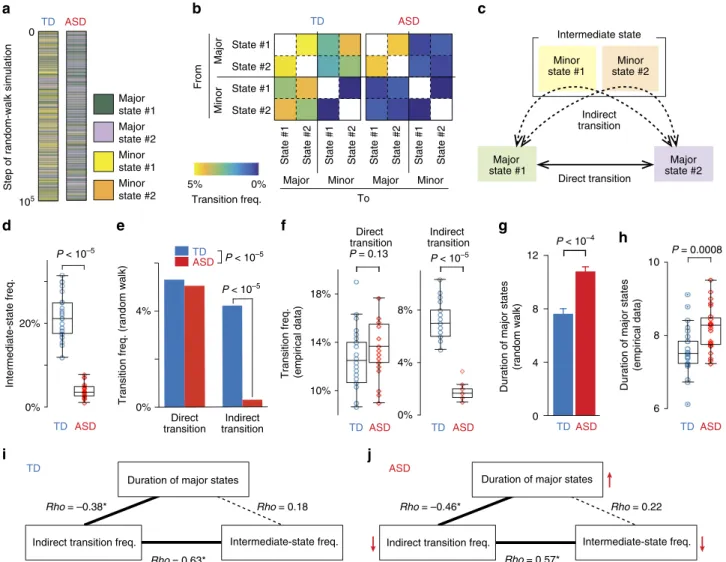
Characterization of brain dynamics. Next, we performed 10
5-step random-walk numerical simulation in the energy
land-scape
26(Fig. 3a), and characterized brain dynamics as staying in,
or transitioning between, these dominant brain states (Fig. 1d).
First, we calculated the transition frequency between the four
brain states (Fig. 3b), and found no direct transition between the
two minor states for both the TD and ASD groups. Therefore, we
categorized neural transitions into either of the following two
types of trajectory: a direct transition between the two major
brain states or an indirect transition between the two major states
via one of the two minor states (Fig. 3c). To simplify descriptions,
we hereafter aggregated the two minor brain states into one state
called an intermediate state. As with the minor brain states
(Fig. 2e), the appearance frequency of this intermediate state was
Appearance prob. (model)
Appearance prob. (empirical data)
Brain activity pattern #1
Brain activity pattern #27 r = 0.99 Accuracy = 96.7% r = 0.98 Accuracy = 96.4% 10–1 10–2 10–3 10–4 10–4 10–3 10–2 10–1 10–3 10–4 10–2 10–1 10–3 10–4 10–2 10–1 TD ASD
g
Fronto-parietal network (FPN)Default mode network (DMN)
b
d
e
Salience network (SAN)
Somatosensory and motor network (SMN) Visual network
Auditory network (Aud) Attention network (ATN): dorsal/ventral attention networks + cingulo-opercular network
DMN ROI 1 activity DMN ROI 2 activity
Mean FPN activity
Mean Aud activity Mean DMN activity FPN ROI 1 activity
FPN ROI 2 activity
Aud ROI 1 activity Aud ROI 2 activity Extract network activity
Compare the brain dynamics with behaviours/symptoms Local min I
Identify dominant brain states in the energy landscape
Energy Appearance prob. Large High Brain state I Brain state II Brain state III
Local min II Local min III
Appearance prob.
High Low Characterize brain dynamics
by random-walk simulation Brain network activity pattern
Brain dynamics index
Behaivoural score
Energy values Brain activity pattern
TD ASD
DMNFPNSANATNSMNVisualAuditory
0 Energy –1.5 Active Inactive
a
c
f
Figure 1 | Procedures of energy-landscape analysis.(a–e) We first extracted resting-state fMRI signals from 214 whole-brain ROIs30(a), classified the ROIs into seven functionally different brain systems30and calculated their average network activity (b). By applying a pairwise maximum entropy model to the fMRI data, we built an energy landscape and identified dominant brain states (c). After characterizing brain dynamics through random-walk simulation (d), we compared several brain dynamic indices with behavioural/symptom scores (e). (f) In both the TD and ASD groups, the pairwise maximum entropy model showed sufficiently high goodness of fit, and could accurately predict appearance probability (Prob.) of empirical data. (g) Accurate model fitting enabled us to accurately infer hypothetical energy values of all the possible 27brain activity patterns. Note that the energy values do not represent any biological energy, but inversely indicate the appearance probability of the brain activity patterns. That is, a brain activity pattern with a smaller energy value should appear more often. Freq., frequency.
significantly smaller in the ASD group than in the controls
(
t
48¼
20.3,
P
uncorrectedo
10
5in a two-sample
t
-test,
P
¼
0.0002
in a permutation test, Cohen’s
d
¼
3.5; Fig. 3d).
We then compared the frequency of these direct and indirect
transitions between the TD and ASD groups. The direct
transition frequency was not different between the two groups,
whereas the indirect transition frequency was significantly
reduced in the ASD individuals compared to the controls
(w
2¼
283.6,
P
o
10
5in a
w
2-test;
Z
¼
16.8,
P
uncorrectedo
10
5,
P
Bonferronio
0.05 in a
post hoc
residual test; Fig. 3e). This contrast
was reproduced even when we counted each transition frequency
in the empirical fMRI data (Fig. 3f): no significant difference was
seen in the direct transition frequency (
t
48¼
1.5,
P
¼
0.13 in a
two-sample
t
-test,
P
¼
0.14 in a permutation test, Cohen’s
d
¼
0.17), whereas the indirect transition frequency was
sig-nificantly lower in the ASD group (
t
48¼
14.0,
P
uncorrectedo
10
5,
P
Bonferronio
0.05 in a two-sample
t
-test,
P
¼
0.0001 in a
permuta-tion test, Cohen’s
d
¼
5.0).
Such atypically infrequent neural transitions in ASD
indivi-duals imply that their brain dynamics are more stable than those
of the controls, and thus their brain activity tends to stay in the
major states longer. This implication was confirmed by
calculat-ing how long a brain activity pattern stayed in either of the two
major states. In this random-walk simulation, the ASD brains
showed significantly longer duration of the major states than TD
brains (
t
8735¼
3.9,
P
o
10
4in a two-sample
t
-test,
P
¼
0.0001 in
a permutation test, Cohen’s
d
¼
3.1; Fig. 3g). This difference was
reproduced in direct counting of the repetition length of the
major states in the empirical data (
t
48¼
3.6,
P
¼
0.0008 in a
two-sample
t
-test,
P
¼
0.0013 in a permutation test, Cohen’s
d
¼
1.0;
Fig. 3h).
Finally, we examined hierarchical relationships between the
three brain dynamics indices that were sensitive to autism (that is,
the indirect transition frequency, intermediate-state frequency
and duration of the major states). Partial correlation analyses
showed that in both the TD (Fig. 3i) and ASD groups (Fig. 3j) the
intermediate-state frequency was positively associated with the
indirect transitions (rho
4
0.57,
P
o
0.0044, df
Z
22 in tests of no
correlation), and the indirect transition frequency was inversely
correlated with the duration of the major states (rho
o
–0.38,
P
o
0.042, df
Z
22 in tests of no correlation).
Taken together, these analyses suggest that in the brains of
individuals with ASD, atypically unstable intermediate states were
related to a reduction in the indirect transition frequency, which
was associated with aberrantly long durations of the major brain
states (Fig. 3j). In both the TD and ASD groups, these three brain
dynamic indices were not significantly correlated with the ages of
the individuals (|
r
|
r
0.18,
P
Z
0.37, df
Z
22 in tests of no
correlation; Supplementary Table 1).
Brain dynamics and symptoms of autism. We then examined
whether these indices of brain dynamics were related to
symp-toms of autism, as measured by the Autism Diagnostic
Obser-vation Schedule (ADOS)
32.
In the ASD group, the indirect transition frequency was
negatively correlated with ADOS total scores (
r
22¼
–0.47,
P
uncorrected¼
0.01,
P
Bonferronio
0.05 in a test of no correlation;
Fig. 4a), whereas the duration of the major states did not show a
significant correlation (
r
¼
–0.09). Even in the TD group, the
indirect transition frequency was significantly smaller in the
individuals with higher ADOS scores (ADOS total
¼
2–4) than in
P < 10–4 P = 0.0011* P = 0.0019* Siz e of br ain state Appear ance freq. Appear ance freq. 0 –0.8 –1.6 60% 40% 60% 40% 0 8% 16% 0 8% 16% 0 20% 40% TD TD A A A B B B C C C E E E F F F D D D DMN FPN SAN ATN SMN Auditory Visual Active Major state #1 Minor state #1 Minor state #1 Minor state #2 Minor state #2 Major state #1 Major state #2 Major state #2 Inactive Local min Minor state #1 Minor state #2 Major state #1 Major state #2 ASD ASD P < 10–11* P < 10–9* P < 10–13* P < 10–16* TDASDTDASD TDASD TDASD
Energy Appear ance freq. High Low Dominance of br ain states Low High Minor state #1 Minor state #2 Major state #1 Major state #2 0 –0.8 –1.6
a
b
c
d
e
Figure 2 | Comparison of energy-landscape structures.(a,b) Energy landscapes of the TD and ASD groups showed a similar hierarchal structure (a) with the same six local minima (b). Given the low energy barriers commonly seen in the two groups, we summarized local minima A and B to the major state #1 and local minima C and D to the major state #2. (c) The size of the four dominant states showed significant differences between the TD and ASD groups. In particular, the two minor brain states were significantly smaller in the ASD individuals than in the controls. *PBonferronio105. (d,e) Such differences in brain state sizes were confirmed in the empirical data. In the ASD group, the appearance frequency of the two major states was larger (d) and that of the two minor states was smaller (e) than in the TD group. *PBonferronio105.
those with lower ADOS scores (ADOS total
¼
0–1;
t
16¼
2.6,
P
¼
0.019 in a two-sample
t
-test; Supplementary Fig. 3), while the
duration of the major states was not significantly different
between the TD individuals with higher and lower ADOS scores
(
P
4
0.56). This brain–symptom association was not specific to
either of the social or non-social core symptoms of autism
(Supplementary Fig. 4).
In addition, a partial correlation analysis revealed a hierarchical
relationship between ADOS scores, the indirect transition
frequency and the appearance frequency of the two local minima
in the intermediate state (Fig. 4b).
These observations indicate that the atypically unstable
intermediate state in the brains of individuals with ASD is
related to the reduction in the indirect transitions, and such
aberrant decreases in brain dynamics flexibility are associated
with the severity of ASD symptoms.
Brain dynamics and general cognitive ability. Second, we
examined associations between brain dynamics and general
cognitive ability that was measured as full intelligence quotient
(FIQ) scores
33–35.
In the TD group, FIQ scores were specifically correlated with
the indirect transition frequency (
r
24¼
0.46,
P
uncorrected¼
0.014,
P
Bonferronio
0.05 in a test of no correlation; Fig. 4c). In addition, a
partial correlation analysis identified a hierarchal relationship
between FIQ, the indirect transition frequency and the
appear-ance frequency of the two local minima constituting the
intermediate state (Fig. 4d). These results suggest that in TD
individuals the stability of the intermediate state is linked with an
increase in the indirect transitions, which in turn is associated
with their general cognitive skills (Fig. 5a).
In contrast, such an association between the indirect transition
frequency and FIQ was not found in the ASD group (
r
22¼
–0.25,
Major state #2 TD TD
a
b
c
e
d
f
g
h
Major Minor 5% Transition freq. 0 105 Intermediate state 0% State #1 State #2 State #1 State #2 FromStep of random-walk simulation
0% 0% 4% 10% 4% 8% 0% 14% 18% 10 8 6 TDASD
TD ASD TD ASD TDASD TD ASD
TD
ASD ASD
Duration of major states
(random walk)
Duration of major states
(empirical data)
Transition freq. (random walk)
Intermediate-state freq. Transition freq. (empirical data)
P = 0.0008 P = 0.13 P < 10–5 P < 10–5 P < 10–5 Direct transition Indirect transition Indirect transition To
Major Minor Major Minor
Major state #1 Minor state #1 Minor state #2 Major state #1 Major state #2 Minor state #1 Minor state #2 0 4 8 12 P < 10–4
j
i
Direct transition Direct transition Indirect transition Rho = –0.38* Rho = 0.63* Rho = 0.18 Duration of major statesASD
Rho = 0.57* State #1 State #2 State #1 State #2 State #1 State #2 State #1 State #2
P < 10–5 TD
ASD
Indirect transition freq. Intermediate-state freq.
Rho = –0.46* Rho = 0.22
Duration of major states
Indirect transition freq. Intermediate-state freq.
20%
Figure 3 | Brain dynamics.(a–d) To characterize brain dynamics in the energy landscape, we performed 105-step random-walk simulation (a). On the basis of this simulation, we first calculated the transition frequency between the four dominant brain states (b), and found no transition between minor states #1 and #2. Therefore, we could classify all transitions into direct transitions between the two major states or indirect transitions via one of the minor states (c). On the basis of such classification, we summarized the two minor states into the intermediate state. In the empirical data, the intermediate state was seen significantly less frequently in the ASD group compared to the controls (d). (e,f) In the simulation, the direct transition frequency was not significantly different between the TD and ASD groups, but the indirect transition frequency was significantly smaller in the ASD individuals (e). This contrast was reproduced even by direct counting of frequency of each type of transition in the empirical data (f). *PBonferroni-correctedo0.05. (g,h) The duration of staying in the major states was significantly longer in the ASD group (g), which was confirmed in direct counting of the empirical data (h). Error bar, s.d. (i,j). In both the TD and ASD groups, we found a negative partial correlation between the duration of the major states and the indirect transition frequency, a positive partial correlation between indirect transition frequency and the intermediate-state frequency. We could not detect a significant partial correlation between duration of the major states and the intermediate-state frequency.
P
¼
0.21 in a test of no correlation; left panel of Fig. 4c). Instead,
their FIQ scores were correlated with the duration of the major
states (
r
22¼
0.55,
P
uncorrected¼
0.004,
P
Bonferronio
0.05 in a test of
no correlation; right panel of Fig. 4c), which was mainly
determined by the appearance frequency of two of the four local
minima constituting the major states (local minimum A,
r
22¼
0.45,
P
uncorrected¼
0.024; local minimum C,
r
22¼
0.49,
P
uncorrected¼
0.012; both,
P
Bonferronio
0.05 within each major state
in tests of no correlation; Fig. 4e).
Taken together with the results of the partial correlation
analysis (Fig. 4f), these observations indicate that the general
cognitive ability of ASD individuals is associated with the stability
of their brain dynamics, which in turn are supported by the
atypically stable major brain states represented by the two specific
local minima (Fig. 5b).
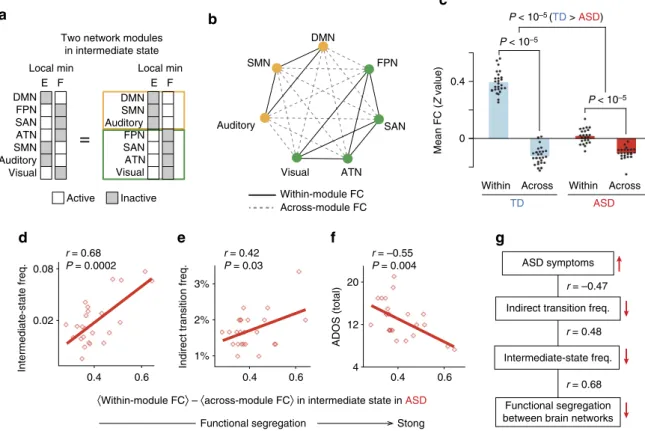
Brian network coordination related to symptoms of autism.
We then examined across-network functional coordination
underlying these associations between the stability/flexibility of
brain dynamics and ADOS/IQ scores.
First, we investigated across-network functional connectivity
(FC) underpinning the atypical reduction of the indirect
transition frequency (Fig. 6).
As shown in Fig. 4b, the larger frequency of the indirect
transition was associated with the higher appearance probability of
the two local minima constituting the intermediate state. On the
other hand, these local minima show complementary brain activity
patterns, and are based on anticorrelated activation of two network
modules (that is, Default-mode/Sensory-motor/Auditory (DMN/
SMN/Auditory) module and Fronto-parietal/Salience/Attention/
Visual (FPN/SAN/ATN/Visual) module; Fig. 6a). Given these
Rho = 0.43
Rho = 0.05 Rho = 0.04
Duration of major states
inASD
Duration of major states r = –0.47 P = 0.01 * * r = –0.09 P = 0.67 ASD r = –0.25 P = 0.21 ASD r = 0.55 P = 0.004* TD r = 0.46 P = 0.014* TD r = –0.12 P = 0.56 Indirect transition freq.
inASD
Indirect transition freq. 4 12 20 140 120 100 3% 1% 7 9 10 6 0% 10% ADOS (total) FIQ 4 12 20 140 120 100 P = 0.012 P = 0.014 Correlation coeff . ( r )
Appearance freq. versus duration of major states in ASD
0.4 0.2 0
B
A C D
Major state #1 Major state #2 P = 0.039 P = 0.031
* *
ASD
ASD
Local min Local min
Rho = –0.44* Rho = –0.44*
Rho = 0.39
TD
Intermediate state Indirect transition freq. Autism severity (ADOS score)
Appearance freq. of local min E Appearance freq. of local min F Rho = 0.51* Rho = 0.22 Rho = 0.10 Rho = 0.38* Rho = 0.38* Rho = 0.38* Intermediate state Indirect transition freq. General cognitive skill (FIQ)
Appearance freq. of local min E Appearance freq. of local min F Rho = 0.39* Rho = –0.07 Rho = –0.10 Rho = 0.55* Rho = 0.53* Rho = 0.42* Major states Duration of major states General cognitive skill (FIQ)
Appearance freq. of local min A Appearance freq. of local min C
a
b
c
d
e
f
Figure 4 | Associations between brain dynamics and behaviour.(a,b) In the ASD group, only the indirect transition frequency showed a significant correlation with severity of ASD symptoms (PBonferroni-correctedo0.05). (a) This correlation was preserved even after two outliers (squares circled by dashed lines) were removed (r¼–0.46). In addition, by partial correlation analysis, we found hierarchal structures between the ADOS total scores, the indirect transition frequency and the appearance frequency of the two local minima constituting the intermediate state (b), which suggests that the atypically unstable intermediate state is related to the infrequent indirect transition, and could be associated with the ASD symptoms. *Po0.05. (c–f) In the TD group, only the indirect transition frequency was correlated with their general cognitive ability (FIQ;PBonferroni-correctedo0.05,c). Partial correlation analysis showed a hierarchy between FIQ, the indirect transition frequency and the appearance frequency of the local minima in the intermediate state (d), which suggests that the stability of the intermediate state is related to increases in the indirect transition and enhancement of their cognitive skills. In contrast, FIQ of the individuals with ASD was correlated with duration of the major states (c). In addition, the duration of the major state was associated with the appearance frequency of two of the four local minima in the major states (e). These findings and results of partial correlation analysis indicate that the overly stable major states are associated with atypically long duration of the major states in the brains of individuals with ASD, which supports their cognitive ability (f). *Po0.05.
properties, we assumed that in ASD individuals atypically weak
segregation between the two network modules should be related to
the reduced appearance frequency of the intermediate state and the
decrease in the indirect transition frequency, which is consequently
associated with the deterioration of the ASD symptoms.
We tested this hypothesis by comparing within-module FCs to
across-module FCs (Fig. 6b) because, theoretically, the two network
modules should become more functionally segregated as the gap
between within-module and across-module FCs expands
8,36.
In both the TD and ASD groups, the within-module FCs were
significantly larger than the across-module FCs (
F
1,96¼
690.9,
P
o
10
5as a main effect of FC types in a two-way factorial
analysis of variance (ANOVA) with an (FC type:
within/across-module)
(Group: TD/ASD) structure; Fig. 6c).
However, the gap between the within- and across-module FCs
was significantly smaller in the ASD group compared to the
controls (
F
1,96¼
272.2,
P
o
10
5as an interaction in the two-way
factorial ANOVA;
t
48¼
13.1,
P
o
10
5in a
post hoc
two-sample
Intermediate state (local min E, F) Major state #1 (local min A) Major state #2 (local min C) Indirect transition TD ASD Indirect transition ∝ FIQ ∝ FIQ ∝ FIQ ∝ ADOS ∝ ADOS
Duration of major states Intermediate state (local min E, F) Major state #1 (local min A) Major state #2 (local min C)
a
b
Figure 5 | Brain dynamics and behaviour.In the TD individuals (a), the flexibility of their brain dynamics was correlated with their cognitive ability. In the ASD individuals (b), their atypical stability of brain dynamics was associated with both their ASD symptoms and cognitive skills. The brain maps represent binary brain activity patterns of the dominant brain states. Red areas were active regions (þ1), whereas the other areas were inactive regions (–1).
Within-module FC Across-module FC Local min
Two network modules in intermediate state Local min DMN DMN FPN SAN ATN FPN SAN ATN SMN SMN Auditory Auditory Visual Visual E F E F Active
Functional segregation Stong
Inactive 0.4 4 12 20 0.6 0.4 0.6 Within 0 0.4
Across Within Across
1% 2% 3%
a
c
b
d
e
f
g
ADOS (total)Indirect transition freq.
r = 0.42 P = 0.03 r = –0.55 P = 0.004 0.4 0.6 0.02 0.08 Intermediate-state freq. r = 0.68 P = 0.0002 Mean FC ( Z value) P < 10–5(TD >ASD) P < 10–5 P < 10–5 DMN FPN SAN ATN Visual SMN Auditory
=
TD ASD r = 0.68 r = 0.48 r = –0.47 Functional segregation between brain networks Intermediate-state freq. Indirect transition freq.ASD symptoms
〈Within-module FC〉 – 〈across-module FC〉 in intermediate state inASD
Figure 6 | Across-network functional segregation during intermediate state in autism.(a–c) The intermediate state was based on two modules that were complementary and anticorrelated with each other (DMN/SMN/Auditory module and FPN/SAN/ATN/Visual module;a). Thus, it is reasonable to assume that strong functional segregation between these modules should stabilize the intermediate state. To examine this hypothesis, we first quantified the functional segregation strength by comparing within-module FC with across-module FC (b), and found the functional segregation was significantly stronger in the TD group (c). (d–g) In the ASD group, the functional segregation strength was positively correlated with the intermediate-state frequency (d) and indirect transition frequency (e), and showed a negative association with ADOS total scores (f). Atypically weak across-network functional segregation may destabilize the intermediate state and reduce the indirect transition frequency, which might result in ASD symptoms (g).
t
-test,
P
¼
0.0001 in a
post hoc
permutation test, Cohen’s
d
¼
3.0; Fig. 6c), which suggests that the brains of ASD
individuals have weaker functional segregation between the two
brain modules.
This atypically weaker functional segregation was correlated
with the intermediate-state frequency (
r
22¼
0.68,
P
¼
0.0002 in a
test of no correlation; Fig. 6d) and the indirect transition
frequency (
r
22¼
0.42,
P
¼
0.03 in a test of no correlation; Fig. 6e).
Moreover, this functional segregation strength was inversely
associated with ADOS total scores (
r
22¼
–0.55,
P
¼
0.004 in a test
of no correlation; Fig. 6f). Such a significant association between
ADOS scores and the functional segregation strength was
observed even in the TD data (
t
16¼
2.5,
P
¼
0.025 in a
two-sample
t
-test,
P
¼
0.0001 in a
post hoc
permutation test, Cohen’s
d
¼
1.4; Supplementary Fig. 5a).
Considering these results with our other observations (Figs 4b
and 5b), the current findings indicate that aberrantly weak
functional segregation between specific brain modules is related
to the unstable intermediate state and fewer indirect transitions in
individuals with ASD, which stabilizes their brain dynamics and
in turn underlies the symptoms (Fig. 6g).
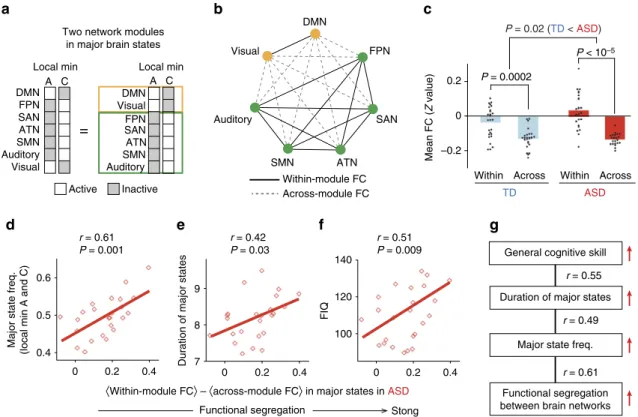
Brian network coordination related to cognitive ability. Next,
we examined across-network functional coordination that could
be related to the atypically long duration of the major states in the
individuals with ASD and underlie their general cognitive ability
(Fig. 7).
On the basis of the observation that the overly stable brain
dynamics in individuals with ASD were associated with the
aberrantly large appearance frequency of two complementary
local minima (Figs 4e and 7a), we assumed that these stable
dynamics were related to functional segregations between two
different network modules (DMN/Visual module and FPN/SAN/
ATN/SMN/Auditory module; Fig. 7b).
Although significant functional segregation was seen in both
the TD and ASD groups (
F
1,96¼
72.3,
P
o
10
5as a main effect
of FC types in a two-way factorial ANOVA; Fig. 7c), its strength
was significantly larger in the ASD individuals (
F
1,96¼
5.6,
P
¼
0.020 as an interaction in a two-way factorial ANOVA;
t
48¼
2.3,
P
¼
0.02 in a
post hoc
two-sample
t
-test,
P
¼
0.03 in a
post hoc
permutation test, Cohen’s
d
¼
0.63; Fig. 7c). Moreover,
this atypically strong functional segregation was positively
correlated with the major state frequency (
r
22¼
0.61,
P
¼
0.001
in a test of no correlation; Fig. 7d), the duration of the major
states (
r
22¼
0.42,
P
¼
0.03 in a test of no correlation; Fig. 7e)
and FIQ (
r
22¼
0.51,
P
¼
0.009 in a test of no correlation; Fig. 7f)
in autism. In contrast, the correlation between FIQ and the
functional segregation during the major states was not positive
but significantly negative in the TD data (
r
24¼
–0.44,
P
¼
0.023;
Supplementary Fig. 5b), suggesting that high-functioning
individuals with ASD have different cognitive styles compared
to TD individuals
37–39.
These results indicate that atypically strong functional
segregation in the brains of individuals with ASD is associated
with the aberrantly stable major brain states and atypically long
duration of staying in the states, which is consequently correlated
with their general cognitive skills (Fig. 7g).
According to the same logic, we confirmed that in the TD
group strong functional segregation between
DMN/SMN/Audi-tory module and FPN/SAN/ATN/Visual module (Figs 6c and 8a)
was associated with the large appearance frequency of the
intermediate state and the indirect transition, which in turn was
related to their high IQ scores (Fig. 8b,c).
Auditory 0 0.2 0.4 0 0.2 0.4 0 0.2 0.4 0.4 9 8 7 0.5 0.6
d
e
f
120 140 100Duration of major states
FIQ
Major state freq.
(local min A and C) r = 0.61 P = 0.001 r = 0.42 P = 0.03 r = 0.51 P = 0.009 Within-module FC Across-module FC
Local min Local min
DMN DMN FPN SAN ATN SANFPN ATN SMN SMN Auditory Auditory Visual Visual A C A C Active Inactive
a
b
c
DMN FPN SAN 0 0.2 –0.2 ATN SMN Visual=
Two network modules in major brain states
Mean FC ( Z value) P = 0.02 (TD < ASD) P = 0.0002 P < 10–5
g
Within Across Within Across
TD ASD
r = 0.61 r = 0.49 r = 0.55
Functional segregation between brain networks
Major state freq. Duration of major states
General cognitive skill
Functional segregation Stong
〈Within-module FC〉 – 〈across-module FC〉 in major states inASD
Figure 7 | Across-network functional segregation during major brain states in autism.(a–c) We assumed that the stability of the major states should be underpinned by functional segregation between a DMN/Visual module and an FPN/SAN/ATN/SMN/Auditory module (a,b). The across-network functional segregation was significantly stronger in the ASD group than in the controls (c). (d–g) In the ASD group, the atypically strong functional segregation was correlated with the major state frequency (d), the duration of the major states (e) and the FIQ scores (f). These results imply that aberrantly strong functional segregation in autism overly may stabilize brain dynamics, which would be related to their cognitive skills (g).
Reproducibility tests. We confirmed the robustness of the
find-ings using two independent data sets collected in Indiana
Uni-versity (Supplementary Table 2) and ETH Zu¨rich (Supplementary
Table 3). In both data sets, a pairwise MEM was accurately fitted
(Supplementary Figs 6a and 8a), and energy-landscape analyses
yielded qualitatively the same hierarchal structures of the energy
landscapes, consisting of the same six brain states (Supplementary
Figs 6b and 8b). In addition, significant differences in the major/
intermediate-state frequency between TD and ASD groups were
also reproduced (Supplementary Figs 6c and 8c). Moreover, we
could identify the atypically lower indirect transition frequency
and aberrantly longer duration of the major states in the ASD
groups (Supplementary Figs 6d–g and 8d–g). Finally, we
con-firmed that the correlations between brain dynamics and
beha-vioural indices were reproduced (Supplementary Figs 6h–j and
8h–j), and the associations between these brain dynamics and
across-network functional coordination were also replicated
(Supplementary Figs 7 and 9).
We also tested whether the current observations were robust
across different definitions of brain networks. To this end, we
repeated the energy-landscape analyses after the brain was
parcellated in two different manners
40,41.
In one of the brain parcellation methods, the DMN was divided
into two subnetworks according to a previous study
40(see
Methods for details). Although the accuracy of the model fitting
was slightly reduced (82.1% for TD and 80.7% for ASD), we
observed qualitatively the same energy landscapes, brain
dynamics and brain–behaviour associations as seen in the
original analyses (Supplementary Fig. 10).
In the other brain parcellation method, the cortical area was
divided into a different set of seven brain systems based on
another previous study
41(Supplementary Fig. 11a). Even with
this brain parcellation scheme, we observed qualitatively the
energy-landscape structures (Supplementary Fig. 11b), and found
that the neural dynamics of individuals with ASD were more
stable than those of the control (Supplementary Fig. 11c–g). This
neural stability showed positive correlations with the severity of
tASD symptoms and general cognitive ability (Supplementary
Fig. 11h–j). These brain–behaviour associations were attributable
to the strength of functional segregation between the seven brain
systems (Supplementary Fig. 11k–n).
Prediction of diagnosis of autism. We then examined whether
such differences in brain dynamics can predict the diagnosis of
autism (Fig. 9 and Supplementary Fig. 12). We first defined a
threshold for the diagnosis using the original data set (University
of Utah data), and then evaluated the performance of this
diag-nostic approach by applying it to the independent data sets
(Indiana University and ETH Zu¨rich data). For the test data, the
energy-landscape analysis was performed not at a group but at an
individual level, and, therefore, the results were not exactly the
same as those obtained in the above reproducibility test.
The intermediate-state frequency could predict the ASD diagnosis
with relatively high accuracy (sensitivity
¼
84%, specificity
¼
85%;
Fig. 9a). In contrast, the indirect transition frequency did not realize
such accurate prediction (sensitivity
¼
68%, specificity
¼
74%;
Fig. 9b). We could improve the diagnosis accuracy by combining
the two indices in a multivariate pattern analysis method
(sensitivity
¼
89%, specificity
¼
93%; Fig. 9c,d). This classification
accuracy is comparable to or higher than the diagnostic accuracy
reported by previous resting-state fMRI studies (for example,
sensitivity
¼
67–83%, specificity
¼
75–100%)
42–44.
Discussion
Using energy-landscape analysis, we elucidated atypical
resting-state brain dynamics underlying the symptoms and general
cognitive ability of high-functioning ASD individuals. Brain
dynamics seen in the TD and ASD groups commonly consisted of
direct transitions between the two major states and indirect
transitions via the intermediate state. However, the indirect
transition in the ASD group was aberrantly infrequent because of
their unstable intermediate state, and their brain activity was
likely to stay in the major states for atypically long durations.
Such aberrant reduction in the indirect transitions was related to
the severity of autism, whereas the long duration of the major
states was correlated with IQ scores in the ASD group.
Moreover, the overly stable brain dynamics of the individuals
with ASD were linked to aberrant coordination between
functionally different brain systems. These findings indicate
that, in high-functioning ASD adults, the atypical balance of
large-scale brain systems is associated with aberrantly stable brain
dynamics, which underlies both their ASD symptoms and general
cognitive ability.
This study provides empirical evidence for the concept that
autism can be characterized by atypical large-scale brain
dynamics
11. Although previous human neuroimaging studies
reported the disturbance of neural synchrony in individuals with
ASD
24,45,46and identified a variety of structural/functional
whole-brain architectures specific to ASD
18–20,47, most of them
did not directly investigate brain dynamics. Exceptionally, a
recent fMRI study using Granger causality analysis investigated
patterns of temporal interactions between different brain regions
120 100 0.4 0.6 0.4 0.6 6% 10% FIQ
Indirect transition freq.
r = 0.44 P = 0.02 r = 0.46 P = 0.018 0.4 0.6 0.1 0.3 Intermediate-state freq. r = 0.80 P < 10–5 Within-module FC Across-module FC Functional segregation in intermediate state
a
b
c
DMN FPN SAN ATN Visual SMN Auditory〈
Within-module FC〉
–〈
across-module FC〉
in intermediate state inTD r = 0.80r = 0.55 r = 0.46
Functional segregation between brain networks Intermediate-state freq. Indirect transition freq. General cognitive skill
Functional segregation Stong
Figure 8 | Associations between across-network functional coordination and brain dynamics in TD.We confirmed that such across-network functional segregation underlay the brain dynamics of neurotypical individuals. Here we calculated the strength of functional segregation related to the intermediate state (a), and showed significant correlations between the functional segregation strength and (i) the intermediate-state frequency, (ii) the indirect transition frequency and (iii) FIQ scores (b). These results suggest that in TD individuals functional segregation between the specific two network modules may stabilize the intermediate state and ensure the flexibility of brain dynamics, which would be associated with general cognitive ability (c).
and reported atypically stable temporal changes in FC
25.
However, even this study did not examine how neural states
stay in and transit between different activity patterns over time.
In contrast, the current study has characterized such temporal
changes
in
whole-brain
activity
patterns,
and
directly
demonstrated the associations between atypical brain dynamics
seen in ASD individuals and their symptoms.
Such a critical link between symptoms and brain dynamics is
not limited to autism, but has been reported in recent human
fMRI studies on schizophrenia
48,49. For example, patients with
schizophrenia and healthy controls showed similar static brain
states, but exhibited significant differences in the dwell time in
specific brain states and transition frequencies between such brain
states
48. Given such prior observations, the current study can be
seen as additional empirical support that highlights the
importance of investigating brain dynamics in biological
understanding
of
various
developmental
and
psychiatric
disorders
11,50.
The atypical across-network functional coordination seen in
the ASD group is consistent with previous observations of
atypical across-region FCs in autism
51–53. A previous
resting-state fMRI study reported atypical reduction in FC between the
amygdala, which is often included in SAN, and secondary visual
area
51. If this observation implies a weak FC between SAN and
the visual network, it matches the current findings about weak
segregation during the intermediate state and strong segregation
during the major states in autism. According to the same logic,
the current results are consistent with another resting-state fMRI
study
52reporting an atypical decrease in the FC between a
temporal region (auditory network) and a medial prefrontal area
(DMN) in autism. In addition, our results are consistent with a
task-based fMRI study that found weak functional coupling
between a visual area and a region in FPN in high-functioning
ASD adults
53.
The current study has also identified brain dynamics associated
with the general cognitive ability in neurotypical adults. The
general cognitive ability in the TD participants was positively
associated with the flexibility of the brain dynamics, and such
flexible brain dynamics were underpinned by the increased
functional segregation during the intermediate state and the
decreased functional segregation during the major states. This
functional coordination during the major and intermediate states
may enable the control of diverse cognitive functions in an
integrative manner. Theoretically, smooth integration of
func-tionally different brain systems should be vital for binding diverse
perceptual information and achieving better cognitive
perfor-mance in a changing environment
4,6,36,54. Empirically, several
neuroimaging studies have suggested that such an integration
process is achieved by frequent transitions between different
brain states
8,55. Considering the current results with these
theoretical and empirical observations, we can speculate that
the functional coordination seen in the TD group may contribute
to integrative information processing by facilitating transitions
between different brain activity states.
In contrast, the general cognitive ability in autism was
associated with the stability of the brain dynamics, not with the
flexibility, which could fit the unique cognitive style of
high-functioning
ASD
individuals
37–39.
Behaviourally,
high-functioning individuals with ASD are likely to show
above-average performance when tasks they are engaged in require
detail-focused rather than global information processing
12,56.
This behavioural tendency matches the overly stable brain
dynamics observed in this study, if, as suggested in a previous
study
8, the stability of brain dynamics is related to one’s capability
of repeating the same cognitive process. The current findings may
become a new foundation for a biological understanding of
autism-specific cognitive styles.
One of the limitations of this study is that we did not examine
associations between brain dynamics and subcategories of the
general cognitive ability. This was because the data set did not
have other cognitive performance scores other than IQ. Although
IQ has been used as a valid index of human general cognitive
ability
34–36, it would be necessary to examine brain dynamics
underlying
more
specific
cognitive
skills
by
employing
appropriate psychological tasks.
We also need to be careful not to conclude that the aberrantly
stable brain dynamics of autism are related to every aspect of
the disorder. Both the social and non-social core symptoms of
ASD showed similar effect sizes for brain–symptom
associa-tions in this study, but non-social symptoms could be more
relevant to such neurophysiological inflexibility
10,25. To clarify
this issue, it would be necessary to apply the current
energy-landscape analysis to task-based neuroimaging data of
individuals with ASD.
a
Sensitivity = 84%b
Specificity = 85% 0% 20% 40% Intermediate-state freq.Intermediate-state freq. Intermediate-state freq.
4% 20% 40% 8% 0% 0% 0% 20% 40% 4% 8% 10% 0%
Indirect transition freq.
Indirect transition freq. Indirect transition freq. Sensitivity = 78% Specificity= 77% Sensitivity = 89% Specificity= 93% Indiana Univ. Univ. of Utah Training data Test data ETH Zürich Indiana Univ. Univ. of Utah TD TD (ETH Zürich) TD (Indiana Univ) ASD
ASD (Indiana Univ) ASD (ETH Zürich) TD ASD Training data Training (Univ. of Utah) Test
(Indiana Univ. and ETH Zürich)
Test data ETH Zürich
c
d
4% 8% 10% 0%Figure 9 | Diagnosis prediction.The thresholds for the diagnostic prediction were defined in the training data, and subsequently evaluated in the independent test data (Supplementary Fig. 10). The two indices of brain dynamics for the test data were calculated for each participant. Therefore, the accuracy of model fit in the energy-landscape analysis (ca.80%) was not so high as in the group-level analysis (ca.95%). (a,b) The cutoff values for the univariate diagnosis predictions were 7.7% for the intermediate-state frequency (a) and 4.15% for the indirect transition frequency (b). (c,d). The cutoff line for the bivariate prediction (purple line;c) was defined by training a linear support vector machine with the University of Utah data set. This line could classify individuals in the independent data sets with a relatively high accuracy (d). Univ., University.
Another limitation of our work concerns potential heterogeneity
in the ASD group
57. We focused on high-functioning, right-handed
male adults without any psychiatric comorbidity including attention
deficit hyperactivity disorder (ADHD), but this approach could not
control all between-participant differences. In fact, some recent
studies have reported that neural responses in autism could be
affected by genetic patterns
58,59, and other studies have shown
significant diversity in executive function within ASD individuals
60.
Moreover, such heterogeneity could be larger in the ASD group
than in the controls
57. Consistent with this, we observed more
outliers in our ASD data than the control data: the ASD data had
seven outliers (
4
or
o
mean
±
2 s.d.) in the appearance frequencies
of the major/minor brain states, whereas the TD data had no
outliers. Therefore, the current observations will need to be further
examined in more genetically and behaviourally homogeneous
subgroups of ASD.
Our analytic approach also had some methodological
limita-tions. We classified cortical regions into the seven systems, and
examined system-level brain dynamics. Although similar
approx-imations have yielded biologically meaningful observations in
other
neuroimaging
studies
2,3,5,7,
such
system-level
summarization of brain signals may lose detailed and nuanced
information that should be seen at, for example, a finer 2-mm
3voxel level
61. Therefore, it would be necessary to examine the
current observations with finer spatial resolution and with a
larger number of regions of interest.
Our work has identified atypical brain dynamics of
high-functioning adults with ASD by applying energy-landscape
analyses to resting-state fMRI data. This data-driven approach
has revealed that brains of ASD individuals are less dynamic than
those of neurotypical controls, and such overly stable neural
dynamics underlie core symptoms of ASD. In addition, we have
shown that—in contrast to neurotypical individuals—such
aber-rantly stable brain dynamics do not impair but rather support
general cognitive ability in ASD. Moreover, we have found that
specific across-network functional coordination underpins such
atypically stable brain dynamics in autism. These findings indicate
the possibility that atypical brain dynamics might be a key
biological endophenotype of ASD, and show that investigating
brain dynamics can potentially make substantial contributions to
our understanding of neural mechanisms underlying various
typical/atypical behaviours and cognitive abilities.
Methods
Participants
.
The current study used resting-state fMRI and anatomical MRI data shared in ABIDE29. To exclude effects of multiple recording sites, we analysed neuroimaging data collected in a single site (here University of Utah). This recording site was chosen because their data had the largest number of high-functioning adult males with ASD.We selected participants based on their age (18rager40), sex (male), handedness (right-handed), IQ (80rfull/verbal/performance IQr140), and head motion during echo planar imaging (EPI) recording (mean head motionr3 mm). To reduce confounding effects of age on IQ, we set the upper limit of the age at 40. Male participants were chosen because the number of female participants was substantially smaller than that of male participants in the data set, and it was practically impossible to balance the female/male proportion. Intelligence of the participants was quantified by the four subtests of the Wechsler Abbreviated Scale of Intelligence, and their handedness was evaluated by the Edinburgh Handedness Inventory. The mean head motion was measured in preprocessing procedures of EPI data (see section on ‘Data Preprocessing’ below).
As a result of this selection, this study used data obtained from 24 high-functioning adult males with ASD and 26 age-/sex-/IQ-matched neurotypical individuals (Table 1).
The ASD participants were diagnosed by a clinical autism expert in accordance with ADOS32and Diagnostic and Statistical Manual of Mental Disorders, Fourth Edition, Text Revision (DSM-IV-TR). In this data set, 16 of the 26 TD individuals were given their ADOS scores.
This data collection was approved by the local ethic committee of
the recording site (University of Utah IRB), and all participants signed a written consent.
Neuroimaging data
.
The MRI data were collected in a 3T scanner (Magnetom Trio, Siemens). Resting-state fMRI data were recorded with an EPI sequence (TR 2 s, TE 28 ms, 40 slices, interleaved, flip angle 90°, spatial resolution 3.4 3.43.0 mm), whereas anatomical images were taken with T1-weighted sequence (repetition time (TR) 2.3 s, echo time (TE) 2.91 ms, flip angle 9°, spatial resolution 1.01.01.2 mm). For each participant, the EPI data were recorded inB8 min, while participants were instructed to relax with their eyes open.Data preprocessing
.
These EPI data were preprocessed with SPM12 (www.fil.u-cl.ac.uk/spm) in essentially the same manner as in our previous study applying the energy-landscape analysis to resting-state fMRI data26,27: after discarding the first five images, the data underwent realignment, unwarping, slice timing correction, normalization to the standard template (ICBM 152) and spatial smoothing (Gaussian kernel with 8 mm of full-width at half maximum). We then removed effects of head motion, white matter signals, cerebrospinal fluid signals and global signal. Finally, we performed band-pass temporal filtering (0.01–0.1 Hz).We then extracted a time series of fMRI signals from each of 214 regions of interest (ROIs) that were selected from the 264 ROIs listed in the previous studies30. The other 50 ROIs were not adopted here because they were labelled ‘Uncertain’ or ‘Subcortical’ and did not constitute specific cortical networks. The 214 cortical ROIs were defined as 4-mm spheres around the centre coordinates that were determined in the previous studies30. On the basis of these prior studies, we then classified the ROIs into seven functionally different brain networks (Fig. 1a). For each participant, we calculated seven time series data that represent average network activity of the seven brain networks (Fig. 1b). For the following energy-landscape analysis, we then binarized the network activity data in each participant using the average brain activity value26,27,31,62. Technically, in each participant, we first calculated the average brain activity for each network and binarized the original brain activity using the average activity as a threshold. Finally, we concatenated them across participants. As a result, for each of the TD and ASD group, we obtained seven binary time series data representing seven network activity (þ1 for active,1 for inactive). This binarization process enabled us to balance the number of active state and that of inactive state for each network, which could reduce the risk of overfitting in the following analysis63.
The dorsal/ventral attention networks and cingulo-opercular network were merged into the ATN because (i) the current data size is not enough to perform energy-landscape analysis with nine factors and (ii) these three networks are considered to be responsible for the similar attention-related cognitive activity30. In fact, in the binary form, brain activity patterns of these three networks were significantly similar to each other (Z71% in TD,Z73% in ASD,Pr105in one-samplet-tests across participants; Supplementary Fig. 13a,b), whereas those of the other networks did not show such high similarity (o58%). In addition, even after we divided the ATN into cingulo-opercular network and the other two systems (dorsal/ventral attention networks), we observed qualitatively the same energy landscapes with the same six local minima (Supplementary Fig. 13c,d). These results are considered to justify our merging the three networks into one system.
These network activity patterns sufficiently represented the activity of cortical brain regions that the networks cover. In all the seven networks, the similarity between the binary network activity and neural activity of its constituent ROIs was significantly high across participant (mean similarityZ69%,Po104in a binominal test; Supplementary Fig. 14a). We can see such high similarity even at a voxel level across participant (mean similarityZ66%,Po103; Supplementary Fig. 14b).
The similarity between brain activityXiandXjwas calculated as NT XiX2 j
=NT, whereXiwere vectors representing time series of the binarized neural activities (1 for active, 0 for inactive) of brain networki(or ROIi) andNTdenoted the length ofXi.
Model fitting
.
As a preparation for the following energy-landscape analysis, we fitted a pairwise MEM to the seven binary time series data in essentially the same manner as in previous studies26,27,31,62.First, every network activity pattern at timetwas described such as Vt¼ st
1;st2;. . .;stN
;wherest
irepresents a binary activity of networkiat timet (that is,st
i¼ þ1 or1) andNis the number of the networks (that is,N¼7, here, Fig. 1a). According to the principle of maximum entropy64, when the mean network activityhsiiand the mean pairwise interactionhsisjiare constrained by the empirical data, the appearance probabilityP(Vk) of a network activity pattern Vkshould obey Boltzmann distribution64, because such a distribution maximizes the information entropy64. That is, the appearance probability should be stated as
P Vkð Þ ¼eE Vð kÞ=2N i¼1e E VðkÞ; ð1Þ where E Vkð Þ ¼ N i¼1hisiðVkÞ 1 2 N i¼1Nj¼1;j6¼iJijsiðVkÞsjðVkÞ: ð2Þ Heresi(Vk) is the binarized activity of networkiin the activity patternVk, whereas hirepresents basal activity of networkiandJijindicates a pairwise interaction between networksiandj.
Using thisP(Vk), we could calculate the model-based mean network activity hsiim¼2
N