Design of DC Microgrid Based on Photovoltaic
Power Supply System
1
Risalin Lyngdoh Mairang,
2Bikramjit Goswami
1,2Department of Electrical and Electronics Engineering, School of Technology, Assam Don Bosco University Airport Road, Azara, Guwahati - 781017, Assam, INDIA
1
Abstract: This paper describes the possibilities of the application of DC Microgrids to solve the energy problem in the country.DC Microgrids open a gateway for the integration of solar energy, which is an efficient and cleaner way of renewable energy generation, which can be integrated into the power distribution network. DC microgrid is an intelligent mix of smart grid and renewable source with an increase in the efficiency of energy. Therefore, very little energy is wasted during distribution and transmission. It has several other advantages, which include - reduction in transmission losses, improvement in power quality & reliability, reduction in emissions and even it is cost-effective. The circuit for solar power availability sensing and switching to battery supply is done on hardware. Design of DC microgrid from solar energy is done in MATLAB/SIMULINK. The most important characteristic is that it provides a possibility for electrification of remote villages which are far from the reach of the conventional grid.
Keywords:DC Microgrid, Solar, MATLAB, Arduino.
1. Introduction
Renewable energy plays an important role in the global energy sector. Renewable energy sources which are also known as non-conventional type of energy, are the sources which are continuously replenished by natural processes. The primary concerns on the use of energy sources are the day-to-day increasing power demand [1]. However, the problem with the non-renewable energy sources such as coal, natural gases and oil is that they are decreasing day by day and not getting replenished, therefore after a few years, their reserve will be empty. Hence renewable energy sources become important. Additional advantages that they are pollution-free and it is environmentally friendly, which reduces the harmful gas emission to the surroundings. Once renewable energy technologies become more dominant, then energy would be produced anywhere without adversely affecting the environment [2].
DC microgrid comprises dc power generation, dc electrical storage, dc power distribution, etc. Converting that dc into synchronised ac for grid remains a challenge. Multiple rooftop micro generations can be connected together to form the microgrid. A microgrid is one of the new conceptual power systems for the smooth installation of many distributed generations (DGs) [3].
2. PV Modules Performance
The solar panel is kept exposed to direct sunlight to measure the solar panel voltage output with the help of a multi-meter, as shown in Figure 1.
Figure 1: Circuit diagram used for measurement of voltage
Figure 2 shows the circuit diagram of power measurement with variable load resistance with the help of a multi-meter, which gives different values of output power.
Figure 2: Power measurement circuit
2.1 Modelling of PV Array
When a solar cell is exposed to sunlight, then a current which is proportional to solar irradiation is generated. A simple ideal solar cell can be modelled in a circuit as a current source connected
Solar Panel V +
-
+
to a diode in parallel. As no cell is ideal so for accurate modelling, there are shunt and series resistance connected [4]. The equivalent circuit is shown in figure 3.
Figure 3: Equivalent model of PV cell The current source Ig represents the current generated by the irradiation of sunlight, Id is the Shockley diode current, Rs and Rp are used to represent the intrinsic series and shunt resistance of the cell respectively. Usually, the value of Rp is very large, and that of Rs is very small, hence they may be neglected to simplify the analysis.
The mathematical equations for this model [5-6] can be given as:
I
pv=
I
m−
I
sh (1)Current through shunt resistor,
I
sh=
V
+
I
pvR
sR
p (2)I
m=
I
g−
I
d (3)
n i gn gG
G
T
K
+
I
=
I
(4) Where, Ig – PV generated current.Ign – Nominal generated current Ki – Current coefficient
G – Solar insolation
Gn - Nominal solar insolation
∆
T
=T
amb−
T
nom (5)Tamb – Ambient temperature Tnom– Nominal temperature
1
exp
0
t v ocn i scnaV
T
K
+
V
T
K
+
I
=
I
(6)I0 – reverse saturation current of diode. Iscn– Nominal short circuit current
Kv – Voltage coefficient
Vocn – Nominal short circuit voltage
1
exp
0
n
V
R
I
+
V
I
=
I
t s pv d (7)Id– Shockley diode current
n – Diode ideality constant
The value of the diode constant n may be arbitrarily chosen. Usually, 1 ≤ n ≤ 1.5 and the choice depend on other parameters of the I-V model. Rs – Series resistance
q
KT
N
V
S amb t
(8)V
t– Thermal voltage of the array Ns – No. of cell in seriesK –Boltzman’s constant q – Electron charge
V
d=
V
pv+
I
pv× R
s (9)Vpv – Photovoltaic voltage Ipv – Photovoltaic current
Pyranometer is used for measuring solar irradiance, but it is very costly; therefore, another way to measure the solar irradiance can be used by the following formula:
I
scG
cal=
I
calG
STC (10)Where,
Isc – Rated short circuit current
Ical – Short circuit current measured by the Ammeter
GSTC – Irradiance at Standard Test Condition (STC) Gcal – irradiance to be calculated
2.2 Simulation Model of PV Array
The PV array has been designed in MATLAB/Simulation software taken into consideration its dependence upon the irradiance, temperature, number of PV cells connected in series and parallel. The PV array has been modelled using the equations (1) – (9). The detailed internal circuit of the PV array is given below:
Figure 4: Complete simulation model of PV cell The M-file for Ig function has been developed using the equation (4) and that for the I0 function using equation (6).
Figure 5: Simulation model of Ig
Figure 6: Simulation model of I0
The current to voltage characteristic of a solar array is non-linear, which makes it difficult to determine the MPP. Figure 7 and figure 8 give the characteristic of I-V and P-V curve for a fixed level of solar irradiation and temperature.
Figure 7: I-V curve
Figure 8: P-V curve
3. Proposed Solar Power Component
of the Microgrid
The block diagram of the proposed solar power component of the microgrid consists of solar cells, Arduino microcontroller, relays, battery, battery charger and load.
According to the block diagram given in Figure 9, the algorithm can be described as when the solar panel voltage is greater than the threshold voltage; then relay 1 is switched on. As long as the load current is less than the maximum current that can be obtained from the solar cell, then relay 2 is switched on, which gives power supply to the load. However, if load current increases gradually and becomes greater than the maximum current, then relay 2 is switched off.
Figure 9: Block diagram of the individual units in the proposed microgrid
In case the load requires less amount of power supply or does not require power, then the relay 2 is kept off, and the battery continues to get charging current from the solar panel. By this way, the solar charging current is stored in the battery, as
long as the solar voltage is present. When the solar panel supply voltage is too low, i.e., less than the threshold voltage, the relay 1 is switched off, so that the load and the battery charger do not get power from the solar panel.
At dawn or night time, the battery can supply the power to the load. Similarly, if the battery voltage is greater than the threshold voltage, relay 3 is switched on. As long as the load current is less than the maximum current, then relay 2 is kept on, which gives power to the load. Otherwise, switch relay 2 is switched off if the load current is greater than the maximum current. Again, when the battery voltage is less than the threshold voltage, then relay 3 is switched off.
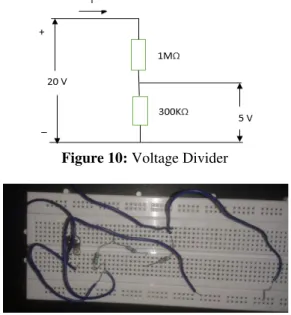
4. Voltage Divider Circuit Used
Arduino analog inputs can be used to measure DC voltage between 0 and 5V. A voltage divider circuit consisting of two resistors in series will divide the input voltage to bring it within the range of the Arduino analog inputs. The circuit with the particular values shown has an input impedance of 1MΩ + 300kΩ = 1.3MΩ and is suitable for measuring DC voltages up to about 20V, for applying to the analog input of Arduino.
Figure 10: Voltage Divider
Figure 11: Circuit of Voltage Divider Any voltage higher than about 20V could damage the Arduino. Providing this basic over-voltage protection is at the expense of not using the full 10-bit range of the analog input ADC if only lower voltages are to be measured. No other protection for voltage spikes, reverse voltage or voltages higher than 20V is shown in the circuit.
5. Circuit Used for the Load to get
Supply from Solar or Battery
In order to switch a motor or a light bulb, the first step is to determine the voltage and current of the load. In general, we can use both PNP or NPN transistors as switches. However, PNP transistors can only control the same voltage as is supplied to the Arduino chip. In this case, since the voltage, we are controlling (18.22V) is different from the Arduino voltage (5V); therefore, NPN transistor has to be used.
Figure 12: Circuit diagram of a design system An LED (Light Emitting Diode) is connected to the collector of NPN transistor. It glows according to the base current. The base resistor (Rb) is connected to limit the base current.
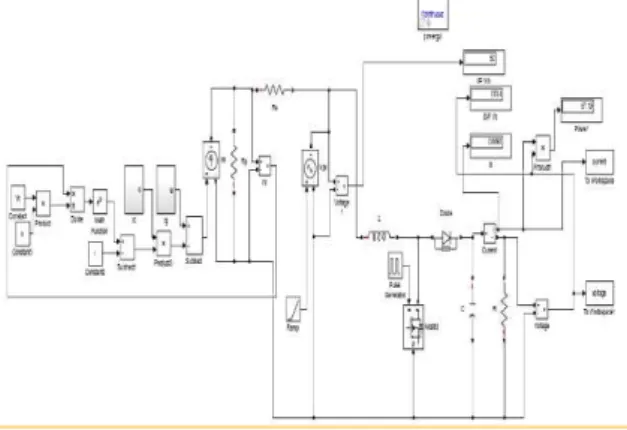
When the source from solar panel can supply enough energy to the load then the first relay (R1) is switched on as long as the load current is less than the maximum current that can be obtained from the solar cell, so the second relay (R2) is switched on. In that case, the battery gives power supply to the load. Similarly, at dawn or night time, the battery can supply the power to the load. The flowchart of the process is shown in figure 13.
The maximum power of the solar panel used is 10W, the voltage and current are 18.22V and 0.55A respectively. The open-circuit voltage is 22.03V and the short circuit current is 0.6A. The rating of the lead-acid battery is 12V, 7Ah capacity.
Figure 13: Flowchart of the Solar-Battery supply circuit
5.1 Analysis of Results
The Solar-Battery dual system can switch over the supply to the load (LEDs) from Solar to Battery when the solar voltage reaches below threshold set and vice-versa. The circuit is now ready to be connected to any load by using a suitable relay.
Figure 14: Load powered by solar source
Figure 15: Load powered by Battery as a source (automatic switching in the absence of solar output).
6. Measurement
of
Voltage
using
Arduino
A voltage divider circuit consisting of two resistors in series will divide the input voltage to bring it within the range of the Arduino analog inputs. The circuit with the particular values shown has an input impedance of 1MΩ + 300kΩ = 1.3MΩ and is suitable for measuring DC voltages up to about 20V. Figure 16 shows the serial monitor output voltage from the power supply.
Figure 16: Testing of Voltage measurement using Arduino and Serial Monitor Output Voltage with 20V supply
7. DC-DC Converter
A DC-DC converter is an electronic circuit device that converts a source of direct current (DC) from one voltage level to another.
Figure 17: System block
This load is supposed to get only a DC voltage. The DC voltage can be given by a DC source. However, the DC source that we have used and the load may not be compatible. In such a case, it cannot be directly connected to the load, which may require higher volt. Therefore, a DC-DC converter is needed.
Semiconductors such as diodes, switches and passive devices such as resistors, inductors and capacitors are the basic components to construct a converter [7-8]. Not only converting energy, but converters with proper controllers also keep the power quality of microgrid within acceptable levels. So, all these major components are put together in specific topologies to achieve specific outputs.
7.1 Boost Converter
As the output power given by the solar panel is very low, so the use of a boost converter is one of the methods used to increase the output power. The boost converter is used to step up the voltage from a lower level to higher level. The step-up level is determined by the duty cycle of the converter. The converter consists of a switch, inductor, diode and capacitor.
The boost converter that we have designed in MATLAB/Simulink is 50 V and boosted to 100 V, which can be used to connect to DC bus of different loads.
Table 1: Specification of Boost converter Sl.
No.
Parameters Specifications Values 1 Input voltage Vs 50 V 2 Output voltage Vo 100 V 3 Output Power P 67.16 W 4 Output voltage ripple ∆Vout 1% 5 Input current peak ripple ∆IL 53% 6 Switching frequency Fs 20 KHz
Necessary calculations for each circuit element are given below.
The first step in the design procedure is to verify whether the maximum possible output current of the boost converter supports the specific application requirements.
Maximum Duty Cycle:
D
= 1
−
V
¿×
Ƞ
V
out (11)The value of the inductor (L), decides the peak input current, which corresponds to the withstanding capacity of the converter switches. Inductor Ripple Current:
L
×
f
D
×
V
=
I
s min L (12)The capacitor serves as an energy storage device. Energy is stored in the capacitor near the peak values of input voltage and current, and it gets discharged in order to maintain the load current constant irrespective of the circuit conditions. The
factor that plays a vital role in capacitor selection is the ripple in the output voltage.
Average Forward Current of Rectifier Diode:
max out F
=
I
I
(13)Power Dissipation in Rectifier Diode:
P
D=
I
F× V
F (14)Minimum Output Capacitance:
out s max out min out
V
×
f
D
×
I
=
C
(15)7.2 Simulation of DC-DC Boost Converter
Modelling of a boost converter is done in MATLAB/Simulink software.
Figure 18: Simulation model of Boost Converter
8. Interfacing of the PV Array with
Boost Converter
The model below shows the interfacing of the PV array with a boost converter.
Figure 19: The complete Simulink circuit model showing the coupling of PV array with the boost converter
The interfacing of the PV array with the boost converter has been achieved using a voltage-controlled source.
9. Testing of DC Microgrid
DC microgrid is an emerging technology due to the increment of modern DC loads such as electric vehicle (EV), light-emitting diode (LED) lighting and that the majority of electronic devices are DC, as well as DC storage elements. DC microgrid is considered to be more reliable, and topology is simpler [9-10].
Figure 20: System block diagram
9.1 Connection of One PV Module to DC Bus
Figure 21: One PV module connected to DC bus with six loads
From the above model shown in Figure 21, we have considered a water heater, air heater and a DC motor of load resistance, R=1Ω. A one PV module is connected to a DC bus which provides the power supply to all the loads connected through a DC bus. When the switch is switched ON the current drawn by the loads are noted as shown in Table 2.
Table 2: One PV module with six loads are connected to DC bus Parameters Values VPV 50 V VDCBus 39.88 V IL1 45.79 A IL2 27.55 A IL3 39.84 A IL4 22.95 A IL5 36.49 A IL6 35.78 A
From the above table, the load currents are obtained for one PV module supplying the power. Let us look in the next testing with more PV modules with respect to the loads.
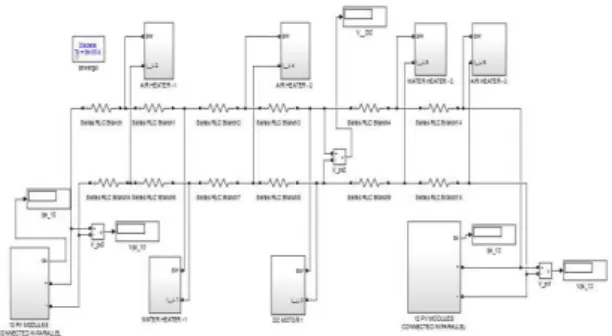
9.2 Connection of Ten PV Modules plus Twelve PV Modules to DC Bus
Figure 22: Ten plus twelve PV modules connected to DC bus with six loads
From the above model shown in Figure 22, we have considered with six loads connected to the DC bus of load resistance, R=1Ω. In this test, ten PV modules are connected in series to increase the current which are connected to the left side of a DC bus, and twelve PV modules are also connected in series which are connected to the right side of a DC bus as shown in the above figure. When the switch is made ON, the current drawn by the loads are noted as shown in Table 3.
Table 3: When six loads are connected to DC bus Parameters Values VPV 50 V VDCBus 27.46 V IPV(10) 65.03 A IPV(12) 78.06 A IL1 25.92 A IL2 26.69 A IL3 10.93 A IL4 25.67 A IL5 26.42 A IL6 27.43 A
9.3 Interfacing of Boost Converter with PV Module connected to a DC Bus
The boost converter controls the PV panel to operate at the Maximum Power Point.
Figure 23: A boost converter interfaced with PV module connected to a DC bus
From the above model shown in Figure 23, one PV module is interfaced with the boost converter and connected to a DC bus. In this test, seven loads are connected to a DC bus and the load resistance, R=1 Ω. When the switch is made ON, the current drawn by the loads are noted as shown in Table 4.
Table 4: One PV module interfacing with a boost converter connected to DC bus
Parameters Values VPV 50 V VBoost 100 V VDCBus 60.73 V IL1 76.84 A IL2 70.18 A IL3 49.94 A IL4 60.67 A IL5 42.64 A IL6 55.43 A IL7 54.34 A
In this case, the voltage between the buses is higher compared to the above cases, i.e., without boost. Similarly, the load currents also increased.
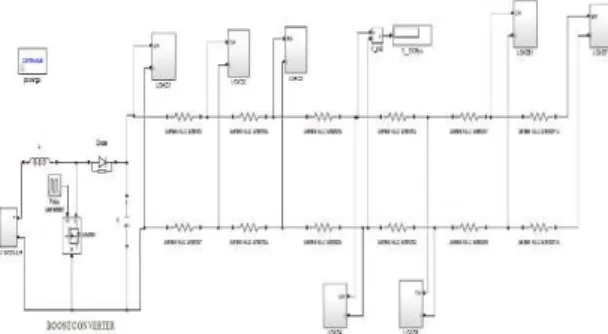
9.4 Two PV Modules connected to a DC Bus with a Boost Converter
Figure 24: A boost converter interfaced with PV module connected to a DC bus
From the above model shown in figure 24 two PV modules are connected to a DC bus and each PV module are interfaced with a boost converter. In
this test, seven loads are connected to a DC bus and the load resistance, R=1 Ω. When the switch is made ON, the currents draw by the loads are noted as shown in table 5.
Table 5: Two PV modules with a boost converter connected to DC bus Parameters Values VPV 50 V VBoost 100 V VDCBus 83.73 V IL1 90.66 A IL2 86.7 A IL3 69.5 A IL4 83.65 A IL5 69.5 A IL6 86.7 A IL7 90.66 A
In this case, the voltage between the buses is higher compared to the above cases for one PV module with the boost. Similarly, the load currents are increased higher compared to the previous case. From the same model shown in Figure 24 when the load resistance, R=10 Ω the currents drawn by the loads are noted as shown in Table 6.
Table 6: Two PV modules with a boost converter connected to DC bus Parameters Values VPV 50 V VBoost 100 V VDCBus 107.5 V IL1 10.84 A IL2 10.79 A IL3 9.26 A IL4 10.75 A IL5 9.26 A IL6 10.79 A IL7 10.84 A
In this case, the voltage between the buses is high, and the load currents are decreased.
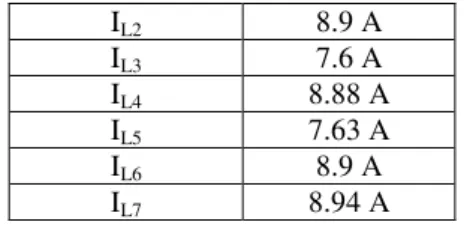
Again, from the same model shown in Figure 24, when the load resistance, R=12 Ω the currents drawn by the loads are noted, as shown in Table 7.
Table 7: Two PV modules with a boost converter connected to DC bus Parameters Values VPV 50 V VBoost 100 V VDCBus 106.5 V IL1 8.94 A
IL2 8.9 A IL3 7.6 A IL4 8.88 A IL5 7.63 A IL6 8.9 A IL7 8.94 A
In this case, the voltage between the buses is high, and the load currents are decreased. Therefore when loads resistance increases the load currents decreases.
9.5 One PV Module interfacing with a Boost Converter plus 100V Battery are to be connected
Figure 25: A boost converter interfaced with PV module connected to a DC bus
From the above model shown in Figure 25, one PV module is interfaced with a boost converter and connected to a DC bus, and also a 100V battery is connected. A small value of resistance is connected in series with a battery. In this test, seven loads are connected to a DC bus and the load resistance, R=1 Ω. When the switch is made ON, the current drawn by the loads are noted as shown in table 8.
Table 8: One PV module interfacing with boost plus 100V battery are connected to DC bus
Parameters Values VPV 50 V VBoost 100 V battery 100 V VDCBus 78.18 V IL1 99.34 A IL2 90.6 A IL3 68.68 A IL4 78.1 A IL5 59.12 A IL6 71.28 A IL7 69.89 A
In this case the voltage between the buses is higher compared to the other model shown in the previous case. The loads currents are also higher.
To conclude from all the observations discussed above, to improve the output power to the load side and to stabilize the voltage, a battery must be connected to the DC bus as it helps to
reduce the losses. Therefore, together the PV modules interfaced with a boost converter and a battery, are expected to give better results.
10.
Conclusions
The circuit for solar power supply and automatic switch-over to battery supply is completed. Microcontroller based circuit operation provides the flexibility of setting the threshold voltages for solar as well as battery supply to the load. The circuit designed so far is ready for integrating into the microgrid, where there would also be other sources, such as wind power supply. Interfacing of a boost converter with PV array has been done, to step up the voltage up to grid level. A designing of DC microgrid having solar energy as the source has been done. Overall, the DC microgrid is a viable option for distributing power in both rural and urban households, utilizing solar power which is available freely.
References
[1] N. Pratap, P. Singh, S. Sharma and R. Rani, “Solar energy: Trends and enabling technologies”, International Journal of Education and Science Research Review, Vol.1, Issue No. N3, June 2014, pp. 21-30.
Retrieved from
http://www.ijesrr.org/publication/8/IJESRR%2 0V-1-3-4E.pdf
[2] “Solar energy”, Edugreen. [Online]. Available: http://edugreen.teri.res.in/explore/renew/solar. htm (Accessed March 12, 2018).
[3] H. Kakigano, Y. Miura, and T. Ise, “Low -Voltage Bipolar-Type DC Microgrid for Super High Quality Distribution”, IEEE Transactions on Power Electronics, Vol. 25, Issue No. 12, Dec. 2010, pp. 3066- 3075. Doi: 10.1109/TPEL.2010.2077682
[4] M. G. Villalva, J. R. Gazoli and E. R. Filho, “Modeling and circuit-based simulation of photovoltaic arrays”, Brazilian Journal of Electronics, Vol. 14, Issue No. 1, 2009, pp. 35-45. Doi: 10.1109/COBEP.2009.5347680.
[5] A. Saleh, “Simulation of pv model using matlab simulink 2012”, YouTube Video Tutorial, Dec. 11, 2015. [Online]. Available: https://www.youtube.com/watch?v=x0Kjg_zV HuQ (Accessed: April 12, 2018).
[6] Krismadinataa, N. A. Rahim, H. W. Ping and J. Selvaraj, “Photovoltaic module modeling using simulink/matlab”, Procedia Environmental Sciences, Vol. 17, 2013, pp.
537-546. Doi: https://doi.org/10.1016/j.proenv.2013.02.069 [7] S. Sholapur, K. R. Mohan and T. R.
Narsimhegowda, “Boost Converter Topology for PV System with Perturb And Observe MPPT Algorithm”, IOSR Journal of Electrical and Electronics Engineering (IOSR-JEEE), Vol. 9, Issue No. 4, Ver. II, Jul – Aug. 2014,
pp. 50-56. Retrieved from
http://www.iosrjournals.org/iosr- jeee/Papers/Vol9-issue4/Version-2/I09425056.pdf
[8] S. D. Stallon, K.V. Kumar, S. S. Kumar and J. Baby, “Simulation of High Step-Up DC–DC Converter for Photovoltaic Module Application using MATLAB/SIMULINK”, International Journal of Intelligent Systems and Applications(IJISA), Vol. 5, Issue No. 7, 2013. pp. 72-82. Doi: 10.5815/ijisa.2013.07.10 [9] A. T. Ghareeb, A. A. Mohamed and O. A. Mohammed, “DC microgrids and distribution systems: An overview”, Proc. of 2013 IEEE Power & Energy Society General Meeting, Vancouver, BC, 2013, pp. 1-5. Doi: 10.1109/PESMG.2013.6672624
[10] D. Salomonsson, L. Soder and A. Sannino, “Protection of Low-Voltage DC Microgrids”, IEEE Transactions on Power Delivery, Vol. 24, Issue No. 3, July 2009, pp. 1045-1053. Doi: 10.1109/TPWRD.2009.2016622
Author
s’
Profiles
Risalin Lyngdoh Mairang is a student of M.Tech. 4th semester in the department of Electrical and Electronics Engineering, School of Technology, Assam Don Bosco University.
Bikramjit Goswami is working as an Assistant Professor in the department of Electrical and Electronics Engineering, School of Technology, Assam Don Bosco University, India. He is
also a Ph.D. Research Scholar in Assam Don Bosco University currently. His research interests are Reconfigurable Antenna, Microwave Remote Sensing, Artificial Neural Networks, renewable Energy, Disaster Forecasting.