A Real Options Evaluation Model for the
Diffusion Prospects of New Renewable
Power Generation Technologies
Gürkan Kumbaroglu, Reinhard Madlener, Mustafa Demirel
CEPE Working Paper No. 35 September 2004
CEPE
ETH Zentrum, WEC CH-8092 Zürich www.cepe.ethz.ch
A real options evaluation model for the diffusion
prospects of new renewable power generation
technologies
Gürkan Kumbaro
ğ
lu
a, Reinhard Madlener
b,*and Mustafa Demirel
aa Department of Industrial Engineering, Boğaziçi University, TR-34342 Bebek, Istanbul, Turkey
b Centre for Energy Policy and Economics (CEPE), Swiss Federal Institute of Technology Zurich, ETH Zentrum
WEC C, CH-8092 Zurich, Switzerland
CEPE Working Paper No. 35 September 2004
Table of Contents
Abstract... 1
1 Introduction ...2
2 Theoretical Background ...2
2.1 The Real Options Approach to Investment Planning in Competitive Energy Markets...2
2.2 Learning Curves and RET Adoption...3
2.3 Risk and Uncertainty... 4
3 Model Description ...5
4 Empirical Analysis ...7
4.1 RETs in the Turkish Electricity Supply Industry... 8
4.2 Model Calibration... 10
4.3 Model Results... 13
5 Conclusions... 16
Abstract
This study presents an investment planning model that integrates learning curve information on renewable power generation technologies into a dynamic programming formulation featuring real options analysis. The model recursively evaluates investment alternatives on a year-by-year basis, thereby taking into account that the flexibility to delay an irreversible investment expenditure can profoundly affect the diffusion prospects of renewable power generation technologies. Price volatility is introduced through stochastic processes for the average electricity price and for fuel prices. Demand for peak-load capacity is assumed to be increasingly price-elastic and linearly de-pendent on the extent of market opening. Apart from general implications for policy-making, the empirical analysis provides insights about the impact of uncertainty on the diffusion of various emerging renewable energy technologies. The application is based on data for the Turkish elec-tricity supply industry. Several aspects make the Turkish elecelec-tricity supply situation a particularly interesting subject of study, including the significant domestic renewable energy resources and market potentials for emerging renewable energy technologies, the ongoing market liberalization process, high pollutant emission levels, a pressing need for further electric capacity expansion, and the still very low share of new renewable energy technologies (< 0.3% of total electricity production).
Keywords: Real options, Dynamic programming, Technology diffusion, Learning curve, Renewable
1 Introduction
The adoption of new renewable power generation technologies is subject to developments that bring down unit generation costs to a level where they can actually compete with conventional technologies. Such developments are best reflected by learning curves, which indicate the expo-nential reduction in the unit cost of renewable energy technologies (RETs) (e.g. measured in $ per MW of capacity installed) that could be expected as their production volume increases (e.g. IEA, 2000). Prospects for the diffusion of RETs, however, still remain unclear due to the high level of uncertainty that characterizes liberalized electricity markets (esp. regarding the price and demand for electricity), and the way investors evaluate investment options under uncertainty. Both of these features call for the use of more sophisticated valuation techniques than traditional net present value (NPV) calculations. When dealing with (irreversible) investments in physical assets, real options theory (Dixit/Pindyck, 1994; Trigeorgis, 1996) offers a useful approach for the appreciation of uncertainty over time. A main feature of the real options approach is the ac-counting for the value inherent in the flexibility to delay an irreversible investment into the futu-re. This value becomes particularly important in the context of new renewable energy technolo-gies, as these are often modular, require only short construction times, and feature steep learning curves. The combination of learning curves and real options modeling, therefore, provides an interesting approach to projecting the diffusion possibilities of new RETs and the implications of their diffusion for both conventional generation and the environment.
This study presents an investment planning model that integrates the learning curve information of renewable power generation technologies into a dynamic programming formulation featuring real options analysis. The model evaluates investment alternatives in a recursive manner and on a year-by-year basis, thereby taking into account how the ability to delay an irreversible investment outlay can affect the prospects for the diffusion of different power generation technologies. Un-certainty is introduced for the input fuel price and electricity price forecasts. The demand for peak-load capacity is modeled to be increasingly price-elastic over time, proportional to the de-gree of market opening. Besides general policy implications, the empirical analysis provides some insights into the impact of uncertainty on the diffusion of emerging RETs. The application is ba-sed on data for the Turkish electricity supply industry. Significant domestic renewable energy re-sources and market potentials for emerging renewable energy technologies, the ongoing market liberalization, high pollutant emission levels, a pressing need for further electric capacity expansi-on, and the currently still very low share of new renewable energy technologies (less than 0.3% of total electricity production) make the Turkish electricity supply situation an especially interesting subject of study.
The remainder of the paper is organized as follows: section 2 provides some theoretical back-ground, section 3 contains the model description, section 4 presents the empirical analysis, and section 5 concludes.
2 Theoretical
background
2.1 The real options approach to investment planning in competitive energy markets
The restructuring of energy markets, which aims at the introduction of competition and the inc-rease in economic efficiency, is a process that generates various uncertainties to the energy sector. As the level of uncertainty increases, classical deterministic discounted cash flow modeling
ap-proaches to capacity investment planning need to be complemented by other, more sophisticated methods, in order to deal with the potential fluctuations in demand and price trajectories (Dy-ner/Larsen, 2001; Kagiannas et al., 2004). The real options (RO) approach to investment decisi-on planning provides an attractive opportunity to evaluate power generatidecisi-on investment alterna-tives in a deregulated market environment.
The idea of RO has been adopted from finance. It questions the underlying assumptions of tradi-tional capital budgeting methods and seeks gains from deferring an irreversible investment ex-penditure (in contrast to a “now or never” proposition implicit in traditional NPV analysis). The RO theory, elaborated in an accessible, comprehensive and detailed fashion by Dixit and Pindyck (1994), provides a new view of investment. Dixit and Pindyck’s seminal publication also includes a basic example, which demonstrates the usefulness of the RO approach for the selection of po-wer generation technology under uncertainty (pp.51-54; see also Kaslow/Pindyck, 1994). The RO approach can be most conveniently translated into a mathematical model through a dynamic pro-gramming formulation. It should be noted that recently available software packages like Crystal Ball (Mun, 2002) feature RO modeling as well, thus facilitating a widespread adoption of this new methodology. However, the presence of non-standard constraints specific to the electricity sector (e.g. time-variant price elasticities of energy demand, non-linear cost structures (learning curves), and changes in construction lead times), necessitate a tailored application, i.e. the formulation and solving of specially customized models, as it is presented in section 3 below.
A main feature of the RO approach is the possibility of delaying investments and evaluating the value of waiting as part of the decision-making problem. If a company invests at time t, it gets the expected present value of the revenues minus the cost. In contrast, if it waits and invests at time (t+1), a real option might arise that, if exercised, yields a higher net profit. In dynamic program-ming the sequence of investment decisions is broken up into two parts, one that addresses the immediate choice, and one that addresses all subsequent remaining decisions. For the case of a multi-period evaluation, this leads to a model formulation that can be solved recursively. The dy-namic decision framework then allows to systematically compare the expected net present values from immediate investment and from waiting to invest, respectively. The ability to introduce and value the temporal flexibility in an irreversible investment decision represents the main distincti-on between real optidistincti-ons and a cdistincti-onventidistincti-onal decisidistincti-on analysis based distincti-on NPV calculatidistincti-ons.
Case studies and examples of applying the RO approach to energy industry investment problems can be found in Ronn (2003). Applications of the RO approach for investment planning in the electricity sector, however, have only in recent years started to penetrate the literature and, there-fore, are still very limited in number. Frayer/Uludere (2001) conduct a RO analysis on two gene-ration assets in a regional market under volatile electricity prices. Keppo/Lu (2003) make use of the RO approach, in order to introduce uncertainty for the electricity price, which is assumed to be affected by the investment behavior of a large producer.
2.2 Learning curves and RET adoption
Learning curves, sometimes also referred to as progress curves or experience curves (see Dut-ton/Thomas, 1984; Argote/Epple, 1990, among others) indicate the development of marginal or average unitary cost as a function of cumulative production or capacity. They are an empirical artifact rather than a theoretically founded concept. Learning effects can have many reasons, inc-luding technological progress, learning-by-doing, improvements in organizational efficiency, re-duction in input prices or financing cost, and economies of scale and of scope. Commonly,
pro-gress ratios or learning rates are used to express estimated unit cost decreases as a constant per-centage for each doubling of experience.1
Learning curves allow for projections of future cost reductions based on the extrapolation of historical trends, and in recent years have become popular also in the energy research literature and as a guide for policy-makers (IEA, 2000; Ibenholt, 2002; Junginger et al., 2005; Kamp et al., 2004; Neij, 1997, 1999; among others). In energy and climate models alike, learning curves have been employed with increasing frequency, in order to account for cost reductions due to techno-logy-related learning, and thus to endogenize technological change (McDonald/Schrattenholzer 2001). At the same time, there is a severe lack of discussion on the appropriateness of model spe-cifications and estimation techniques in learning curve studies of energy conversion technologies. As a matter of fact, the choice of both model specification and estimation technique can have a strong influence on the learning rate estimates obtained (Söderholm/Sundqvist, 2004). Hence we acknowledge uncertainties surrounding estimated learning curves that stem from model misspeci-fication issues, but at the same time consider learning curves nevertheless a useful tool in mode-ling technological change in energy supply systems.
In this paper we make use of learning curves for renewable energy technologies, in order to take into consideration that these technologies will sooner or later be able to compete with conventi-onal technologies (thus acting as “backstop technologies”). Such competitiveness, a prerequisite for the transition towards a more sustainable energy system, depends on the cumulative produc-tion or cumulative installed capacity, respectively, which reflect the experience gained up to a cer-tain point in time. This allows us to model the prospects for renewable energy technology adop-tion and diffusion in the light of declining unit costs, which can provide useful insights to policy-makers on how to design RET promotion policies and/or to safeguard a desired technological composition of the power generation sector.
Recently, Junginger et al. (2005) have introduced a method to set up global experience curves, based on the reasoning that leading manufacturers typically deliver their products all over the world, implying ‘global learning’. Their analysis indicates that there is a great deal of uncertainty involved in progress ratios, depending on the choice of system boundary, time frame, geographi-cal area, GDP deflator, and other factors. For the case of wind farms, Junginger et al. find global progress ratios ranging from 77% to 85%, which is far more optimistic than assumed in most of the current energy scenario studies. However, it should be noted that factors such as average wind speed, land availability, grid connection, and civil works are also of influence to local lear-ning rates.
2.3 Risk and uncertainty
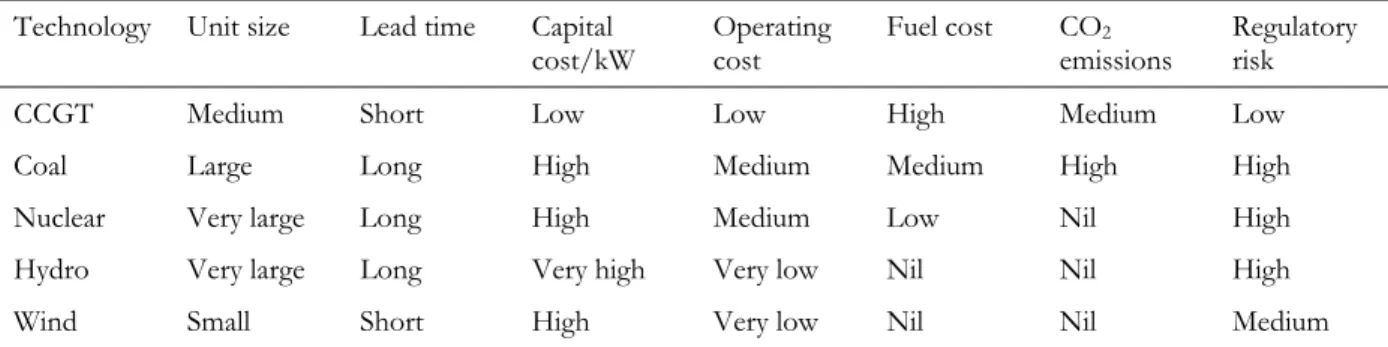
Liberalization of electricity and other energy markets introduces much additional uncertainty, also and especially regarding the profitability of investments. With uncertainty, the risk profile of a particular technology influences the choice of the power generation mix, even when the techno-logies are commercially proven and have equal levelized costs (IEA, 2003; Awerbuch/Berger, 2003). Table 1 shows a qualitative comparison of risk characteristics for selected generating tech-nologies.
1 The progress ratio(PR) represents the rate at which costs decline each time the cumulative production (or capacity) doubles. The learning rate (LR) is its complement, computed as 1-PR. For example, if PR = 0.8 then costs are reduced by 20% (LR = 0.2) to 80% of the former level for each doubling of cumulative production or capacity.
Table 1. Qualitative risk assessment for different generating technologies
Technology Unit size Lead time Capital
cost/kW Operating cost Fuel cost COemissions 2 Regulatory risk
CCGT Medium Short Low Low High Medium Low
Coal Large Long High Medium Medium High High
Nuclear Very large Long High Medium Low Nil High
Hydro Very large Long Very high Very low Nil Nil High
Wind Small Short High Very low Nil Nil Medium
Source: adapted from IEA (2003a)
New renewable energy technologies for power generation, such as PV and wind power systems, have attractive low-risk characteristics, such as short planning and construction lead times, no (or low) fuel cost and related greenhouse gas and pollutant emission, and low operating and mainte-nance costs. On the other hand, they are relatively capital-intensive – partly because the techno-logies are still fairly high up the learning curve, and partly because they have to concentrate a dispersed energy source. This is in contrast to, say, large hydro or nuclear power systems, which require large capital outlays, long lead times, long payback periods, and thus large investment risk. In the modeling formulation that follows, we explicitly take into account many characteristics of electricity generation technologies, that allow for an explicit incorporation of their flexibility cha-racteristics and the risks that accrue from investment.
3 Model
description
The dynamic programming model formulation chosen accommodates a period-by-period evalua-tion of irreversible investment alternatives under uncertainty, and thereby features a real opevalua-tions evaluation. Structurally, it is similar to a technology adoption model recently developed for the study of the economic rationality of historical power generation capacity investments in Turkey (Madlener et al., 2004). However, the “historical” model has been modified in several aspects in order to: (1) perform a real options evaluation through a dynamic programming model formulation; (2) account for construction lead times; (3) consider a time-variant price elasticity of electricity demand (as-sumed to increase as the extent of market deregulation and competitiveness increases); (4) inclu-de stochastic processes for the evaluation of fuel and electricity price uncertainties; and (5) adopt lear-ning curve information to evaluate prospects for the diffusion of RETs. The additional capabilities of the modified model version, esp. those mentioned under (1), (3) and (4), allow for the plan-ning of “future” investment decisions. Feature (2), the inclusion of construction lead times, al-lows to capture the impacts of delivery lags on the investment decision, which is quite essential under irreversibility and uncertainty, as pointed out by Alvarez/Keppo (2002). The evaluation of the impact of price volatility, i.e. of feature (4), is inevitable when studying competitive electricity markets, and has been a subject of various studies that make use of stochastic modeling (e.g. Vehviläinen/Keppo, 2003; Sahinidis, 2004). As the existence of a price-elastic demand can be considered a prerequisite for the success of electricity market liberalization, feature (3) is also ine-vitable for the representation of competitive electricity markets. Policy-makers are supposed to take the necessary steps and actions to increase the price elasticity of demand, which can be ex-pected to rise as market deregulation progresses and competition is extended. In addition to these
four features, we have included feature (5), which combines learning curve information and RO modeling in an empirical application as a particular originality of this article, in order to explore the prospects for the diffusion of new RETs under electricity market restructuring and uncertain-ty.
We start with the base year 2000 and evaluate the attractiveness of a set of power generation al-ternatives over time under conditions of increasing competition and decreasing unitary cost (lear-ning curves) for new renewable energy technologies over the next 20 years. The year-by-year eva-luation of investment options takes into account how the ability to delay an irreversible invest-ment expenditure can profoundly affect the prospects for the diffusion of different renewable power generation technologies.
In the following model formulation, we denote variables by uppercase letters, and parameters and subscripts by lowercase letters. Capacity additions Xi,vfor each technology i (indicating the plant
type) of vintage v (indicating the year at which the investment decision is taken) are evaluated at time t to maximize the net present value, NPVt(Xi,v=t), i.e.:
{
}
∑
∑
∑
∑
∑
∑
∑
= = + + + = = = − − = + + + = = = − − + + + = = = − − = − + − − + − + = i iv t iv t i el i lt t i lt t z izv t izv t t z t v z i i i el i lt t i lt t z izv t izv t z t z z i i el i lt t i lt t z izv t izv t t z z i t v i t X fc L r vc d L r p L r p X NPV , , ) ( ) ( ) ( ,, ,, ) ( , , ) ( ) ( ) ( ,, , , ) ( ) ( ) ( ) ( ,, , , ) ( , ) 1 ( ) 1 ( ) 1 ( max ) ( θ θ θ (1)where pz is the electricity price (modeled as a stochastic process, see below), r is the real interest
(discount) rate, Li,z,v stands for the load of plant type i of vintage v in year z, θi,z,vdenotes the
cor-responding duration (in hours), and dz is peak power demand. Xi,v is the capacity installed of plant
type i in year v. The variable and fixed costs are denoted by vci,z,vand fci,v, respectively, lt stands for
lead time, and el denotes economic lifetime. The first two terms on the right hand side represent the income from the sales of electricity. Here, the value of power generation in excess of peak demand, dz, is subtracted from total income, as it cannot be sold and, therefore, does not create
any revenue. Obviously, the value of peak load demand remains as a net effect. The latter two components on the right hand side of equation (1) stand for the present values of operation and maintenance (O&M) and investment costs, respectively.
Plants are assumed to start operation immediately after the construction lead time, lt(i), has elapsed, for a duration equal to their economic lifetime, el(i), which is implicitly modeled by sub-script z. The three components of the objective function (revenues, variable costs, and fixed costs) are all related to the plants for which the investment decisions are given in year t. As the model is solved successively, the resulting choices are fixed in the next year (t+1) and become part of the first constraint, depicted in Eq. (2), which accounts for the electricity generation from previously installed power plants. It ensures that total power generation should be sufficient to meet peak load demand in year z, dz:
∀ t+ lt(i) + el(i) ≥z≥t (2) ) 1 ( ) ( ) ( ) ( L, , , , d m i lt z i el i lt z v izv izv z i
∑
≥ +∑
− − − = θwhere m represents the reserve margin. The demand for electricity is assumed to be price-elastic and determined by the function
dz(pz)= α pzε
where α is a scale parameter, and εz denotes the price elasticity of electricity demand, which is
as-sumed to be time-dependent, to reflect an expectedly increasing price elasticity as the market opening process continues.
The second constraint ensures that output from each plant (i.e. the amount of electricity gener-ated) does not exceed available capacity:
∀ t+lt(i)+el(i) ≥z≥t +lt(i) , v≤t (4) v i i v z i a X L,, ≤ ,
where ai is the availability factor for plant type i, which refers to the percentage of time that a
plant can be used, i.e. is not out of service due to maintenance or repairs. Similarly,
v i i v z i v z i cf X L,, ,, , 8760≤ θ ∀ t+lt(i)+el(i) ≥z≥t +lt(i) , v≤t (5)
where cfi is the capacity factor for plant type i. It measures the productivity of the plant,
compa-ring its actual production with the amount of power the plant would have produced if it had run at full capacity for the whole year (average energy output of the plant / max. energy output of the plant).
Uncertainty is introduced for both input and output prices, i.e. the prices of electricity and fossil fuels. The projection of electricity prices is based on a Geometric Brownian Motion (GBM), a log-normal diffusion process with the variance growing proportionally to the time interval. The price increment δ pzis computed as
(
z z)
p
pz z µ δ σ ε δ
δ = −1 + (6)
where µ and σ represent the mean drift rate and percentage volatility, respectively, δz indicates the time increment, and ε is a standard normal random variable, ε~N(0,1). The variability in fuel pri-ces is reflected analogously through a GBM propri-cess for variable costs:
(
z z)
vc
vcizv iz v µ δ σ ε δ
δ , , = , −1, + . (7)
Finally, we integrate the learning curve information of renewable power generation technologies, in order to account for the reduction in investment cost as cumulative capacity increases. That is,
∀ i, v > 2000 (8) li v i v i fc CC fc − = = , 2000 ,
where CC is the cumulative (installed) capacity and li stands for the learning index, determined from the progress ratio PR (the rate at which the fixed cost declines whenever CC doubles) as
PR = 2-li (9)
This concludes our model formulation.
4 Empirical
analysis
The empirical analysis is based on data for the Turkish electricity supply industry. The case of Turkey forms a particularly interesting subject of study, because the market has been rapidly
gro-wing (with an average annual growth rate above 8% over several decades) and is currently under restructuring to be opened further for private sector participation (for further discussion see also IEA, 2001; Madlener et al., 2004). Besides, the renewable energy resources available are large, as are the yet untapped potentials. Prospects for the diffusion of renewable power generation tech-nologies in such a dynamic and expanding market are of particular interest also if environmental sustainability is to be enhanced.
4.1 RETs in the Turkish electricity supply industry
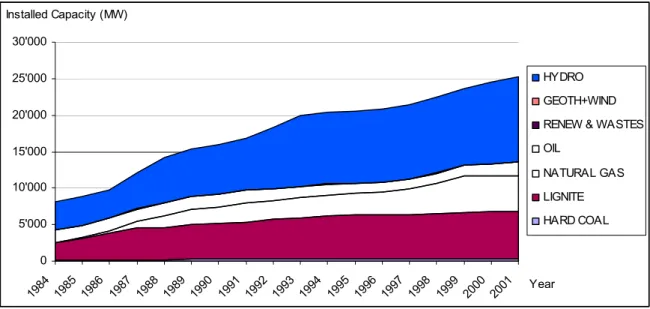
Turkey is endowed with large renewable energy potentials, which constitute the second-largest domestic energy resource after coal. Regarding total energy use, currently about two thirds of to-tal renewable energy production is supplied by biomass and animal wastes (5.97 Mtoe), and one third by hydropower (2.89 Mtoe). About 0.5% of total primary energy supply (TPES; 78.4 Mtoe as of 2002) come from geothermal, wind and solar energy resources. Renewables accounted for 8.9% of TPES in 2002, of which biomass had the largest share (67.7%) (see also Table 2 below). In electricity generation, renewables accounted for 26.1% (33.84 TWh) in 1999 (20% in 2001, 26% in 2002!), of which hydroelectric energy was absolutely dominating (99.5%). Natural gas ac-counted for 40% of total power generation in 2001, coal for 31%, and oil for about 9% (IEA, 2004a). Figure 1 depicts installed capacities in the Turkish electricity supply sector by energy re-source. 0 5'000 10'000 15'000 20'000 25'000 30'000 1984 1985 1986 1987 1988 1989 1990 1991 1992 1993 1994 1995 1996 1997 1998 1999 2000 2001 Year Installed Capacity (MW) HYDRO GEOTH+WIND RENEW & WASTES OIL
NATURAL GAS LIGNITE HARD COAL
Figure 1. Development of electricity generating capacity in Turkey, 1984-2001 Data source: TEİAŞ, 2002
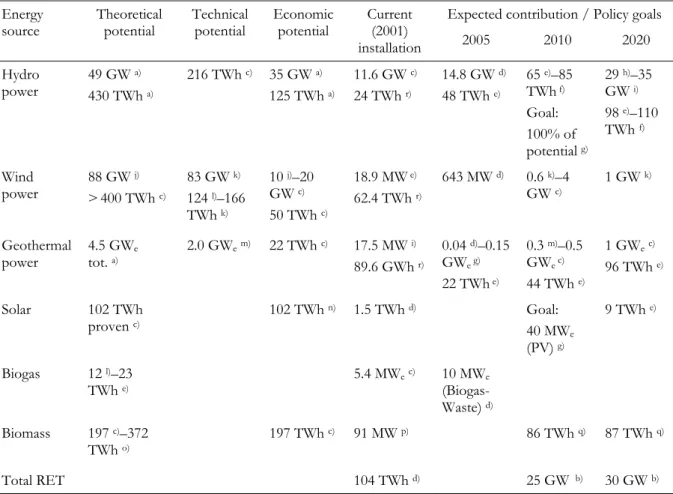
Renewable electricity potentials (theoretical, technical, economic) by energy source and currently and expected future installed capacities are reported in Table 2. Of particular interest for our ana-lysis are the economically feasible renewable energy potentials, which have been estimated at 196.7 TWh/a for biomass energy, 124 TWh/a for hydropower, 102.3 TWh/a for solar energy, 50 TWh/a for wind power, and 22.4 TWh/a for geothermal energy (Evrendilek/Ertekin, 2003). For a developing country like Turkey, which exhibits rapidly growing energy demand levels that have to be met under severe budget problems, it is of great importance that the most
cost-effective energy resources are developed first. Presently, many RETs do not fall into this category due to comparatively high power generation costs. Therefore, diffusion of new RETs is typically not included in projections made by means of integrated energy-economy-environment modeling evaluations (e.g. Kumbaroğlu, 2003; Arıkan et al., 1997). However, together with environmentally adverse impacts caused by intensive fossil fuel use and related high levels of GHG emissions, the widespread development and use of RETs is becoming increasingly vital for sustainable deve-lopment. Rapid diffusion of RETs, within reach in recent years not least due to cost reductions achieved through learning and scale economies, also helps to cover the rapidly growing energy needs of Turkey.
Table 2. Renewable electricity potentials and current and expected RET installations in Turkey
Expected contribution / Policy goals Energy
source Theoretical potential Technical potential Economic potential Current (2001)
installation 2005 2010 2020 Hydro power 49 GW a) 430 TWh a) 216 TWh c) 35 GW a) 125 TWh a) 11.6 GW c) 24 TWh r) 14.8 GW d) 48 TWh e) 65 e)–85 TWh f) Goal: 100% of potential g) 29 h)–35 GW i) 98 e)–110 TWh f) Wind power 88 GW j) >400 TWh c) 83 GW k) 124 l)–166 TWh k) 10 j)–20 GW c) 50 TWh c) 18.9 MW e) 62.4 TWh r) 643 MW d) 0.6 k)–4 GW c) 1 GW k) Geothermal power 4.5 GWtot. a) e 2.0 GWe m) 22 TWh c) 17.5 MW i) 89.6 GWh r) 0.04 d)–0.15 GWe g) 22 TWh e) 0.3 m)–0.5 GWe c) 44 TWh e) 1 GWec) 96 TWh e) Solar 102 TWh proven c) 102 TWh n) 1.5 TWh d) Goal: 40 MWe (PV) g) 9 TWh e) Biogas 12 l)–23 TWh e) 5.4 MWec) 10 MWe (Biogas-Waste) d) Biomass 197 c)–372 TWh o) 197 TWh c) 91 MW p) 86 TWh q) 87 TWh q) Total RET 104 TWh d) 25 GW b) 30 GW b)
Data sources:a) WEC-TNC (1996); b) Demirbaş (2002a); c) Evrendilek/Ertekin (2003); d) Kaygusuz/Kaygusuz (2004); e)
IEA (2001); f)Kaygusuz (2002); g) Kaygusuz/Kaygusuz (2002); h) Ozgener/Hepbasli (2002); i) IEA (2004b); j)
Hepba-sli/Ozgener (2004); k) Oğulata (2003); l) Ediger/Kentel (1999); m) Acar (2003); n) Oğulata/Oğulata (2002); o) Demirbaş
(2002b); p) IEA (2003b); q) Kaygusuz/Türker (2002); r) WEC-TNC (2003).
The annual rate of electricity demand growth in Turkey is expected to increase by 8-10% until 2010. An increase in the installed electric generation capacity by some 30 GW until 2010 and 116-27.8 GW until 2020 will be needed, compared to 2000 levels, equivalent to an investment re-quirement of approximately US$ 3-4 bn annually in generation, transmission and distribution sys-tems (IEA, 2001). Turkish energy policy-makers also welcome further diffusion of RETs for the fact that it would reduce the reliance on imported fuels and enhance Turkey’s energy security si-tuation. Hence a renewable energy law is currently being discussed in the Turkish parliament, which will provide regulated feed-in tariffs for electricity from RES. In particular, the draft law
foresees a guaranteed purchase price of the equivalent of 6 US-ct/kWh for a period of seven years for electricity generated from renewable energies; it primarily supports wind, small hydro and geothermal power generation, but additionally also includes references to support geother-mal, solar and biomass energy, and plans for targeted support of technology R&D and commer-cialization.
4.2 Model calibration
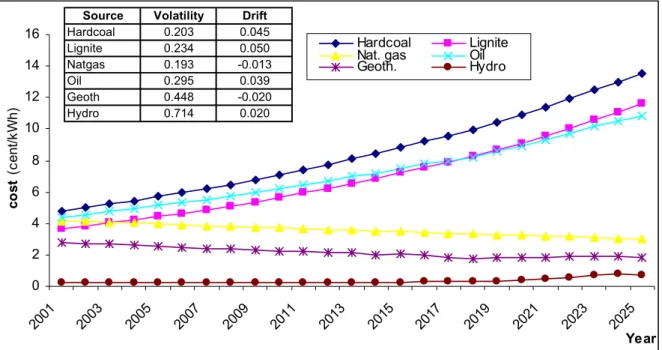
Operational and cost data of existing power plants, as well as electricity price data for the period 1970-2000 are taken from the statistical yearbook of the Turkish Electricity Transmission Corpo-ration (TEİAŞ, 2002). The historical data on costs and prices have been used to estimate the mean drift and volatility parameters of the GBM processes. The case of electricity prices, howe-ver, forms an exception because of the change in market structure. The additional uncertainty due to competition is assumed to be 50%. All drift and volatility assumptions are summarized in Figures 2 and 3 below, which illustrate the resulting stochastic trajectories. The projections depic-ted in Figures 2 and 3 are plotdepic-ted as the average from a total of 5,000 simulations that have been performed. 0 2 4 6 8 10 12 14 16 2001 200 3 2005 2007 2009 2011 2013 2015 2017 201 9 2021 2023 2025 Year co st (c en t/k W h) Hardcoal Lignite
Nat. gas Oil
Geoth. Hydro
Source Volatility Drift
Hardcoal 0.203 0.045 Lignite 0.234 0.050 Natgas 0.193 -0.013 Oil 0.295 0.039 Geoth 0.448 -0.020 Hydro 0.714 0.020
Figure 2. Variable cost projections for existing power generation technologies, 2001-2025
As shown in Figure 2, the prices of fossil fuels except for natural gas increase. Indeed, on the one hand it is quite realistic to expect the prices of oil, lignite and hardcoal to rise in the coming deca-des, as these resources are getting scarcer and the substitution of alternative energy sources is ac-celerating. The use of natural gas, on the other hand, is becoming more popular all over Europe. Pipeline investments to develop the necessary infrastructure are expanding and the diffusion of natural gas continues at an accelerating rate, allowing for the exploitation of scale economies. Therefore, the suggested path with a slight reduction in the price of natural gas seems quite plau-sible. Note that the variable cost component of hydroelectric energy is very low, as there is no fuel cost involved.
2.5 2.7 2.9 3.1 3.3 3.5 3.7 3.9 2001 2006 2011 2016 2021 Year P rice (cent/kWh) 0 2 4 6 8 10 12 14 16 18 20 2001 2006 2011 2016 2021 Year Price (cent/kWh) Volatility Drift 0.5 -0.013
(a) Average (b) Distribution
Figure 3. Electricity price projections
The electricity price projections are depicted in Figure 3; panel (a) indicates the annual forecasts as an average of the simulations, and panel (b) presents their distributional pattern.2 The average
price trajectory appears to be credible, as it is in accordance with the electricity market restructur-ing experiences in other countries. As presently there is an electric generation capacity surplus in Turkey, the price of electricity would most probably go down in a competitive market environ-ment, at least initially. In the longer term, one could expect it to approach its initial level, as has been argued, for example, by Woo et al. (2003). A linear growth has been assumed for the price elasticity of electric energy, increasing from -0.01 in year 2000 to -0.05 in 2025 (implying that a doubling of the price results in a 5% decrease in quantity demanded).3
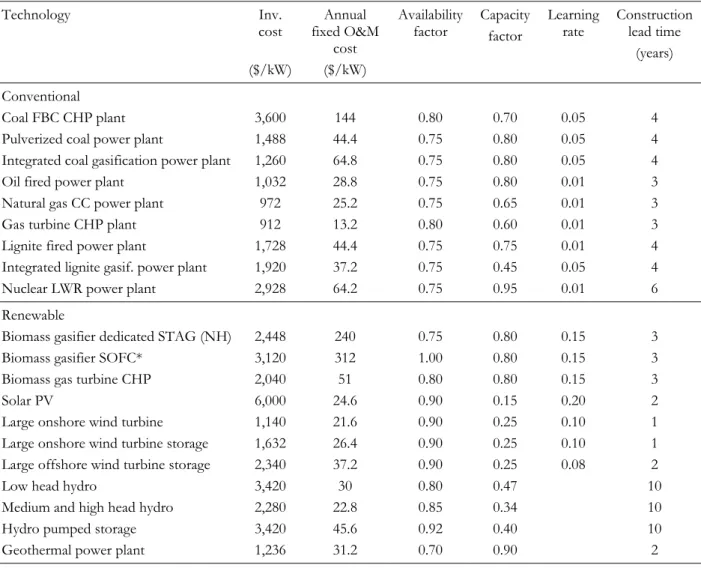
The assumed fixed costs and availability factors for the power plants and technologies modeled as candidates for new investment are based on MARKAL-MATTER data (ECN, 2004) and summarized in Table 3. Note that the maximum annual capacity addition limit for each technolo-gy is set at 2 GW.
Finally, the assumed learning rates for the renewable energy technologies’ considered are 20% for solar PV (Turkenburg, 2000), 15% for biomass (McDonald/Schrattenholzer, 2001), 8% for offs-hore wind turbines (EIA, 1998), and 10% for onsoffs-hore wind turbines (Junginger et al., 2005; Seebregts et al., 1998).
2 Note that the trendline in panel (b) represents the same price data as in panel (a), although at first glance it appears to be smoother due to the difference in scale of the y-axis.
3 The inelastic demand at the beginning is typical for the current electricity infrastructure that largely lacks the ability of real-time metering and billing. However, policies and measures to correct for this demand-side inflexibility will increase the demand re-sponsiveness w.r.t. price to a level, which is assumed to still remain in the inelastic region (-0.05), as the substitution possibilities for electric energy are rather limited.
Table 3. Candidate power generation technologies: costs, assumed availability, learning rates, and construc-tion lead times
Technology Inv. cost ($/kW) Annual fixed O&M cost ($/kW) Availability
factor Capacity factor Learning rate Construction lead time (years) Conventional
Coal FBC CHP plant Pulverized coal power plant
Integrated coal gasification power plant Oil fired power plant
Natural gas CC power plant Gas turbine CHP plant Lignite fired power plant
Integrated lignite gasif. power plant Nuclear LWR power plant
3,600 1,488 1,260 1,032 972 912 1,728 1,920 2,928 144 44.4 64.8 28.8 25.2 13.2 44.4 37.2 64.2 0.80 0.75 0.75 0.75 0.75 0.80 0.75 0.75 0.75 0.70 0.80 0.80 0.80 0.65 0.60 0.75 0.45 0.95 0.05 0.05 0.05 0.01 0.01 0.01 0.01 0.05 0.01 4 4 4 3 3 3 4 4 6 Renewable
Biomass gasifier dedicated STAG (NH) Biomass gasifier SOFC*
Biomass gas turbine CHP Solar PV
Large onshore wind turbine Large onshore wind turbine storage Large offshore wind turbine storage Low head hydro
Medium and high head hydro Hydro pumped storage Geothermal power plant
2,448 3,120 2,040 6,000 1,140 1,632 2,340 3,420 2,280 3,420 1,236 240 312 51 24.6 21.6 26.4 37.2 30 22.8 45.6 31.2 0.75 1.00 0.80 0.90 0.90 0.90 0.90 0.80 0.85 0.92 0.70 0.80 0.80 0.80 0.15 0.25 0.25 0.25 0.47 0.34 0.40 0.90 0.15 0.15 0.15 0.20 0.10 0.10 0.08 3 3 3 2 1 1 2 10 10 10 2 * available starting from 2010
The parameters defined above make up the reference scenario. In addition, the model has been calibrated under various other scenario definitions to further explore the diffusion prospects for new renewable energy technologies in the Turkish electricity market. The reference assumptions are kept as flexible as possible, in order to represent the natural evolution expected in a free mar-ket with minimum possible policy intervention. Instead of adopting the standard Business-As-Usual convention, the reference assumptions are therefore summarized under the nick FLEX
(representing flexibility). The remaining scenarios are more restrictive, allowing a maximum of 1 GW additional capacity installment per technology and year (which seems to be a more realistic expectation when historical capacity additions are considered), and assuming a constrained inc-rease in price elasticity from -0.01 to -0.02. In addition to such a Non-Flex scenario (NF1), two other non-flex scenarios are defined that include constraints on the adoption of natural gas com-bined cycle and wind power generation technologies. Scenario NF2 incorporates a policy restric-tion that limits natural-gas-fired power generarestric-tion capacity to a maximum of 40% of total instal-led capacity. This is a rather realistic policy constraint, as Turkey does not possess natural gas re-serves; besides, limiting import dependence is among the policy priorities of the energy decision-making community. The other non-flex scenario, NF3, enforces all the licenses granted by the Energy Market Regulatory Authority of Turkey for wind power generation facilities (totaling 928 MW). These license acquirements are not included under the reference assumptions, as they
do not represent binding agreements.4 The last non-flex scenario, NF4, includes a minimum
bound on renewable energy source utilization, as required by the renewable energy law proposal currently under discussion in the Turkish parliament. Accordingly, in each year (starting from 2005), an amount equal to at least 8% of total electricity generated in the previous year has to be composed of ‘new’ renewable energy sources (note that the large hydroelectric power plants in Turkey do not fall under the definition of renewable sources as defined in this draft law).5 The
scenario assumptions are summarized in Table 4.
Table 4. Scenario assumptions
Scenario Upper bound on capacity addition per technology
Price elasticity (2020 → 2025)
Technology adoption restrictions
FLEX 2 GW p.a. -0.01 → -0.05 No restriction
NF1 1 GW p.a. -0.01 → -0.02 No restriction
NF2 1 GW p.a. -0.01 → -0.02 Natgas/Total Cap. ≤ 40%
NF3 1 GW p.a. -0.01 → -0.02 Wind Turbine Licensing
NF4 1 GW p.a. -0.01 → -0.02 Draft Law (8% Renew.)
4.3 Model results
The model is written in GAMS and results have been obtained with the solver MINOS. Figure 4 illustrates the annually added capacities for each scenario and technology. Common to all scena-rios, the model predicts the installation of new power plant capacities starting from year 2008. This indicates that the current excess capacity level will be sufficient to meet the demand of the next three years. It is further observed that natural-gas-fired power plants constitute the most attractive choice in all scenarios. In scenario FLEX, natural gas combined cycle power plants are installed at their upper bounds (2 GW) in years 2016-2021. The reference scenario FLEX sug-gests no renewable power plant investment up to 2022. After that, only geothermal power plants are installed as a renewable alternative, with a total capacity of 1.6 GW. Scenarios NF1 and NF2
include biomass gas turbine CHP plants as a second renewable power generation alternative. Na-turally, biomass investments in NF2 are more widespread, due to the restrictions imposed on na-tural-gas-fired technology investments. Wind power comes into play only in scenario NF3 when all license grants are enforced. Combined with the learning effect, the technology becomes eco-nomically attractive by year 2020. Geothermal power is chosen as the most economic renewable alternative in the early years of the renewable energy law scenario NF4. However, the total pos-sible geothermal power capacity (4,300 MWe) is fully utilized until 2016, and biomass becomes
the emerging renewable choice thereafter.
4 In fact, several investors have recently acquired a wind power generation license with the expectation that this renewable alterna-tive might be subsidized by the public authority (otherwise, the licenses will remain just a piece of paper).
5 This necessity is not binding for eligible customers (customers with electricity consumption in the preceding year exceeding 9 GWh), as stated in the draft law. However, we have included it in order to cover all demand categories (since there is no such disaggregation in our model).
0 500 1000 1500 2000 2500 3000 2000 2002 2004 2006 2008 Year Ca pa cit y (MW ) Geothermal Wind Coal Lignite Oil Nat. Gas Hydro 0 500 1000 1500 2000 2500 3000 2008 2013 2018 2023 Year C apacity (MW ) Geoth. - FLEX Nat. Gas CHP - FLEX Nat. Gas CC -FLEX Oil - FLEX
(a) Capacity additions 2000-2008 (b) Scenario FLEX
0 500 1000 1500 2000 2500 3000 3500 4000 4500 2008 2013 2018 2023 Year Ca pac it y (MW) Biomass GT CHP - NF1 Geoth. - NF1 Nat. Gas CHP -NF1 Nat. Gas CC -NF1 Oil - NF1 Coal FBC CHP -NF1 0 500 1000 1500 2000 2500 3000 3500 4000 2008 2013 2018 2023 Year C apacity (M W ) Biomass GT CHP - NF2 Geoth. - NF2 Nat. Gas CHP -NF2 Nat. Gas CC -NF2 Oil - NF2 Coal FBC CHP -NF2 (c) Scenario NF1 (d) Scenario NF2 0 1000 2000 3000 4000 5000 6000 2008 2013 2018 2023 Year C ap acit y (M W ) Wind OS - NF3 Biomass GT CHP - NF3 Geoth. - NF3 Nat. Gas CHP -NF3 Nat. Gas CC -NF3 Oil - NF3 Coal FBC CHP -NF3 0 500 1000 1500 2000 2500 3000 3500 4000 4500 2008 2013 2018 2023 Year Cap acit y (M W ) Biomass GT CHP - NF4 Geoth. - NF4 Nat. Gas CHP -NF4 Nat. Gas CC -NF4 Oil - NF4 Coal FBC CHP -NF4
(e) Scenario NF3 (f) Scenario NF4
Figure 4. Composition of annual capacity additions, by scenario, 2008-2025
The share of renewables among new capacity additions is depicted in Figure 5. The peak in year 2022 is due to a 1,596 MW geothermal power plant installed in the reference scenario FLEX, which is the only capacity addition in that year (and the only renewable energy technology in-vestment in that scenario). Scenario NF1 with no renewable incentive/subsidization has the poo-rest renewable performance, as would be expected. A slightly better performance is observed in scenario NF2, where geothermal electricity generation is chosen in early years, and biomass after the geothermal reserves have been depleted. Scenario NF4 induces more renewable technology installations in early years, reaching 33% in 2014, but the share declines later on, and stabilizes at the 20-25% level range in the long run. In the long run, it is observed that scenario NF3 has the highest renewable share, reaching 39% in year 2025. This is due to the learning effect that occurs as a result of the licensed wind turbine installations in earlier years. In fact, this finding indicates the profound effect that technological learning might have on the results, and shows that policies
aimed at promoting renewable energy technologies – in the long run via learning – can induce a more widespread adoption than originally planned.
0 10 20 30 40 50 60 70 80 90 100 2008 2009 2010 2011 2012 2013 2014 2015 2016 2017 2018 2019 2020 2021 2022 2023 2024 2025 Year N ew r ene w abl es (% ) FLEX NF1 NF2 NF3 NF4
Figure 5. Percentage share of renewables among new capacity additions, 2008-2025
80 100 120 140 160 180 200 220 2000 2005 2010 2015 2020 2025Year Emissions (Mton) FLEX NF1 NF2 NF3 NF4 0 20 40 60 80 100 120 2000-2005 2000-2010 2000-2015 2000-2020 2000-2025 Period 140 Growth (%) FLEX NF1 NF2 NF3 NF4
(a) Levels (b) Growth rates
Figure 6. Development of CO2 emissions
The development of CO2 emissions is depicted in Figure 6. It can be observed that, in the long
run, the lowest emissions occur in scenario FLEX. This is interesting, as there is no investment in new renewable power generation technologies. The comparatively low level of CO2 emissions in
scenario FLEX can be explained by the extensive use of natural gas as a relatively clean fuel (which is mostly substituted by coal in the other scenarios). It becomes evident from NF2 results that the bounds imposed on natural-gas-fired technology adoption lead to the highest emissions among all the scenarios considered. The lowest emission levels within the non-flex scenarios are monitored in scenario NF3, i.e. the wind turbine licensing scenario. However, since the long-run
emissions of NF3 remain significantly above the emissions of FLEX, it can be said that the dif-fusion of wind power technology is not sufficient to offset the emission increase due to restricted natural gas use. The growth of emissions reaches considerable levels in the long run (e.g. in 2020 the increase from 2000 levels ranges from 38.4% in scenario FLEX to 71.3% in scenario NF2), as depicted in panel (b) of Figure 6.
5 Conclusions
In this paper we have studied how learning curves for renewable energy technologies can be in-tegrated into a dynamic programming model. The model built can guide optimal investment planning in the electricity supply sector and is based on real options theory. The model has been successfully applied to real data from Turkey. The results show that, due to existing excess power generation capacity, no capacity additions are needed up to the year 2008. Because of their relati-vely high costs, the diffusion of renewable energy technologies only occurs if targeted policies exist. The promotion of renewable energy technologies expands beyond the initial scope, due to an accelerated learning effect, through which the costs decline to a level at which they can suc-cessfully compete with non-renewable alternatives. This finding indicates the essence of techno-logical learning, and points out the importance of policies aimed at increasing the share of rene-wable power generation. Indeed, the results indicate that the legalization of the draft renerene-wable energy law currently under discussion in the Turkish parliament can significantly affect the evolu-tion of the technological structure of new electric capacity investments in the long run. In the absence of subsidies or other promotion policy instruments, market players can hardly be expec-ted to invest in more expensive renewable energy technologies, especially in a liberalized electrici-ty market environment. Financial incentives are needed in the short-term, in order to enable a widespread adoption of renewable energy technologies in the longer run.
Incentives to finance investments in costly renewable energy technologies can, for example, be created through the operationalization of the flexibility mechanisms introduced by the 1997 Kyo-to ProKyo-tocol. In the case of Turkey, it could be expected that the wind power licenses held by the private sector may turn into real investments through project-based support by the clean deve-lopment mechanism (CDM) or by joint implementation (JI). Turkey’s position with respect to CDM or JI projects is yet unclear6. However, the model results and projected CO
2 emission
growth rates show that allowances for increasing emissions, together with financial assistance for clean energy projects, is essential for a sustainable clean development of the country. Kyoto rati-fication should therefore bring Turkey into a position that features her to host CDM or JI pro-jects. The possibility of hosting such projects would lead to a variety of different clean energy technology investments, as early project proposals indicate (Kumbaroğlu et al., 2004). In this con-text, it can be said that the adoption of a Linking Directive, for example, as it is currently being considered by the EU to legalize the use of Kyoto mechanisms in Europe and to achieve econo-mic efficiency under the European Emission Trading Scheme (to be launched in January 2005), might induce technological learning and thus far more emission reduction in the long run than initially anticipated.
6 Turkey’s participation in the UNFCCC has been approved by the Grand National Assembly on October 21, 2003, and since May 2004 Turkey has became the 189th party to the convention. Turkey’s request to be withdrawn from Annex II has been accepted at the Marrakech Conference, and Turkey retained in Annex I subject to the condition to enjoy favorable conditions in accordance with the “common but differentiated responsibilities” principle of the UNFCCC. Hence, there exists some uncertainty regarding whether Turkey can host CDM or JI projects, which is due to the fact that the Kyoto Protocol has not yet been ratified.
References
Acar, H.I. (2003). A review of geothermal energy in Turkey, Energy Sources, 25(11): 1083-1088.
Alvarez, L.H.R., Keppo, J. (2002). The impact of delivery lags on irreversible investment under uncer-tainty, European Journal of Operational Research, 136(1): 173-180.
Argote, L., Epple, D. (1990). Learning curves in manufacturing, Science, 247(4945): 920-924.
Arıkan, Y., Güven, Ç., Kumbaroğlu, G. (1997). Energy-Economy-Environmental Interactions in a Gen-eral Equilibrium Framework: The Case of Turkey, in: D. Bunn and E. Larsen (eds.), Systems Modeling for Energy Policy, Ch.8, pp.117-139, J. Wiley & Sons, New York.
Awerbuch, S., Berger, M. (2003). Applying Portfolio Theory to EU Electricity Planning and Policy-Making, IEA/EET Working Paper EET/2003/03, International Energy Agency (IEA), Paris, Feb-ruary.
Demirbaş, A. (2002a). Sustainable developments of hydropower energy in Turkey, Energy Sources, 24(1): 27-40.
Demirbaş, A. (2002b). Turkey’s geothermal energy potential, Energy Sources, 24(12): 1107-1115. Dixit, A.K., Pindyck, R.S. (1994). Investment under Uncertainty, Princeton: Princeton University Press.
Dutton, J.M., Thomas, A. (1984). Treating progress functions as a managerial opportunity, Academy of Management Review, 9(2): 235-247.
Dyner, I., Larsen, E.R. (2001). From Planning to Strategy in the Electricity Industry, Energy Policy, 29(13): 1145-1153.
ECN (2004). Energy Research Centre of the Netherlands (ECN), MARKAL-MATTER Model Data, http://www.ecn.nl/ps/index.en.html .
Ediger, V.S., Kentel, E. (1999). Renewable energy potential as an alternative to fossil fuels in Turkey, En-ergy Conversion and Management, 40(7): 743-755.
EIA (1998). Assumptions to the Annual Energy Outlook 1999, U.S. Energy Information Administration, Report DOE/EIA-0554, Washington, DC.
Evrendilek, F., Ertekin, C. (2003). Assessing the potential of renewable energy sources in Turkey, Renew-able Energy, 28(15): 2303-2315.
Frayer, J., Uludere, N.Z. (2001). What Is It Worth? Application of Real Options Theory to the Valuation of Generation Assets, The Electricity Journal, 14(8): 40-51.
Hepbasli, A., Ozdamar, A., Ozalp, N. (2001). Present status and potential of renewable energy sources in Turkey, Energy Sources, 23(7): 631-648.
Hepbasli, A., Ozgener, L. (2004).Development of geothermal energy utilization in Turkey: a review, Re-newable and Sustainable Energy Reviews, 8(5): 433-460.
Ibenholt, K. (2002). Explaining learning curves for wind power, Energy Policy, 30(13): 1181-1189. IEA (2000). Experience Curves for Energy Technology Policy, OECD/IEA, Paris.
IEA (2001). Energy Policy of IEA Countries. Turkey 2001 Review, OECD/IEA, Paris. IEA (2003a). Power Generation Investment in Electricity Markets, OECD/IEA, Paris. IEA (2003b). Renewables Information 2003 with 2002 Data, OECD/IEA, Paris.
IEA (2004). Renewable Energy – Market & Policy Trends in IEA Countries, OECD/IEA, Paris.
Junginger, M., Faaij, A., Turkenburg, W.C. (2005). Global experience curves for wind farms, Energy Policy, 33(2): 133-150.
Kagiannas, A.G., Askounis, D.T., Psarras, J. (2004). Power generation planning: a survey from monopoly to competition, International Journal of Electrical Power & Energy Systems, 26(6): 413-421.
Kamp, L.M., Smits, R., Andriesse, C.D. (2004). Notions on learning applied to wind turbine development in the Netherlands and Denmark, Energy Policy, 32(14): 1625-1637.
Kaslow, T.W., Pindyck, R.S. (1994). Valuing flexibility in utility planning, The Electricity Journal, 7(2): 60-65. Kaygusuz, K. (2002). Sustainable development of hydroelectric power, Energy Sources, 24(9): 803-815. Kaygusuz, K., Kaygusuz, A. (2002). Energy and sustainable development in Turkey. Part I: Energy
utiliza-tion and sustainability, Energy Sources, 24(6): 483-498.
Kaygusuz, K., Kaygusuz, A. (2004). Geothermal energy in Turkey: the sustainable future, Renewable and Sustainable Energy Reviews, 8(6): 545-563.
Kaygusuz, K., Türker, M.F. (2002). Biomass energy potential in Turkey, Renewable Energy, 26(4): 661-678. Keppo, J., Lu, H. (2003). Real options and a large producer: the case of electricity markets, Energy
Econom-ics, 25(5): 459-472.
Kumbaroğlu, G. (2003). Environmental Taxation and Economic Effects: A Computable General Equilib-rium Analysis for Turkey, Journal of Policy Modeling, 25(8): 795-810.
Kumbaroğlu, G., Arıkan, Y., Sunam, A. (2004). The Clean Development Mechanism as a Useful Initiative to Promote the Development of Sustainable Environment Projects with Public-Private Participa-tion: Experiences from Turkey, Draft Working Paper.
Madlener, R., Kumbaroglu, G., Ediger, V. (2004). Modeling Technology Adoption as an Irreversible In-vestment Under Uncertainty: The Case of the Turkish Electricity Supply Industry, CEPE Working Paper No. 30, February (also published as Boğaziçi University Research Paper No. FBE-IE-03/2004-05).
McDonald, A., Schrattenholzer, L. (2001). Learning Rates for Energy Technologies, Energy Policy, 29(4): 255-261.
Mun, J. (2002). Real Options Analysis: Tools and Techniques for Valuing Strategic Investments & Decisions, J. Wiley & Sons, New York.
Neij, L. (1997). Use of experience curves to analyse the prospects for diffusion and adoption of renewable energy technology, Energy Policy, 25(13): 1099-1107.
Neij, L. (1999). Cost dynamics of wind power, Energy – The International Journal, 24(5): 375-389.
Oğulata, R.T. (2003). Energy sector and wind energy potential in Turkey, Renewable and Sustainable Energy Reviews, 7(6): 469-484.
Oğulata, R.T., Oğulata S.N. (2002). Solar energy potential in Turkey, Energy Sources, 24(12): 1055-1064. Ozgener, O., Hepbasli, A. (2002). Current status and future directions of wind energy applications in
Tur-key, Energy Sources, 24(12): 1117-1129.
Ronn, E.I. (Ed.) (2003). Real Options & Energy Management: Using Options Methodology to Enhance Capital Budg-eting Decisions, Risk Publishers, London, http://engineering-books-online.com/1899332987.html . Sahinidis, N.V. (2004). Optimization under uncertainty: state-of-the-art and opportunities, Computers &
Chemical Engineering, 28(6-7): 971-983.
Seebregts, A.J., Kram, T., Schaeffer, G.J., Stoffer, A. (1998). Endogenous technological learning: experiments with MARKAL, Publication BS: ECN-C--98-064, ECN, Petten, The Netherlands.
Söderholm, P., Sundqvist, T. (2004). Learning Curve Analysis for Energy Technologies: Theoretical and Econometric Issues, EMF/IEA/IIASA International Energy Workshop, 24-26 June 2003, IIASA, Laxenburg, Austria.
TEİAŞ (2002). Türkiye Elektrik İletim A.Ş.2001 Yılıİstatistikleri (Turkish Electricity Transmission Co. Year 2001 Statistics; in Turkish), Report APK-379, Turkish Electricity Transmission Corporation, Ankara.
Trigeorgis, L. (1996). Real Options, The MIT Press, Cambridge./Mass.
Turkenburg, W.C. (2000). Key trends in solar PV and wind energy development, Copernicus Institute for Sustain-able Development and Innovation, Utrecht University, Utrecht, The Netherlands, http://libdigi.unicamp.br/document/?view=1037
Vehviläinen, I., Keppo, J. (2003). Managing electricity market price risk, European Journal of Operational Re-search, 145(1): 136-147.
Woo, C-K., Lloyd, D., Tishler, A. (2003). Electricity market reform failures: UK, Norway, Alberta and California, Energy Policy, 31(11): 1103-1115.
WEC-TNC (1996). Turkey Energy Report – 1995, World Energy Council Turkish National Committee, Ankara.
WEC-TNC (2003). Turkey Energy Report – 2002, World Energy Council Turkish National Committee, Ankara.
Aebischer B. (1999), Veränderung der Elektrizitätskennzahlen im Dienstleistungssektor in der Stadt Zürich und im Kanton Genf. CEPE Report Nr. 1, Zürich, November.
Filippini M., Wild J., and Luchsinger C. (2001), Regulierung der Verteilnetzpreise zu Beginn der Marktöffnung; Erfahrungen in Norwegen und Schweden; Studie im Auftrag des Bundesamtes für Energie. CEPE Report Nr. 2, Zürich, Juli.
Aebischer B. and Huser A. (2002), Energiedeklaration von Elektrogeräten; Studie im Auftrag des Bundesamtes für Energie. CEPE Report Nr. 3, Zürich, Januar.
CEPE Working Papers
1999
Scheller A. (1999), Researchers' Use of Indicators. Interim Report of The Indicator Project. CEPE Working Paper No. 1, Centre for Energy Policy and Economics (CEPE), Zurich, September.
Pachauri S. (1999), A First Step to Constructing Energy Consumption Indicators for India. Interim Report of the Indicator Project. CEPE Working Paper No. 2, Centre for Energy Policy and Economics (CEPE), Zurich, September.
Goldblatt D. (1999), Northern Consumption: A Critical Review of Issues, Driving Forces, Disciplinary Approaches and Critiques. CEPE Working Paper No. 3, Centre for Energy Policy and Economics (CEPE), Zurich, September.
2000
Aebischer B. und Huser A. (2000), Monatlicher Verbrauch von Heizöl extra-leicht im Dienstleistungssektor. CEPE Working Paper Nr. 4, Zürich, Centre for Energy Policy and Economics (CEPE), September.
Filippini M. and Wild J. (2000), Regional Differences in Electricity Distribution Costs and their Consequences for Yardstick Regulation of Access Prices. CEPE Working Paper No. 5, Centre for Energy Policy and Economics (CEPE), Zurich, May.
Christen K., Jakob M., und Jochem E. (2000), Grenzkosten bei forcierten Energiespar-massnahmen in Bereich Wohngebäude - Konzept vom 7.12.00. CEPE Working Paper Nr. 6, Centre for Energy Policy and Economics (CEPE), Zürich, Dezember.
2001
Luchsinger C., Wild J., and Lalive R. (2001), Do Wages Rise with Job Seniority? – The Swiss Case. CEPE Working Paper No. 7, Centre for Energy Policy and Economics (CEPE), Zurich, March.
CEPE Reports and CEPE Working Papers can mostly be downloaded free of charge in pdf-format from the CEPE Website (www.cepe.ethz.ch). Alternatively, they may be ordered from: CEPE, Secretariat, ETH Zentrum, WEC C12.1, CH-8092 Zurich, Switzerland.
Centre for Energy Policy and Economics (CEPE), Zurich, June.
Jakob M., Primas A., und Jochem E. (2001), Erneuerungsverhalten im Bereich Wohngebäude – Auswertung des Umfrage-Pretest. CEPE Working Paper Nr. 9, Zürich, Centre for Energy Policy and Economics (CEPE), Oktober.
Kumbaroglu G. and Madlener R. (2001), A Description of the Hybrid Bottom-Up CGE Model SCREEN with an Application to Swiss Climate Policy Analysis. CEPE Working Paper No. 10, Centre for Energy Policy and Economics (CEPE), Zurich, November.
Spreng D. und Semadeni M. (2001), Energie, Umwelt und die 2000 Watt Gesellschaft. Grundlage zu einem Beitrag an den Schlussbericht Schwerpunktsprogramm Umwelt (SPPU) des Schweizerischen National Fonds (SNF). CEPE Working Paper Nr. 11, Centre for Energy Policy and Economics (CEPE), Zürich, Dezember.
2002
Filippini M. and Banfi S. (2002), Impact of the new Swiss Electricity Law on the Competitiveness of Hydropower, CEPE Working Paper No. 12, Centre for Energy Policy and Economics (CEPE), Zurich, January.
Filippini M., Banfi S., and Luchsinger C. (2002), Deregulation of the Swiss Electricity Industry: Implication for the Hydropower Sector, CEPE Working Paper No. 13, Centre for Energy Policy and Economics (CEPE), Zurich, April.
Filippini M., Hrovatin N., and Zoric J. (2002), Efficiency and Regulation of the Slovenian Electricity Distribution Companies, CEPE Working Paper No. 14, Centre for Energy Policy and Economics (CEPE), Zurich, April.
Spreng D., Scheller A., Schmieder B., und Taormina N. (2002), Das Energiefenster, das kein Fenster ist, CEPE Working Paper Nr. 15, Centre for Energy Policy and Economics (CEPE), Zürich, Juni.
Fillippini M. and Pachauri S. (2002), Elasticities of Electricity Demand in Urban Indian Households, CEPE Working Paper No. 16, Centre for Energy Policy and Economics (CEPE), Zurich, March.
Semadeni M. (2002), Long-Term Energy Scenarios: Information on Aspects of Sustainable Energy Supply as a Prelude to Participatory Sessions, CEPE Working Paper No. 17, Centre for Energy Policy and Economics (CEPE), Zurich, Juli.
Müller A. (2002), Finding Groups in Large Data Sets, CEPE Working Paper No. 18, Centre for Energy Policy and Economics (CEPE), Zurich, October.
2003
Farsi M. and Filippini M. (2003), Regulation and Measuring Cost Efficiency with Panel Data Models: Application to Electricity Distribution Utilities, CEPE Working Paper No. 19, Centre for Energy Policy and Economics (CEPE), Zurich, January.
CEPE Reports and CEPE Working Papers can mostly be downloaded free of charge in pdf-format from the CEPE Website (www.cepe.ethz.ch). Alternatively, they may be ordered from: CEPE, Secretariat, ETH Zentrum, WEC C12.1, CH-8092 Zurich, Switzerland.
Economics (CEPE), Zurich, January.
Müller A. and Luchsinger C. (2003), Incentive Compatible Extraction of Natural Resource Rent, CEPE Working Paper No. 21, Centre for Energy Policy and Economics (CEPE), Zurich, January.
Jakob M. and Madlener R. (2003), Exploring Experience Curves for the Building Envelope: An Investigation for Switzerland for 1970-2020, CEPE Working Paper No. 22, Centre for Energy Policy and Economics (CEPE), Zurich, March.
Banfi S., Filippini M., and Hunt, L. C. (2003), Fuel Tourism in Border Regions, CEPE Working Paper No. 23, Centre for Energy Policy and Economics (CEPE), Zurich, March.
Semadeni M. (2003), Energy Storage as an Essential Part of Sustainable Energy Systems: A Review on Applied Energy Storage Technologies, CEPE Working Paper No. 24, Centre for Energy Policy and Economics (CEPE), Zurich, May.
Pachauri S. and Spreng D. (2003), Energy Use and Energy Access in Relation to Poverty, CEPE Working Paper No. 25, Centre for Energy Policy and Economics (CEPE), Zurich, June. Aruga K. (2003), Differences in Characteristics of Religious Groups in India: As seen from Household Survey Data, CEPE Working Paper No. 26, Centre for Energy Policy and Economics (CEPE), Zurich, August.
Madlener R. and Wickart M. (2003), The Economics of Cogeneration Technology Adoption and Diffusion: A Deterministic Model, CEPE Working Paper No. 27, Centre for Energy Policy and Economics (CEPE), Zurich, December.
Madlener R. (2003), Modelling the Adoption and Diffusion of Decentralised Energy Conversion Technologies with Hazard Rate Models, CEPE Working Paper No. 28, Centre for Energy Policy and Economics (CEPE), Zurich, December.
Madlener R., Robledo C., Muys B., Hektor B., and Domac J. (2003), A Sustainability Framework for Enhancing The Long-Term Success of LULUCF Projects, CEPE Working Paper No. 29, Centre for Energy Policy and Economics (CEPE), Zurich, December.
2004
Madlener R., Kumbaroglu G., and Ediger V. S. (2004), Modeling Technology Adoption as an Irreversible Investment Under Uncertainty: The Case of the Turkish Electricity Supply Industry, CEPE Working Paper No. 30, Centre for Energy Policy and Economics (CEPE), Zurich, February.
Jakob M. (2004). Entwicklung des Erdgasabsatzes zwischen 1990 und 2000 und Perspektiven bis 2010 aus Sicht der Schweizerischen Gasversorgungsunternehmen – Weiterführender dokumentierender Arbeitsbericht der empirischen Arbeiten. CEPE-Working-Paper No 31, Centre for Energy Policy and Economics (CEPE), Zurich, April. Farsi M., Filippini M., and Greene W. (2004), Efficiency Measurement in Network Industries: Application to the Swiss Railway Companies, CEPE Working Paper No. 32, Centre for Energy Policy and Economics (CEPE), Zurich, June.
CEPE Reports and CEPE Working Papers can mostly be downloaded free of charge in pdf-format from the CEPE Website (www.cepe.ethz.ch). Alternatively, they may be ordered from: CEPE, Secretariat, ETH Zentrum, WEC C12.1, CH-8092 Zurich, Switzerland.
CEPE Reports and CEPE Working Papers can mostly be downloaded free of charge in pdf-format from the CEPE Website (www.cepe.ethz.ch). Alternatively, they may be ordered from: CEPE, Secretariat, ETH Zentrum, WEC C12.1, CH-8092 Zurich, Switzerland.
for Energy Policy and Economics (CEPE), Zurich, July.
Banfi S., Filippini M., and Luchsinger C. (2004), Resource Rent Taxation – A New Perspective for the (Swiss) Hydropower Sector, CEPE Working Paper No. 34, Centre for Energy Policy and Economics (CEPE), Zurich, August.
Kumbaroglu G., Madlener R., and Demirel M. (2004). A Real Options Evaluation Model for the Diffusion Prospects of New Renewable Power Generation Technologies, CEPE Working Paper No. 35, Centre for Energy Policy and Economics (CEPE), Zurich, September.