AN EXAMINATION OF THE RELATIONSHIP BETWEEN
RAPA NUI
AHU
AND TOPOGRAPHY USING STRUCTURE
FROM MOTION AND GIS
by
ELIZA PEARCE
A THESIS
Presented to the Departments of Geography and Environmental Science and the Robert D. Clark Honors College
in partial fulfillment of the requirements for the degree of Bachelor of Arts or Science
An Abstract of the Thesis of
Eliza Pearce for the degree of Bachelor of Arts
in the Departments of Geography and Environmental Science to be taken Fall 2015
Title: An Examination of the Relationship between Rapa Nui Ahu and Topography
using Structure from Motion and GIS
Associate Professor Mark F onstad
Recent studies about Rapa Nui (Easter Island) have shed a new light upon the
movement of the island's giant statues ( moai) and platforms ( ahu) showing that they
were purposeful projects created by small communities around the island. What remains unclear, however, is the full meaning and purpose of the giant structures created by the ancient Rapanui. A current working theory is that the structures were costly signals to other clans on the island as a way to mark rare fresh water resources. For this study, imagery was collected of the south coast of the island and then used in conjunction with Structure from Motion to create topographic data for the area. Various GIS analyses
were then run on different aspects of the landscape around the different types of ahu
(those with moai and those without). None of the statistics run on the data acquired
from running these analyses indicate any significant difference between the topographic
placement of the two types of ahu. This lack of significance shows that topography does
was not an influential factor in the placement of these features and whatever factors were involved, they did not have a topographical relationship. This means that other
relationships like water sources were perhaps more important for ahu placement.
iii
Acknowledgements
I would like to thank my advisors Dr. Mark Fonstad, Dr. Terry Hunt and Dr. Nick Kohler for taking the time to be on my thesis board and advise me during this process. I would especially like to thank Dr. Fonstad for his consultation and help with all the data. An additional thanks needs to be made to Dr. Hunt and Drs. Lipo and Lee from CSULB for accepting me as an undergraduate research assistant on their trip to Rapa Nui in early January 2015. This thesis is meant to tie into their continuing research about Rapa Nui and is based off of data and research conducted on the island. The work I have done would not have been possible without the amazing opportunity they
provided me.
I would also like to thank my amazing parents, Josie and Ken, who have stood by and supported me throughout my time here at the University of Oregon and in the Clark Honors College. Their help, encouragement, and engagement with all I do has been invaluable.
A special thanks to CHC advisor Miriam Rigby for helping me through the logistics of the thesis defense and thank you to thank Reed College for providing their Thesis Template for the inspiration of many elements of this thesis template. It has saved me a lot of grief.
iv
Table of Contents
Part 1: Introduction 1 Purpose 2 Part 2: Background 4 Rapa Nui 4 Geography 4History and the Conventional Narrative 6
Ahu 12
Costly Signaling and Water 18
Topography 22
Effect of Slope on Walking 23
Visibility in Archeology 25
Part 3: Field Work and Data Analysis Methods 28
Data Collection 28
Structure from Motion and Topography 32
Topography 34
Ground Calibration 37
Processing 38
Errors 45
ArcGIS Processing 47
Ahu and Coastline Identification 49
Batch and Model Data Processing 53
Removing Extraneous Data 57
Elevation and Viewshed Analysis 60
Extracting Slope Data 64
Part 4: Data Analysis and Discussion 67
Normalizing Data 69 The T-Test 73 Discussion 79 Errors 81 Future Research 82 Part 5: Conclusion 84
v
Appendix A: Terms 86
Appendix B: Tables 89
vi
Accompanying Materials
I have made all of my data and work files available to Drs. Terry Hunt and Carl Lipo in case any work I have done for this paper may be of use in their future research on Rapa Nui. Copies of my data and files will be kept with them in their Network Attached Storage.
vii
List of Figures
Figure 1: Map of Rapa Nui showing basic topography and the major landmarks 4
Figure 2: Rapa Nui Isolation 6
Figure 2: Classic photo of just the moai heads 11
Figure 3: Moai in Pop Culture 11
Figure 4: Moai standing on an Ahu 12
Figure 5. Image ahu 16
Figure 6. Ahu 17
Figure 7. Image Ahu with Various Iterations 17
Figure 8. The UX5 Drone 31
Figure 9. UX5 Flight Areas 31
Figure 10. Final Checks of the Drone before a Launch 32
Figure 11: Structure from Motion Diagram 33
Figure 12: Camera Angles and Overlap in Photoscan 37
Figure 13. Photoscan Processing: Sparse Point Cloud 41
Figure 14. Photoscan Processing: Dense Point Cloud 41
Figure 15. Photoscan Processing: Wireframe 42
Figure 16. Photoscan Processing: Solid 42
Figure 17. Photoscan Processing: Shaded 43
Figure 18. Photoscan Processing: Texture 43
Figure 19. Photoscan Processing: Orthophoto Output 44
Figure 20. Photoscan Processing: DEM Output 44
Figure 21. South Coast Orthophotos and Ahu Points 51
Figure 22. Identifying “Image Ahu” 52
Figure 23. Identifying “Ahu” 52
Figure 24. Identifying “Ahu?” 53
Figure 25. ModelBuilder Example 57
Figure 26. Removing Extraneous Data Before 59
Figure 27. Removing Extraneous Data After 59
Figure 28. Elevation within 5m of Ahu 63
Figure 29. Visual Raster Output of Observation Points 63
viii
Figure 31. 50m Closest Coast Points Buffer Isolating Slope Data 66
Figure 32. 50m Ahu Buffer Isolating Slope Data 66
Figure 33. Elevation t-Test Results 76
Figure 34. Area Visible by Ahu t-Test Results 76
Figure 35. Distance to Closest Coast Point t-Test Results 77
Figure 36. Slope Surrounding Closest Coast Points t-Test Results 77
Figure 37. Slope Comparison between Image Ahu and Coastline t-Test Results 78 Figure 38. Slope Comparison between Ahu and Coastline t-Test Results 78
ix
List of Tables
Table: Skew Indicators 73
Table 1: Basic Flight Data 89
Table 2: Basic Ahu Data 91
Table 3: Ahu Elevation Data 96
Table 5: Closest Coast Points to Ahu 101
Table 6: Data for Slope within 50m of Closest Coast Points of Ahu 103
Table 7: Slope data for the Whole Coast Within 50m 106
Part 1: Introduction
In November of 2014, I was selected for an amazing opportunity to travel to the remote island Rapa Nui (Easter Island) as an undergraduate research assistant for Professors Carl Lipo and Christopher Lee from CSU Long Beach (CSULB) and Dean Terry Hunt of the Clark Honors College at the University of Oregon. Thus, I spent the first twenty days of January 2015 on an island in the Pacific helping to conduct
research. Carl Lipo and Terry Hunt have been working on Easter Island for several years now and have made some ground-breaking discoveries regarding the movement of the giant stone statues on the island (moai) and the cultural dynamics of the island’s pre-historic people.1 In their continuing research on the Rapa Nui, they have been able
to bring out students through Research Experiences for Undergraduate (REU) funding through the National Science Foundation (NSF) to help with various projects.
The project I helped the professors work on while on Rapa Nui was collecting areal imagery of the island’s South Coast. This was done via the use of a drone and the result was incredibly high-resolution photos. From these images and structure-from-data technology, three-dimensional reconstructions of the landscape can be created along with composites of all the images that allow information and data to be gleaned regarding the topography of the ground and features upon it.
Using this collected data, I was able to search out and identify pre-historic man-made features such as the moai and ahu. Moai are the famous stone statues placed around the island and ahu are long, low platforms made of stone that were built by the
2
prehistoric Rapanui. Some ahu have moai placed on top of them (image ahu) and there are also others that do not (ahu). While most of the moai are mapped and documented,
ahu without associated statues are more likely to be accidentally overlooked from a ground perspective since they can simply look like a pile of stones. It is much easier, however, to identify their unique, long form from aerial photographs. In addition to locating these features, my study focuses on their locational relationship to the topography of the area.
Purpose
Almost all ahu and finished moai are found close to the coast. While it is sometimes thought that the moai face outwards towards the ocean (as a means of protection and look out), in reality they all face inwards towards the land. This is because rather than warriors or guardians, the statues represent ancestors meant to watch over and be respected by the people.2 For this study, I analyzed the relationship between the locations of ahu with their surrounding topography in order to see if there is a significant relationship between the two; to see if topography was a deciding factor in terms of where the ancient Rapanui decided to place and build these giant
architectural feats, whether building locations were chosen randomly along the coastline or not.
This is an important and relevant study because not much is known about the spatial reasoning behind why various features are placed where they are. A significant relationship between low topography and anthropogenic features would help support
3
ideas that the ahu and moai serve additional functionality rather than simply being ancestors to respect. Drs. Hunt and Lipo have a working hypothesis that the statues and platforms relate to freshwater and other resources. Proving coastal access is near these sites, would thus tie my research into further data being collected and studied about coastal freshwater. Lower coastal elevation and slope generally indicate better ocean access, features placed in such locations could have been demarcations or claims to the area and the resources such an area provided.
In order to fully analyze and understand this relationship, I asked a few broad questions: How are ahu structures positioned on the landscape? Is there a locational difference between ahu and image ahu structures that denotes a difference in purpose? Are these features near where water resources are more accessible? Are these features in places that make them more visible? These broad questions I later broke down into seven more specific questions related to the tests I was running:
1. Are image ahu at higher elevations than ahu? 2. Do image ahu have a larger viewshed than ahu? 3. Are image ahu closer to the coast than ahu?
4. Is the coastal slope near image ahu less steep than the coastal slope near ahu? 5. Is the coastal slope near image ahu less steep than the general slope of the
coast?
6. Is the coastal slope near ahu less steep than the general slope of the coast? 7. Is the ground slope around image ahu steeper than the ground slope around
ahu?
I used all of these questions to guide my research and methods in examining the relationship between the ahu and topography on Rapa Nui.
4
Part 2: Background
Rapa Nui
Geography
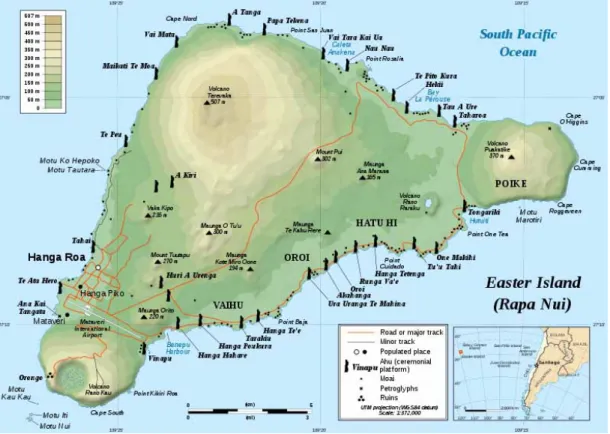
Figure 1: Map of Rapa Nui showing basic topography and the major landmarks Source: http://www.crystalinks.com/easterisland.html
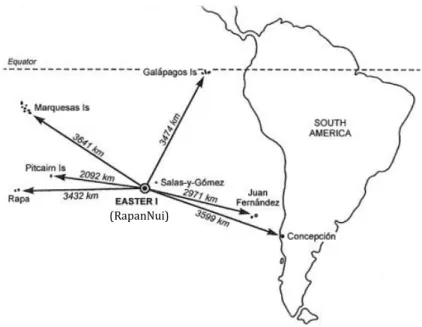
Halfway between Chile and Tahiti Located lies the island of Rapa Nui, or as Europeans called when first landing there, Easter Island. Rapa Nui is small, only about 63 square miles, and one of the farthest, most remote reaches of the world; Tahiti is about 2,500mi to the west, Chile about 2,300mi to the east and the closest inhabited land is Pitcairn Island, approximately 1,300 miles away (fig 2).3 Like most islands in
5
the Pacific, Rapa Nui is volcanic and the three points of its roughly triangular shape consist of the extinct volcanoes whose activity formed the island: Rano Kau, Poike, and Terevaka (fig. 1). The general landscape is that of rolling grassy hills interspersed with rough lava fields and old volcanic craters and parasitic cones. Given the island’s
volcanic origins, the island is mainly basalt and andesitic rock as well as some scoria and obsidian. The soil on the island consists mainly of loams and clays.4
Just south of the Tropic of Capricorn, Rapa Nui’s climate is subtropical with an annual average temperature of 68.5°F and some rain falls 140 days out of the year. March to June are the rainiest months and August to December the driest but heavy rainfall, often in squalls, can occur any time during the year.5 While the island sees a
good amount of rainfall throughout the year, it is quickly absorbed by the porous volcanic bedrock so the land rarely remains wet. There are also no permanent natural sources of freshwater on the island; no perennial rivers and only two lakes, both standing water and located in the craters of volcanoes, though stagnant water can also collect in lava tubes.
Unlike many tropical islands, Rapa Nui has no barrier reef. This leaves the island exposed to the ocean whose rough seas have, over time, created cliffs along much of the shore line. There are three sandy beaches on the island but all are on the two more northern sides of the island. The southern coast has spots where coastal access is easier but these remain rocky.
4 "About Rapa Nui." Easter Island Statue Project Official Website RSS. 5 "Easter Island Travel Guide."
6 Figure 2: Rapa Nui Isolation
This image shows Rapa Nui (Easter Island) and its distance to other inhabited lands. The island labelled “Rapa” refers to Rapa Iti not Rapa Nui.
Source: http://www.bibliotecapleyades.net/arqueologia/eastern_island/easter01.htm
History and the Conventional Narrative
Despite the island’s isolation, Rapa Nui is home to some of the most fantastic prehistoric architectural feats known, the moai. There are hundreds of these large statues placed all around the island, with each one carved from a quarry on the side of a volcano called Rano Raraku and then transported, sometimes all the way across the island, until they reached their final permanent destination (fig. 1).
The earliest radio carbon dating places initial settlement of Rapa Nui by Polynesians around 1200 CE and Europeans first came in contact with the island in
7
1722 when the Dutch explorer Jacob Roggeveen stayed for a few days on the island.6 Roggeveen and subsequent explorers and scientists observed the large statues and relatively small number of indigenous people (a few thousand) and wondered how such monumental structures could have been created.7 As the chief pilot of Cpt. Don Felipe González’s 1770 voyage wrote:
“That a people lacking machinery and materials for constructing any should be able to raise the crown or headpiece on to a statue of such height causes wonder, and I even think that the stone of which the statues are made is not a product of the island, in which iron, hemp, and stout timber are absolutely unknown. Much remains to be worked out on this subject.”8
The base assumption underlying this and following ideas about the statues, is that ingenious tools and a large population must have been needed to create them. Thus, there must have been must have once been a great, ancient Rapanui civilization which, after having made hundreds of statues, for some reason collapsed consequently when Europeans arrived they encountered the “depleted” population. This in turn has given rise to speculation as to what caused this population collapse. Some look to various aspects of native oral traditions or use pieced bits or evidence while others like go to the extreme to explain moai.
The idea that no one knows how the moai were constructed and moved or by whom has resulted in the majority of those uneducated in the subject believing that Easter Island is a bare and desolate place with no people, just statues. The truth, however, is that there has been continuous occupation of the island throughout its
6 Corney; Roggeveen. The Voyage of Captain Don Felipe González. 1908 7 Corney; Roggeveen. The Voyage of Captain Don Felipe González. 1908
8
known history, and while its population was diminished due to disease and slaving to a mere 110 people at one point, there are still decedents of the indigenous people living on the island today.9 There is a common misconception among the general public that the Moai are simply large stone heads due to years of their depiction in popular culture as such. This idea has been propagated by the classic stock image from the quarry Rano Raraku (fig. 3), where the statues were carved, as well as their portrayal as simply heads in various media forms, from comics to cartoons to movies (fig. 4). In reality though, the statues are full-bodied and when properly placed, stand upright and erect (fig. 5).
While there have been many different narratives regarding the island’s pre-history over the years, most have since been dismissed by the general public, that the statues were made by aliens10 or that they were the work of white Egyptians and Incans11. In their place is the current conventional narrative of the island, an idea presented by Jared Diamond in his book Collapse. By his account, when the Polynesians first arrived on it Rapa Nui was a lush paradise and a prosperous
civilization was established. As time went on, a ruling class forced their people to create
moai in order to honor the ancestors and encouraged a so-called moai cult of intense building competition. In order to build and move these moai wood and plant materials were required and so the Rapanui cut down all of the trees that once existed on the island. With no more trees, the topsoil washed away and food became scarce. The Rapanui were then unable to sustain themselves on the island and they turned to
9 Hunt, Lipo. 2011
10 Däniken. Chariots of the Gods?: Unsolved Mysteries of the Past. 1970
9
cannibalism as their civilization collapsed. They caused their own demise through ecocide.12
Diamond’s theory, like the ones before, though, still labors under the assumption that there must have once been a great civilization under which the moai were
constructed that disappeared before the Europeans arrived. There is a new explanation as to how the moai were moved, however, that goes against this idea. Using the physical characteristics of the moai, Drs. Carl Lipo and Terry Hunt have constructed a new fact-based and clarified narrative for the island, one where the pre-historic population remained stable and that the populace encountered by the Europeans was, in fact, a healthy and thriving community, one which only began to collapse post-contact due to disease and slavers. Lipo and Hunt were able to show that moai were not moved in a completely finished state. Rather, when the moai were initially carved, they had a much further forward center of gravity. The resulting forward lean meant that through the use of three ropes tied around the head area, if the moai was rocked back and forth while twisting it forward, it could be moved by relatively few people.13 If the moai could be
moved this easily, there would have been no need for a big population to supply the laborers needed to move the statues and thus there would be no need to try to explain some sort of disappeared society. With this revealed, the changes in landscapes and land cover become less important to the overall story, with palm tree loss being explained by the introduction of rats that ate the palm seeds and saplings instead of clearing for
12 Diamond. "Twilight at Easter." Collapse: How Societies Choose to Fail or Succeed. 2005 13 Hunt, Lipo. 2011
10
agriculture by the natives.14 This is supported by the observations of Jacob Roggeveen in 1772:
“Nor can the aforementioned land be termed sandy, because we found it not only not sandy but on the contrary exceedingly fruitful, producing bananas, potatoes, sugar-cane of remarkable thickness, and many other kinds of the fruits of the earth; although destitute of large trees and domestic animals, except poultry. This place, as far as its rich soil and good climate are concerned, is such that it might be made into an earthly Paradise, if it were properly worked and cultivated; which is now only done in so far as the Inhabitants are obliged to for the maintenance of life.”15
Hunt and Lipo’s explanation shows that the indigenous Rapanui were smart and well aware of their surrounding environment, unlike their depiction in previous narratives. Rather than labor being forced upon people, Hunt and Lipo show that moai making and moving was a group activity of choice and there was deliberation behind the making and moving of each one.
14 Hunt, Lipo. 2011 15 Corney; Roggeveen. 1908
11 Figure 2: Classic photo of just the moai heads
Buried moai in Rano Raraku. Photo taken by author
Figure 3: Moai in Pop Culture
From left to right: depictions of moai in the movie Night at the Museum, The Simpsons, and a Batman comic. Source: http://www.moaiculture.com/popculture.html
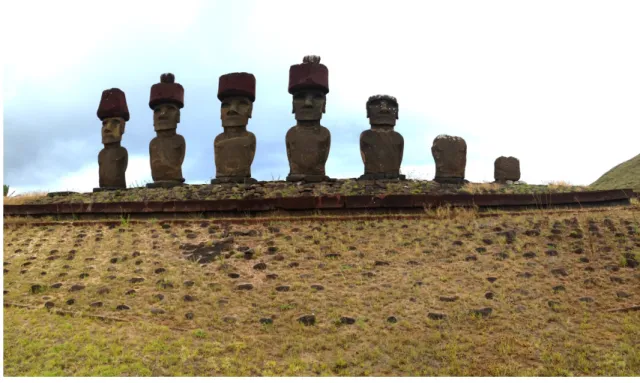
12 Figure 4: Moai standing on an Ahu
Ahu Nau Nau. Once scattered, this ahu has been reconstructed and these maoi with their pukau re-erected to stand on top as they once did. Photo taken by author
Ahu
While the moai are generally the first thing that comes to mind when “Easter Island” is mentioned, there are also other large archeological structures that can be regularly seen throughout the landscape, ahu. These are long low platforms upon which the moai were placed. These places are considered to have once been ceremonial
locations and gathering places for the prehistoric Rapanui, community locations for local “clans” or family groups. Rather than simply being ceremonial sites, people would live and farm in the areas around the ahu with the large stone statues placed with their backs to the sea and looking down on them. Even with this understanding, the ahu and their purpose could have meant many things to the ancient Rapanui and whatever the
13
original intent, it is well documented that burials took place there at least during historical times. As Captain Cook, leader of the third European party to disembark on Rapa Nui, noted in 1774:
“The gigantic statues, so often mentioned, are not, in my opinion, looked upon as idols by the present inhabitants, whatever they might have been in the days of the Dutch; at least I saw nothing that could induce me to think so. On the contrary, I rather suppose that they are burying-places for certain tribes or families. I, as well as some others, saw a human skeleton lying in one of the platforms, just covered with stones.” 16
Visitors to the island continued to note the remains found near ahu and a century later in 1886, William Thompson, the paymaster of the U.S.S. Mohican recorded this
description of ahu:
“The platforms differ greatly in dimensions, but the general plan and characteristics are inevitably the same. Many of them are in a fair state of preservation, except that the images have been thrown down and the terraces in the rear obliterated or strewn with rubbish, while others have been reduced to a state of complete ruin. The platforms are usually located near the beach, and on a high bluff some of them are quite near the edge, overlooking the sea. The general plan consists of a front elevation composed of blocks of stone fairly squared and neatly fitted together without cement, a parallel wall forming the inside boundary, built of uncut stone, inclosing small chambers or tombs placed at irregular intervals. [Thompson’s reference’s to “front” and “rear” are opposite as, when confronted with all of the maoi fallen over, he assumed that the moai faced outwards towards the sea when they’d originally stood rather than inland] Loose bowlders [sic] fill the spaces between the tombs and form the horizontal plane of the platform, into which are let the rectangular stones which constituted the base upon which the statues stood. The façade stones are large and heavy, and in some cases the smooth surface presented could not well be attributed to the ride implements at the command of the builders and must have been produced by friction or grinding. Long wings composed of uncut stone extend from the platform proper, built up to the summit at the ends. In the rear of the platform a few steps descend to a gently sloping terrace,
14
which terminates in a low wall and is bounded by a squarely built wall raised above the ground so as to join the top of the platform.”17
William Thompson is considered to have conducted the first archeological investigation on the island during his two week stay and many others would follow, noting the ahu, describing their features and categorizing them. There remains a general similarity throughout these descriptions, all noting the same general rectangular form and winged ends with the large wall in back and sloping ramp in front (fig. 5).18
While ahu that supported moai (image ahu) were the main subject of
investigation and note for those initial explorers and archeologists to the island, there are structures on the Rapa Nui that have a largely similar basic shape to the image ahu, being low and long, but are generally simpler in their construction and have no
associated statues. These ahu are also found near the coast but they tend to have a much greater variation in size, and, rather than the wings and squared ends of the image ahu, their ends tend to taper (fig. 6). Sometimes there is a front slope and strong back wall associated with them but this is generally not the case. Captain Cook described some of these features in his journal:
“Besides the monuments of antiquity, which were pretty numerous, and nowhere but on or near the sea-coast, there were many little heaps of stones, piled up in different places along the coast. Two or three of the uppermost stones in each pile were generally white, perhaps always so, when the pile is complete. It will hardly be doubted that these piles of stone had a meaning; probably they might mark the place where people had been buried, and serve instead of the large statues.”19
17 Thompson. Te Pitot e Henua, or Easter Island. 1886
18 Beardsley. Spatial Analysis of Platform Ahu on Easter Island. Dissertation. 1990 19 Cook and Furneaux. 1777
15
As Cook noted, it is impossible to understand exactly what these different forms of ahu
meant to the Rapanui but they undoubtedly served some purpose.
Some archeologists have tried to classify Rapa Nui prehistory into various periods and fit various types of ahu construction within these time frames but in their study of the inland image ahu complex of A Kivi-Vai Teka, Mulloy and Figueroa found that:
“From the point of view of image ahu architecture, a single, coherent, continuously developing pattern of ideas is represented. In terms of general conception and apparent cultural function as well as detailed architectural characteristics this sequence of structures demonstrates a clear and detailed, unbroken chronological progression such as might be expected from the architectural reflection of the activities of a single continuously developing society. No evidence is interpreted as revealing a chronological break in the sequence such as might suggest a population replacement, the intrusion of a new cultural pattern or even a period of sudden cultural renaissance. The evidence indicates that, from the point of view of image ahu architecture, this part of the local history can most meaningfully be seen as a single period of uninterrupted development characterized by gradual introduction of new ideas, the expansion of themes and improvement of capacities.”20
Indeed, several ahu, particularly image ahu, show signs of reworking, rebuilding and/or maintenance taking place since their initial creation. This can be noticed when there are square-ended outlines indicating where a previous ahu was once built or if an ahu
angles in the middle rather than being straight (fig. 7). In addition, some of the large blocks used as the outside walls of the ahu can be identified as the heads and bodies of
moai that presumably fell, broke and were then repurposed. These maoi generally have the rounder, less long head shape that is characteristic of older moai styles. It should be
16
noted, however, that the simple lack of discernable difference between features does not indicate that no timeline or chronological difference exists.
Figure 5. Image ahu
The central part of the image ahu is thicker, more solid, and rectangular and is where the moai (now fallen) once stood. To either side stretches out the squared “wings” while in front is the sloping ramp where evenly spaced smooth, rounded rocks were placed. A historic wall has been made using/intersecting the image ahu.
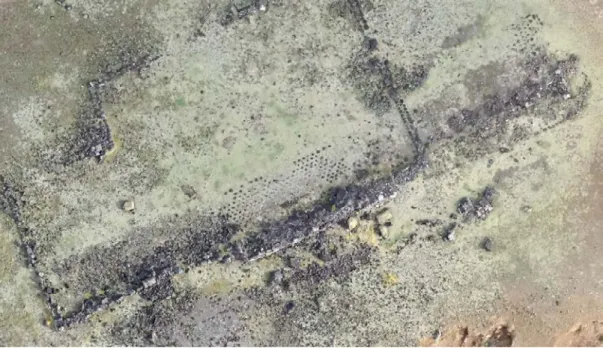
17 Figure 6. Ahu
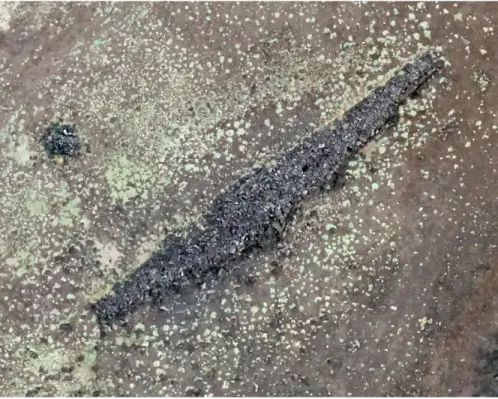
A well preserved ahu with no associated moai. The construction is still the same with a retaining outer-wall of larger stones, but the ends of the structure are much pointier and there are less associated defining factors.
Figure 7. Image Ahu with Various Iterations
This image ahu has had several stages to it. The front rectangular outline and wings are clear as are another set behind and at a slightly different angle.
18 Costly Signaling and Water
The construction and moving of a moai would have been a long term and significant event given their size and the distance they were moved to locations around the island. While no one can know exactly the rationale behind the Rapanui’s
construction of the enormous moai and ahu, one concept that could have been an underlying driver to their construction is costly-signaling.
Costly-signaling is the notion that large structures and other “frivolous” visible possessions indicate a level of wealth, health, or status because those in possession of such signals must be able to handle the “cost” placed upon the individual. This cost is often the diversion of energy to create the feature, like with peacocks putting energy into growing their elaborate tails rather than getting bigger themselves (it does not have to be a conscious decision). In modern human societies, the cost is often monetary as people buy objects that have little functional value except to display the wealth of the owner.21 These costly signals are generally visual and moai and ahu would fall into this category, their size and scale indicating to others that those involved in their
construction had enough resources and “wealth” to deal with the cost that came from erecting such features.
The moai could also be involved in costly-signaling by delineating members of a group. As Smith and Bliege say, “another type of collective good that may be a form of costly signaling involves punishing those who free-ride on the group’s cooperative activities or otherwise violate group-beneficial norms.”22 There were once several
21 Hunt, Lipo. 2011
19
different family “clans” living in around Rapa Nui that were associated with specific areas of the island.23 In talking to Dr. Lipo, he is of the opinion that rather than a top-down order to build moai involving specific carvers and transportation laborers (as some narratives say), these groups of people would carve, move the moai, and build the
ahu themselves in addition to maintaining their other sustenance related activities.24 If
this were indeed the case, such action and involvement in the endeavor would help to show who was involved, invested, and a part of that particular family group. Erecting a
moai would make it clear who was to partake in the “clan’s” resources as opposed to outsiders and freeloaders.
In regards to what the moai and ahu could be signaling, with Rapa Nui’s small size it makes sense that they could have been signaling the possession of some resource. Since lithic mulching was used as a farming method, food resources were spread out across the whole island.25 Thus, as a resource, land and food were not the limiting factor. Rather, it would make sense to place these statues near a scarcer resource, a resource such as water.
Given the volcanic geology of the island, there is little to no standing water on Rapa Nui. This is a problem. There are basins carved into the rock called taheta26to help hold rainwater, but this is not enough. For a society to survive, a more reliable source of water is needed. There is evidence, both historical and archeological that the
23 Tilburg. Among Stone Giants. 2003 24 Talk with Carl Lipo January 2015
25 Ladefoged. “Soil Nutrient Analysis of Rapa Nui Gardening.” 2010 26 Tilburg. Among Stone Giants. 2003
20
wells were constructed by the ancient Rapanui. As Captain James Cook described in his journal during his 1777 visit to the island:
“[My men] could find no water except what the natives twice or thrice brought them, which, though brackish and stinking, was rendered acceptable, by the extremity of their thirst…Towards the eastern end of the island, they met with a well whose water was perfectly fresh, being considerably above the level of the sea; but it was dirty, owing to the filthiness or cleanliness (call it which you will) of the natives, who never go to drink without washing themselves all over as soon as they have done; and if ever so many of them are together, the first leaps right into the middle of the hole, drinks, and washes himself without the least ceremony… What the natives brought them here was real salt water; but they observed that some of them drank pretty plentifully of it, so far will necessity and custom get the better of nature!... On the declivity of the mountain towards the west, they met with another well, but the water was a very strong mineral, had a thick green scum on the top, and stunk intolerably. Necessity, however, obliged some to drink of it; but it soon made them so sick, that they threw it up the same way that it went down.”27
It is expected that these are puna, wells where the ground has been cut away into the side of the slope in order to access the water table. It is obvious, however, given the brackish nature of the proffered water that many of these wells were near the coast where the sea water mixes with the water table.
It makes sense geologically that it would be easier to access freshwater near the coast because as the land comes down to meet the ocean, the water table is relatively closer to the surface. At the shoreline where they meet, fresh water discharges into the ocean but the volume depends on the tide. At high tide there is little discharge as the increasing tide creates a “hydraulic dam” blocking the fresh water, but as the tide ebbs the position of maximum discharge moves towards the ocean.28 The result is less salty
27 Cook and Furneaux. 1777
21
brackish water. Given the water shortage on the island, it makes sense that the Rapanui took advantage and made the most of this coastal freshwater resource. In his journal Captain Cook described one such well:
“The little [water] we took on board, could not be made use of, it being only salt water which had filtered through a stony beach into a stone well; this the natives had made for the purpose, a little to the southward of the sandy beach so often mentioned, and the water ebbed and flowed into it with the tide.”29
The Rapa Nui locals would have been well adapted to drinking brackish water as Cook observed and this geological phenomena can still be observed today when free roaming horses can be seen drinking ocean water at low tide. This does not happen everywhere though. For one, the water table discharges best through porous materials so while soil and sand allow for a lot of permeability, bedrock and clay are more impermeable and will generally restrict the water table. Thus, not all areas of a coastline will have the same fresh water discharge. In addition, the cliffy coastline makes it certain areas less accessible than others.
Ocean access would have made available valuable resources for the ancient Rapanui, not only water but also whatever food resources they could glean from it through fishing and harvesting.30 It thus makes sense to mark and “protect” such
locations, to identify and keep them for yourself and your immediate clan. Based off of diatoms in skeletons, there is evidence of regional geographic variability in the water sources of the ancient Rapanui that could be explained by a differing reliance on water sources, with individuals from the north and west coasts of the island relying on more
29 Cook and Furneaux. 1777
22
temporary rainwater drinking sources while south coast individuals had more diversified sources.31 My paper examines the relationship between ahu and coastal access in an attempt to shed further light on this relationship and support the idea of coastal water table discharge as an important resource for those Rapanui living on the south coast of the island.
Topography
If ahu are to be considered costly signals related to fresh water access within the ancient Rapanui culture, topography could play an important factor as to why these structures were placed in certain locations. There are a couple reasons for this. One, as partially explained in the prior section on costly signaling and water, has to do with access to the water table. If a structure is placed at a lower elevation it is placed close to the water table. Additionally, a steep decline would not only bring people closer to the water-table, but these downhill areas, specifically if there is an abrupt drop in elevation, would remain slightly damper. This is because as water percolates through the ground, gravity still acts upon it, pulling it in a downhill direction in addition to simply down into the ground. If the land falls sharply, it is possible for this percolating water to emerge in these locations, perhaps not in large quantities, but more so than in areas where the land is flat or uphill.
Ahu location and distance to resources could also result in a spatial relationship. It is generally expected that features related to one-another would be located closer
31 Dudgeon and Tromp. “Diet, Geography and Drinking Water in Polynesia: Microfossil Research from Archaeological Human Dental Calculus, Rapa Nui (Easter Island).” 2012
23
together rather than being placed far apart. This is especially true when the resource being marked is an environmental one, such as land, food, or water. Thus, if ahu were markers of some locational based resource they should be placed near that resource.
Topography can relate to a number of other factors relevant to ahu placement as well, particularly slope and visibility.
Effect of Slope on Walking
Creatures use energy every day, to breath, to grow, to move; life requires
energy. The more energy a creature uses, the more energy it needs to put in. Thus, to be efficient, many creatures will avoid doing unnecessary work. As animals move through a landscape they lose energy but how much they lose depends upon the terrain; the more incline, the more energy spent in trying to ascend.32 This is illustrated by Naismith’s Rule, a rule of thumb proposed in the 1800s as a way to calculate
walking/hiking times. In its initial form it suggested to allow 20 minutes for every mile and 30 minutes for every 1000 feet of rise. Overtime, it has been modified and
expanded to take into account various terrain and slope gradation since steeper, rougher trails are harder, requiring more time and energy to ascend than the work needed for walking along flat ground.33
Observed animal behavior in the wild supports the idea that slope dictates movement, especially for larger animals. This makes sense since, while it may take the same amount of energy to lift 1kg of body weight for all animals, a larger body means more energy expenditure. Thus, the fight against gravity is much more taxing on
32 Hausken. 2014 33 Norman. 2004
24
animals of larger size. This is why the smaller mouse can more easily run uphill and at greater inclines than the larger chimpanzee.34 This behavior is also seen in elephants who avoid steep slopes since their large body sizes make going up even minor hills a large energy cost.35 Cattle too seem to generally prefer grazing on land with less slope, and only venture to hiller locals when food is scarce.36 With humans, in order to
compensate for steepness, we ascend in a zigzagging manner as a way to reduce
steepness (even though it increases distance). This phenomena is made permanent in the switchbacks of roads and trails.37 We, like many animals of decent size, rarely scale straight up a slope; rather we traverse it.
Given this understanding, if people were regularly accessing the coastline, it would be advantageous to position one’s self so as to avoid steep coastal terrain that would require excessive work. When access is desired, a lesser slope is preferred because it would make the work less strenuous and more efficient. Thus, it would make sense for ahu structures related to coastal/resource access to be situated near areas where there is a gentler coastal slope. Even without taking into account possible fresh water resources at the tideline, the ocean also had a number of other resources that the ancient Rapanui utilized like fish and other forms of sustenance. Since ahu, particularly image ahu, seem to be tied to community gathering areas it seems reasonable that they would be placed in areas where that limited the amount of work required; rather than
34 Taylor, et. al. "Running Up and Down Hills: Some Consequences of Size.". 1972 35 Wall, et. al. "Elephants Avoid Costly Mountaineering." 2006
36 Harris, et. Al. “The Effect of Topography, Vegetation, and Weather on Cattle Distribution at the San Joaquin Experimental Range, California.” 2002
37 Llobera and Sluckin. "Zigzagging: Theoretical Insights on Climbing Strategies." 2007; Gilks and Hague. "Mountain Trail Formation and The Active Walker Model." 2009
25
locate their communities near areas where steep cliffs would impede access to the ocean’s resources and require more energy expenditure, areas with less steep coastal slopes seem more ideal. There were no beasts of burden on the island prehistorically, so the Rapanui walked everywhere; it makes sense that they would be efficient about it.
Visibility in Archeology
Visibility and elevation go hand in hand. Everyone knows that generally, the higher you are, the further you can see. Usually, for an observer standing on the ground, the true horizon (the horizon resulting due to the curvature of the earth) is about three miles in the distance, but as they ascend in elevation, that distance increases. In reality, though, an observer cannot always see to the horizon, if features are in the way, be it a building, a mountain, or something else, an observer’s visibility is blocked as sight beyond the object is restricted. Conversely, if there are features of greater elevation far away their tops can be seen by an observer if they rise above the horizon line even if their bases below the horizon are not visible. This is why visibility is closely tied to topography, not only does the elevation of the observer matter, but the elevation of the landscape around them as well. Standing on a lone hill surrounded by plane has a different visibility result than standing on a hill surrounded by mountains.
Viewsheds are a way of analyzing how much area is visible from a single location. This term to describe calculating areas of visibility was first introduced by Tandy in 1967 who compared the idea to that of a watershed.38 The concept grew in
popularity when a computer program was developed that could quantifying visible areas
26
across a plane in 1968.39 The modern versions of this program are now used in a wide variety of fields from architecture to the military.
In archeology, visibility and intervisibility (seeing between features) have long been considered important factors in the initial construction of archeological
landscapes, especially in regards to settlements. While there are many elements that factor into the location of settlements, visibility is often analyzed as a means of
assessing defensiveness. Before the advent of computers, this was hard to quantify and generally noted qualitatively though words such as ‘hidden’ and ‘prominent’ but with GIS, quantitative analysis allows for a more thorough study of this phenomena.40 In their 1996 paper, Lock and Harris examined settlements in prehistoric southern England and used the amount of visible land from each location as a measure of defensibility, with the assumption that the greater the visible area from a settlement location, the easier it would be to defend.41 Jones also used visibility as a way to examine the placement of Onondaga Iroquois settlements and found that while settlements were not placed for a maximum field-of-view, they were generally within line-of-sight from one another making communication and mutual defense easier.42
Though a large focus has been on settlements, there have also been a number of viewshed analyses of other archeological features. One very extensive study was conducted by Fraser on the Neolithic stone cairns of Orkney where visibility was
39 Amidon et. Al. “Delineating landscape view areas...a computer approach.” 1969 40 Wheatly and Gillings. “Spatial Technology and Archeology.” 2002
41 Lock, Gary R., and Trevor M. Harris “Danebury Revisited: An English Iron Age Hillfort in a Digital Landscape.” 1996 42 Jones. “Using Viewshed Analysis to Explore Settlement Choice: A Case Study of the Onondaga Iroquois.” 2006
27
studied as a significant factor for the position of the territory delineating cairns.43 Another study by Paliou used a visibility analysis to show how Bronze Age Aegean wall paintings would appear to the public outside looking in through windows as a way to show status.44 All these studies show how the informative light visibility sheds on the relationship between features and their surrounding topography allows for a better archeological understanding of civilizations.
This idea is especially important if these ancient structures are meant to be a form of costly signaling. Costly signals are a way of communicating, they are meant to be seen, which means that visibility should have been an important factor considered by those constructing the ahu, particularly the image ahu.
43 Fraser. Land and Society in Neolithic Orkney. 1983
28
Part 3: Field Work and Data Analysis Methods
Data Collection
For the first two and a half weeks in January of 2015, I traveled to Rapa Nui with Drs. Lipo and Lee from California State University Long Beach (CSULB) in order to help them collect data on the island. Their main goal for the trip was to collect visual imagery for the south coast of the island using drones and I assisted them in this
endeavor. We flew a Trimble UX5 Aerial Imaging Rover to collect our data (fig. 8) that was generally able to capture areas of about 1km2 per flight. Over the course of a week
and a half we flew about 26 flights, capturing the whole of the southern coast as well as some more inland areas (fig. 9).
Inside the body of the drone was a camera that took pictures at regular intervals during the plane’s flight path; Dr. Lee would adjust the settings to account for the sun brightness of each individual flight. The unmanned aircraft was controlled via a touch-screen Yuma tablet computer onto which a map of the current location was loaded beforehand. With this map and our location locked on thanks to satellites, I would then indicate the wind direction (important for take-off, flight planning, and landing), decide the coverage location and area for the flight, and confirm and adjust the take-off and landing approaches for the drone by establishing boxes, points, and vectors in relation to map seen on the handheld computer screen. Before launch, we would go through a pre-flight checklist to ensure readiness and that everything was set (fig. 10). To launch, the UAV was placed upon a slingshot-like launch rail and at takeoff, a loaded bungee would fling the plane into the air. This speed and increase in altitude would start the
29
motor and the plane would begin to fly along its directed path. If the flight area was far away, Dr. Lipo and I would follow the drone in a car with the Yuma computer to ensure a signal between the devices was maintained. When the drone reached the area
designated for imaging, it would begin to travel along designated flight paths that transected the square area. In general we would try to have the flight lines perpendicular to the wind so as to reduce velocity change as the plane traversed across the set
coverage area taking pictures. When the plane reached the end of each flight line, it would continue for a little bit not taking photos before banking into a turn and coming back to align itself for its next flight path. When it was done flying all the flight paths for the assigned area, the drone would return to a set rally point near its landing location, circle to lose altitude and await confirmation to land. We would position ourselves to observe the area and descent approach before I gave the OK to land and watch then watch for any danger that would have me abort the landing (horses, cars, a bad angle, etc.).
There was a variable range as to the exact landing spot due to satellite
inaccuracy and the wind could also seriously affect the landing location. Since the UX5 has no wheels and instead lands on its belly, its last few moment of flight are glide with one sharp reverse from the propeller. This means that a large, clear, rock-free area is needed for landing and given the rocky nature of Rapa Nui that is an uncommon thing, but we were able to find three decent locations for landings from which we launched most of our flights to cover the south coast. We had brought along extra bodies for the drone in case of accidents and had several very close calls with rocks but only ended up crashing once on a landing bad enough to warrant a body change.
30
Each flight produced several hundred overlapping photos along with data from the flight path, which, among other things, included GPS coordinates for each picture. After each flight we would download the pictures from the camera’s memory card onto a laptop as well as extract the flight log from the drone’s body onto the Yuma computer. This data we would then bring back to the house we were staying at for further saving and processing.
In general, we flew about two to three flights per day and towards the end when we were most efficient, we had a day where we flew four flights, and a day we flew five. Ideally we could have gotten more flights off but we were limited by only having 4 lithium batteries (1 needed per flight) and the fact that we were not allowed to fly from around 11am until 1pm because we weren’t allowed to fly when the airport was busy and that’s when the flight from Chile arrived and departed. It also took us a while to achieve the necessary local permission to start flying so despite arriving on January 2nd, we didn’t start drone flights until January 9th. Despite that, we were still able to get imagery for the whole south coast as well as some other flights people requested.
The data from each flight was taken and processed using the laptops set up back at the house we were renting. First, the pictures from the camera had to be matched with their flightlog metadata that was recorded by the drone as the pictures were being taken. Then, we input the photos into a structure from motion program called Agisoft
PhotoScan which would analyze the images and composites them together. The result of this process is an Orthophoto with approximately 3cm resolution, a Digital Elevation Model (DEM), and a three-dimensional point-cloud model of the area.
31 Figure 8. The UX5 Drone
Photo taken by author
Figure 9. UX5 Flight Areas
Each green square represents the area flown for one flight. While the flight area was a rectangle, the resulting orthophotos have jagged edges resulting from the corners and edges of the actual camera pictures taken and that the drone often flew at an angle to account for the crosswind. Generally these flights covered about 1km but the two flown at a higher altitude (225m) covered more.
32
Figure 10. Final Checks of the Drone before a Launch Photo taken by Dr. Lipo
Structure from Motion and Topography
Structure from motion (SfM) is a form of photogrammetry, the science of getting ground measurements by measuring angles and lengths in photographs.45 While the concept of photogrammetry is about as old as the technology of photography itself, a more modern subset of the field is structure from motion. SfM, like traditional photogrammetry, uses location triangulation between matching features to create the geometry of the scene and estimate three-dimensional features from two-dimensional images. To do this, SfM needs three or more overlapping images of an area or object taken from slightly different angles, unlike traditional photogrammetry’s two. Those
33
points that are similar align and match up, their slightly different angles and the images are then composited together. This allows for the creation of perceived depth and three-dimensional effects just like how human, and many animal, eyes work (Fig. 11). With SfM, however, feature recognition algorithms incorporated into the programs allow for larger camera angle and photograph scale changes than the traditional methods and the processing power of the computer means than many images can be used to achieve more accurate results.46 The end result of this is a composite three-dimensional model. The shape arise from the angle and points that allow a structure to be made and the texture and color detail come from the combined photo imagery which is “draped” over the shape.
Figure 11: Structure from Motion Diagram
How structure from motion uses various different camera angles to recreate 3D features. Source: https://www.jvrb.org/past-issues/8.2011/2822
34 Topography
While SfM can be used to create 3D images of objects or buildings, if a large number of images are taken from above looking straight down at the ground, it can also be used to make 3D models of the landscape topography. For creating a topographic model, the more points of data there are, the more accurate the resulting image. If done by hand, acquiring topographic data requires a large number of man-hours to conduct in-the-field surveys and does not result in a very dense data set of points. With SfM software, however, the matching and creation of points between photos can be done more quickly and with a much greater density than before.
This is not to say that collecting data by hand is the only way to amass
topographic data. One other way is the use of Light Detection and Ranging (LiDAR). LiDAR works via active remote sensing. With LiDAR, a laser beam is sent down to the earth’s surface from a platform (usually a plane for high resolution data) and the
reflected light is analyzed upon its return; the varying elevations create different return times which can be used to determine elevation given the known location GPS location of the platform. A DEM can then be derived from the data via triangulation.47
LiDAR and SfM both have their pros and cons in when it comes to mapping topographic data. One advantage of LiDAR is that it can collect topographic data of the ground even if there is tree or other vegetation cover in an area. This is because the laser beam can have different returns (ie. One for the tree canopy, one for a smaller plant in the understory, and one for the ground) each of which is analyzed. Unlike LiDAR, SfM
35
uses just a simple camera and passive remote sensing (ie. the sunlight that is bouncing off the earth’s surface) to collect data. Thus, it is only useful in collecting topographic data if there is minimal to no vegetation. Luckily this is the case on Rapa Nui.
Given that a plane is required to fly the LiDAR equipment, data can be collected for large areas, this can also be a good thing, but in some instances it can be a
disadvantage. For one, a pilot and plane are needed which are expensive, especially when only a small area is needed to be surveyed. While we used a fixed wing drone to collect our SfM imagery data, it required little skill to use and if we did not have that option, we could have used a balloon to elevate the camera.48 Additionally, because SfM data collection generally takes place closer to the ground, it generally has a better resolution than LiDAR data. Studies have shown that SfM data results in a higher cloud density of data points and is generally quite accurate (when there is little to no
vegetation) and that it results in a higher cloud density of data points than conventional airborne LiDAR.49
Another advantage to SfM is that of the orthophoto. Since SfM uses regular photographs to get its elevation data, it has visible-light imagery for the area as well. During processing, the images are matched and meshed together so that all the images are incorporated into one, large area image that has been geometrically rectified, an orthophoto. The result if that features can be visually looked at and analyzed whereas with LiDAR datasets, there is only the density data with which to base ones
48 Johnsonet. al. 2014
36
understanding of the area. This easy visual visual accompaniment to the topographic data is a big advantage when trying to determine features on a landscape.
When collecting areal imagery for topographic analysis using SfM, there are a few key concepts that factor into the collection method and process. The major one is that it all depends on the quality of photos being used. While the computer does most of the processing work and can create 3D models rich in information and detail as outputs, it is still the job of the individual to acquire the photos needed for the
reconstruction. Given the essential nature of having overlap between the images it is important to be methodical when taking pictures of the subject. Just as important, however, is to ensure that the subject and its varying aspects are captured from different angles. The easiest way to ensure this is to move while taking photos of the feature, hence the name structure from motion.
With the drone, we were able to get regular pictures of the ground with
systematic overlap and height (fig. 12) and as it moved across the landscape, it captured the ground features at different angles. This made it easier to get quality reconstructions of the landscapes.
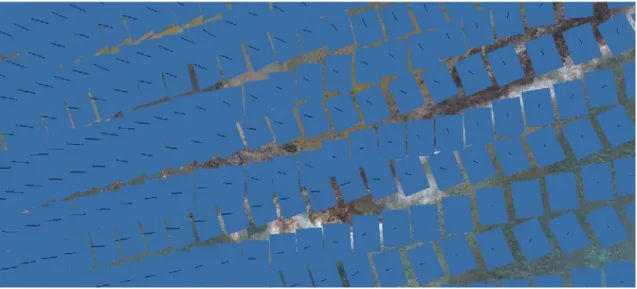
37 Figure 12: Camera Angles and Overlap in Photoscan
An image showing the camera location (black line and blue rectangle) for each photo taken and used in the reconstruction with the created ground topography beneath
Ground Calibration
An important aspect of SfM is the ground calibration. This is what gives the orthophotos, DEMs, and other outputs location in the real world. Just as the object of study was located in the world, so must the SfM outputs be able to align with that location. The outputs must be able to exist in a correct relationship to those areas around it as well as to the other points within the model. One way to ensure this is to collect GPS data at certain identifiable site. These locations or Ground Control Points (GCPs) can then be marked in the model and, by having certain points with known locations, the model becomes, in a sense, anchored. Thus, the more known points, the more precise and accurate the model. In more technical terms, GCPs register a model to a coordinate system.
38
While having specific GPS points is one way to register a model, there are also others. One, is that if you have the GPS locations for where the individual pictures were taken, they can be used to help provide a location for the whole emerged image.
Another way to ensure a correct data output is, if a DEM of the location at a different resolution exists, the same area of the two can be compared and used to correct each other. These various methods are not mutually exclusive and can be used in conjunction with one another in order to ensure the greatest accuracy for the data.
For this project, we did not collect GCP data, rather, we used the GPS data associated with the various camera positions to provide locations for the images. As the drone was flying, it oriented itself based on its triangulation from several satellites. Since the drone knew its position, every time it took a picture, the drone’s position at that time was recorded. This data could then be used to help Photoscan align the photos as well as provide locational grounding for the output model, Orthophoto, and DEM. Unfortunately, this consumer-grade GPS on the UAV has error associated with it that can translate into registration error for the model. This is discussed in further detail in the sub-section “Errors” (page 45).
Processing
While there are a few free, open source SfM software options available, we used program Agisoft Photoscan to process the data and goes through the several steps to create the final products. There are several advantages to using Photoscan, the first being that the software can incorporate GPS camera positions into its calculations. This helps to reduce processing time as well as georeference the final files without relying on ground control points. Another perk to the Photoscan software is that it allows for batch
39
processing. This means that all of the processing steps can be set up before-hand and left to run rather than having to manually initiate each step. With an average of 853 pictures taken per flight area (table 1), it could easily take 12 hours or more to process one flight, so the batch processing was key.
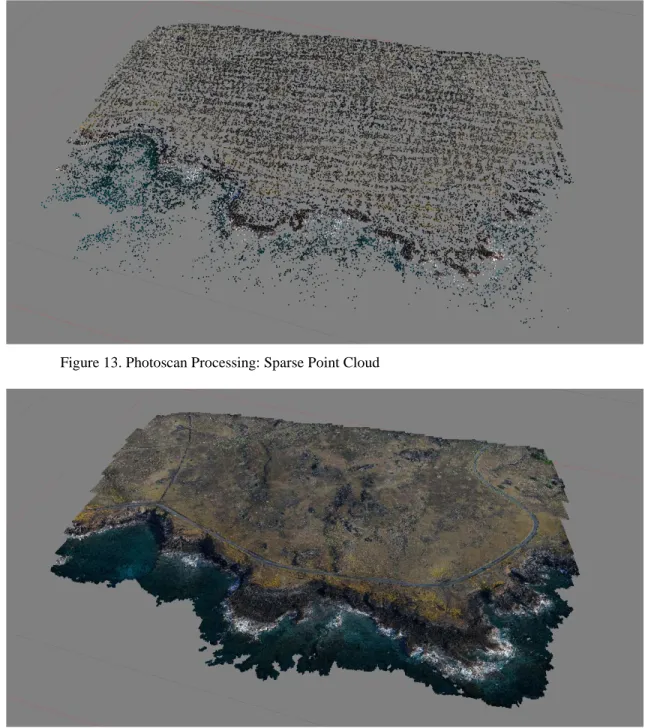
To process a new flight’s worth of photos, first, the photos from the camera were matched up with their associated metadata (ie. GPS data) that was collected by the drone as it flew and extracted onto the handheld Yuma computer at the end of each flight. Once back at a computer, Agisoft Photoscan is opened and the photos are imported into a new project. A batch process is then set up to process the photos in the following order. First, the photos are then aligned with each other and since they have associated GIS data, this can be used to help speed up the alignment process. Next the geometry is constructed; first a sparse point cloud (fig. 13), and then a dense point cloud (fig. 14) that illustrates the points of overlap. It is during the construction of the point cloud that the various qualities (from low to very high) can be selected for the final product. This affects both processing time and the output because while a lower quality takes less time to construct, the end result is not as accurate as one constructed at a higher quality. While we were in the field we processed the data at a medium setting and the results were fairly good. Once we got back in the US however, Drs. Lipo and Lee used their resources at CSULB to reprocess the images at a high resolution. To do this processing myself would have been lengthy and redundant so I used the outputs of these re-runs as my data.
After creating the dense point cloud, the next step is for Photoscan to create a wire frame (fig. 15) and then a solid surface (fig. 16) using these points. This helps to
40
create a dynamic, continuous, 3D surface and fill in any gaps that may occur in the data. Shading and texture (more imagery coloration) are then overlaid on top of the solid surface (fig. 17 and 18). The result of these steps is the final 3D model. During the model construction process, the images are processed in a way that creates a composite image of the photos as well as a topographic landscape this means that an orthophoto (fig. 19) and DEM (fig. 20) for the area can easily be exported and saved as their own files. This process was repeated for the data from all 26 flights.
One of the trade-offs that must be considered when preforming SfM is resolution and time. The closer to the ground an image is taken, the higher the
resolution will be but conversely, the picture will be smaller and much more time must be taken to get imagery of the whole desired area. The opposite is also true, pictures that are taken farther away from the earth’s surface cover more area and less of them are needed but the resolution is not as good.50 For our flights we flew at a 100 meters off the ground and the resulting resolution was about 3cm2.
41 Figure 13. Photoscan Processing: Sparse Point Cloud
42 Figure 15. Photoscan Processing: Wireframe
43 Figure 17. Photoscan Processing: Shaded
44 Figure 19. Photoscan Processing: Orthophoto Output
Figure 20. Photoscan Processing: DEM Output
In this DEM the lighter color corresponds to higher elevation. If desired, this coloring can be changed.
45 Errors
While SfM is a highly useful tool to process data, the process is not without its share of room for possible errors. The major possibility for error in the output features is tied to the errors in the drone’s GPS location. This arises because GPS, especially consumer-grade GPS, has a margin of error; it’s only accurate up to a certain point. This margin of error is due to the way the system works. GPS devices receive signals from different satellites and use the transmitted information to carry out trilateration
calculations in order to pinpoint their location on earth. The error results from a the fact that most GPS devices are only accurate to ten nanoseconds which is important since knowing when and where a satellite transmitted its data from is important critical to the calculation. Additionally, the transmitting microwave signals travel at the speed of light and this in conjunction with the limited timing accuracy equates to about a three meter error (in x, y, and z directions) for all GPS locations.51
As we collected our data over a number of different days, different satellites in different positions were used for trilateration and locating purposes. While the resulting position trilateration is still accurate for GPS, it may be slightly different than
information provided by the satellites being used a day prior. Another possibility for error is due to the atmosphere. As the microwave signals are transmitted between the satellites and earth, molecules and particulates in the atmosphere distort the signals being sent. Though mathematical equations can correct most of this error, certain varying locational atmospheric disturbances cannot be accounted for.
46
As errors in GPS location can affect the data, the result can come in the form of the output topographic data being shifted or tilted, it can also include bending, shrinking, stretching.52 This data warping can also result from the picture itself. When a 2D image is taken of a 3D, curving landscape, distortion occurs. If an aerial picture is taken looking vertically straight down at the ground, some distortion occurs, especially around the edges whose light has the farthest distance to travel to be captured by the camera. Most of this error can be corrected for by algorithms and is in fact the
definition of an orthophoto, a photograph that has been geometrically corrected so that it can be used like a map. Since the images used for this project were taken relatively close to the ground compared to using satellite imagery or photos taken from a maned plane, this should help to limit the distortion. Additionally, combining all the photos together with Photoscan should help to decrease error as there are a number of visual references for every location; the randomness of the error associated with each individual photo should help to counteract the random error in other photos when meshed together so the final composite datasets have less than 3m of error in all directions.
Recently, studies have found that a doming effect occurs in the final resulting composite images of topographic SfM DEMs. In essence, this means that the middle of the DEM bulges up slightly. This is thought to be a result of combining near-parallel imaging directions in tandem with radial lens distortion. Thjs error can be