Indexed in Clarivate Analytics WoS, and ScienceOPEN
A
cE-Bs2019LangkawiIsland
https://www.amerabra.org; https://fspu.uitm.edu.my/cebs; https://www.emasemasresources.com
8th Asian Conference on Environment-Behaviour Studies, Holiday Villa Resorts & Spa, Langkawi Island, Malaysia, 18-19 Dec 2019
eISSN: 2398-4287 © 2019. The Authors. Published for AMER ABRA cE-Bs by e-International Publishing House, Ltd., UK. This is an open access article under the CC BYNC-ND license (http://creativecommons.org/licenses/by-nc-nd/4.0/). Peer–review under responsibility of AMER (Association of Malaysian Environment-Behaviour Researchers), ABRA (Association of Behavioural Researchers on Asians) and cE-Bs (Centre for Environment-Behaviour Studies), Faculty of Architecture, Planning & Surveying, Universiti Teknologi MARA, Malaysia.
Validation of Vis-Screen Mobile Application for Easy Vision Test
by General Public: A pilot study
Siti Nor Aishah Abdul Rahman, Abdul Mutalib, Atif Amin Baig, Syed Hatim Noor
Faculty of Medicine,
Universiti Sultan Zainal Abidin (UniSZA), Jalan Sultan Mahmud, 20400 Kuala Terengganu, Terengganu
[email protected], [email protected], [email protected], [email protected] Tel: 0148425024
Abstract
Visual impairment and blindness is a serious global concern. Poor awareness and late detection are significant factors contributing to the vast number of visually impaired people worldwide. The ubiquitous use of smartphone devices enables the general public to access various services provided easily. Our Vis-Screen mobile application is developed based on the necessity for early detection of any vision problem to avoid further vision loss. Simple built-in algorithm and user-friendly features of this application suits any laypersons to do vision testing among themselves with only minimal training needed, therefore promoting the importance of healthy vision within the community.
Keywords: visual acuity; mobile application; vision screening; blindness
eISSN: 2398-4287 © 2019. The Authors. Published for AMER ABRA cE-Bs by e-International Publishing House, Ltd., UK. This is an open access article under the CC BYNC-ND license (http://creativecommons.org/licenses/by-nc-nd/4.0/). Peer–review under responsibility of AMER (Association of Malaysian Environment-Behaviour Researchers), ABRA (Association of Behavioural Researchers on Asians) and cE-Bs (Centre for Environment-Behaviour Studies), Faculty of Architecture, Planning & Surveying, Universiti Teknologi MARA, Malaysia.
DOI: https://doi.org/10.21834/e-bpj.v4i12.1893
1.0 Introduction
1.1. Visual impairment and blindness
Vision is a vital sensory system and plays a significant role in the best performance of each individual. Any vision problem or impairment encountered within this system can lead to multiple consequences, restrictions and other limitations towards daily activities. Over many decades, blindness and visual impairment remain a global issue with myriads of strategies and measures implemented by many parties to reduce its prevalence and impacts in the community. In 2015, more than 200 million people worldwide had visual impairment and 36 million blind (Ackland, Resnikoff, & Bourne, 2018). Even though visual impairment may occur at any age, the prevalence of visual impairment was three times higher in older adults compared with the younger persons (Wolfram et al., 2019).
The global population was estimated to grow up to 9.7 billion in 2050, with one-fifth of them are 60 years and above. The combination of both the growing community and increment of elders will increase the number of individuals with visual impairment and blindness globally (Bourne et al., 2017). Apart from being in the older age group, socioeconomic status is another risk factor contributing to the increment in global blindness. The socioeconomic indicator includes the income status and education level. Indeed, people with lower socioeconomic status contributed to the higher rate of blindness (Dandona & Dandona, 2001). In the rural areas of China, the lower-income economic group is more likely to insufficiently utilize the eye care services despite the availability of services provided (Yan, Chen, & Yan, 2019).
Individuals with lower educational level are also more vulnerable to be visually impaired compared to those with higher education level. People living in the low and middle-income countries have contributed about 89% of the cases with visual impairment worldwide, among them 24 million were from the South East Asia region (Ackland et al., 2018). Therefore, visual impairment and blindness is a
significant concern which needs immediate actions and cooperation from all parties to reduce the impact towards the individuals, society and perhaps the country itself.
Nomenclature App Application
PVR Presenting vision of the right eye CVR Corrected vision of the right eye PVL Presenting vision of the left eye CVL Corrected vision of the left eye WHO World Health Organization
1.2 Purpose of the study
Despite the availability of eye care services provided by the government and other organizations, the number of visually impaired people within Malaysia itself is still alarming. From the whole population of Malaysia aged 50 and above, an average of 1.2% of them is blind, with the highest prevalence of 1.9% identified in Sabah (Salowi, 2016). Late detection of their vision problem is one of the significant factors contributing to the growing numbers of people with visual impairment and blindness each year. Recently we have developed a simple mobile application named Vis-Screen to perform vision testing by the general public among themselves. This study is part of the pilot study to determine the validity and reliability of Vis-Screen mobile application as a tool for screening vision among the general public.
1.3 Objective of the study
Validation of the Vis-Screen mobile app involved determining its diagnostic capability in terms of its sensitivity and specificity, as well as its positive and negative predictive values. We utilized the recently advocated Krippendorff's alpha statistical analysis to determine the inter-rater reliability among three different app users.
2.0
Literature review
2.1 Causes of visual impairment and blindness
Cataract and uncorrected refractive errors are the most prominent causes of visual impairment and blindness globally. Several other causes include age-related macular degeneration, diabetic retinopathy and glaucoma (Flaxman et al., 2017). In South-East Asia, 78.5 million people were visually impaired, with 12 million were blind. Untreated cataract alone contributed about 58.6% of the total blindness cases identified in Malaysia (Chew et al., 2018). Despite the widespread availability of eye care services, the number of patients with cataract remains significantly high. The absence of pain, which lead to the delayed awareness of their visual status and late presentation for timely ophthalmological referral, are some of the factors identified as the significant contributors to this alarming figure (Chua et al., 2017; Mutalib, Zin, Shahir, & Hassan, 2018).
Worldwide, about 80% of the causes of visual impairment and blindness are avoidable, treatable and preventable with glasses, simple surgical procedure, or other means of treatment. In 2013, the 66th World Health Assembly in Geneva unanimously approved the action plan to reduce the global avoidable visual impairment and blindness by 25% in 2019. Thus, it demands the cooperation from many parties and agencies to aim for the elimination of avoidable blindness. As visual impairment and blindness can affect one’s quality of life, it is essential to take immediate and effective measures to restore normal vision and avoid further vision loss.
2.2 Visual acuity testing
Visual acuity is the ability of our optical system to recognize and resolve fine details. It is essential for eye care practitioners to determine the visual acuity of every individual before performing the ocular examination to detect any refractive errors or diseases which could compromise one’s vision. There are numerous types of charts used to test the visual acuity itself. Many practitioners continue to utilize the Snellen chart as the method of choice despite some of its design flaws. It is mainly due to its familiarity and less time consuming when compared with the more recently developed Early Treatment Diabetic Retinopathy Study (ETDRS) chart (Kalpana, Karthick, & Jayarajini, 2013).
2.3 The importance of vision screening
Visual acuity measurement is one of the components listed as the routine examination in the primary eye care procedures. The combination of both, the correct identifications of vision problem and appropriate referral, can lead to the success in delivery of primary eye care itself. In the quest to promote healthy vision the community, many parties are involved in various vision screening programs all over the country to raise public awareness. Among the most recent Prevention of Blindness Program organized by the Ministry of Health Malaysia is the Amblyopia and Visual Impairment Screening (AVIS) program to promote early identification of pre-school children with vision problems in preventing amblyopia since 2017 in Malaysia (Salowi, Ismail, & Hussin, 2017). The high prevalence of refractive error among children below four years old in highly urbanized region can lead to permanent visual impairment due to the amblyopia. It addresses the necessities for early intervention through health education to increase public awareness, in order to reduce the prevalence of visual impairment in children (Knight, Khairi, Omar, Ramlee, & Isa, 2018). More educational programs, national screenings and
improvement in the eye care service implementation are required to treat those diseases which are considered preventable by early diagnosis and treatment.
2.4 Mobile application in vision screening
Due to the rapidly evolving technology and myriads of invention in the recent decades, the mobile technology is now being incorporated with medical and health care for various purposes. With more than a billion users of smartphones worldwide, practitioners can make use of this technology in many ways which will assist them (Lakshminarayanan, Zelek, & McBride, 2015). The EyeSnellen app, introduced by an Australian ophthalmologist in 2012, pioneered the use of mobile application in vision testing. The Snellen visual acuity assessment obtained from this application is comparable to the traditional Snellen chart, thus introducing a portable type of Snellen chart by the use of tablets or smartphones to the practitioners (Gounder, Cole, Colley, & Hille, 2014).
The invention continued to produce more mobile application for visual acuity assessment such as the Peek Acuity (Bastawrous et al., 2015), Rapid Eye Screening Test (REST) and V@home. Among the available mobile apps, Peek Acuity is the only one currently recognized by the WHO to be used in vision screening. The use of this technology in the developing country like Kenya has been widely accepted by patients and health workers to enhance the accessibility and delivery of eye care (Lodhia, Karanja, Lees, & Bastawrous, 2016). Therefore, mobile apps are readily acknowledged as a part of the strategies to promote healthy vision by overcoming the barriers to eye care services.
3.0
Methodology
3.1 Study design
We undertook this cross-sectional study between April till August 2019, involving a total of 279 study participants. The locations for this pilot study were the Mooris Optometrist eye care centre and the Universiti Sultan Zainal Abidin Medical Centre (UMC) located in Kuala Terengganu. The study participants involved individuals aged four years old and above attending the eye care centres. The validation study involved testing the participants’ vision using the Vis-Screen mobile app and compared it with the visual acuity acquired by the Snellen chart as the gold standard.
3.2 The algorithm of the Vis-Screen
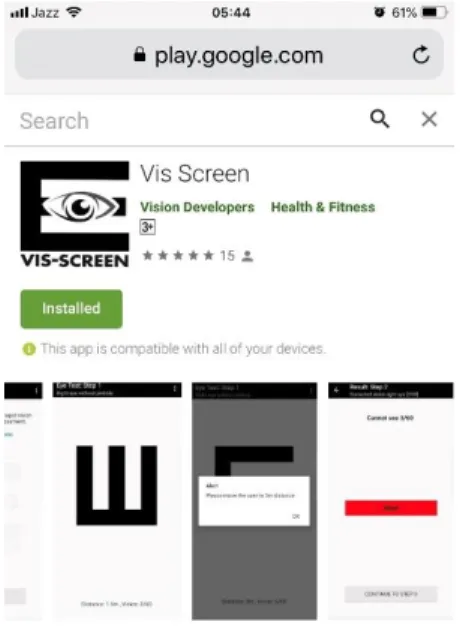
The Vis-Screen mobile app (Figure 1) is available for download from the Google Play Store for the Android users. It was developed based on several algorithms by utilizing a single letter ‘E’ as the optotype similarly used in the Tumbling ‘E’ for Snellen and ETDRS charts.
Figure 1: The Vis-Screen app
Hence, both literate and illiterate individuals can easily recognize it. Due to limitation in the screen size for some smaller smartphones, it displays only one letter at a time to comply the principle of Snellen chart visual acuity testing. The standard vision is the ability to view the optotype at a distance of 6 meters or 20 feet when subtended at an angle of 5 minutes of arc. Based on this principle, the sizes of
the Vis-Screen optotype is according to the 5x5 grid for the visual acuity level of 3/60, 6/60, 6/18 and 6/12, in order to categorize the level of vision according to the latest classification of visual impairment and blindness by the WHO. The letter ‘E’ is displayed randomly in four different orientations of 0o, 90o, 180o or 270o at a viewing distance of 1.5 and 3 meters to avoid any bias or memorization. The
study participants need to point out to the direction of the letter ‘E’ displayed while the examiner will swipe it accordingly until the test stops and finally auto-generate the results.
3.3 Validity and reliability of the Vis-Screen
We used the Snellen chart as the gold standard to compare with the vision level obtained using the app to determine its validity by the level of its sensitivity, specificity, positive predictive value and negative predictive values. The inter-rater agreement in the results obtained by five different app users was analyzed using Krippendorff's Alpha statistic to determine its reliability.
Table 1. Example of the results from the diagnostic test presented in the 2x2 table
Result of diagnostic test Results of Gold Standard test
Disease present Disease absent
Test positive True positive (a) False positive (b)
Test negative False negative (c) True negative (d)
𝑆𝑒𝑛𝑠𝑖𝑡𝑖𝑣𝑖𝑡𝑦 = [𝑎/(𝑎 + 𝑐)] 𝑥 100 𝑆𝑝𝑒𝑐𝑖𝑓𝑖𝑐𝑖𝑡𝑦 = [𝑑/(𝑏 + 𝑑)] 𝑥 100 𝑃𝑜𝑠𝑖𝑡𝑖𝑣𝑒 𝑝𝑟𝑒𝑑𝑖𝑐𝑡𝑖𝑣𝑒 𝑣𝑎𝑙𝑢𝑒 = [𝑎/(𝑎 + 𝑏)] 𝑥 100 𝑁𝑒𝑔𝑎𝑡𝑖𝑣𝑒 𝑝𝑟𝑒𝑑𝑖𝑐𝑡𝑖𝑣𝑒 𝑣𝑎𝑙𝑢𝑒 = [𝑑/(𝑐 + 𝑑)] 𝑥 100
4.0
Findings
4.1 Validity of the Vis-Screen
From the total of 161 participants, the mean age was 30.91 ± 15.87 years (min 8, max 79 years) with a more significant proportion of female participants (72%) obtained compared with the males (28%). For the diagnostic tests on the results obtained by the Vis-Screen app against the Snellen chart to detect PVR worse than 6/12, a total of 63 participants identified to be true positive, and 5 were false negative, giving the sensitivity of 92.7%. Whereas 85 identified to be true negative, and eight were false positive, giving the specificity of 91.4% (Table 2).
Table 2: Diagnostic results for the Vis-Screen app against the Snellen chart for PVR to detect vision worse than 6/12 (n=161)
PVR by Vis-Screen app PVR by Snellen chart
Visually impaired Normal
Visually impaired 63 8
Normal 5 85
In the diagnostic tests to detect CVR of worse than 6/12, we identified 2 participants to be true positive, and 1 was a false negative, giving the sensitivity of 66.7%. Whereas 144 were true negative and 14 were false positive, giving the specificity of 91.1% (Table 3).
Table 3: Diagnostic results for the Vis-Screen app against the Snellen chart for CVR to detect vision worse than 6/12 (n= 161) CVR by Vis-Screen app CVR by Snellen chart
Visually impaired Normal
Visually impaired 2 14
Normal 1 144
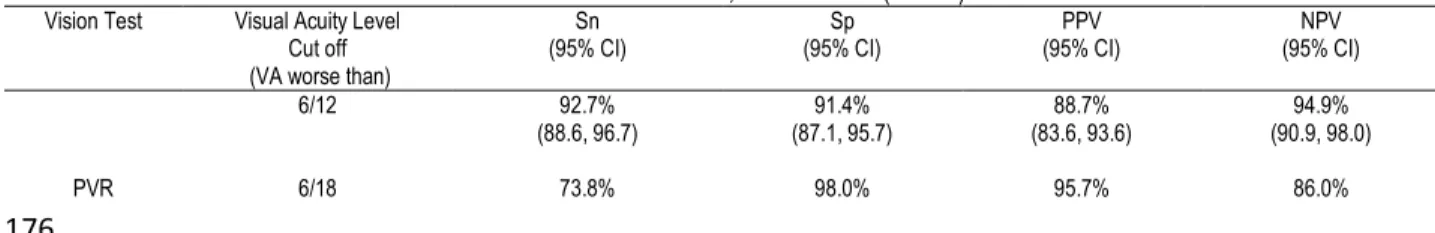
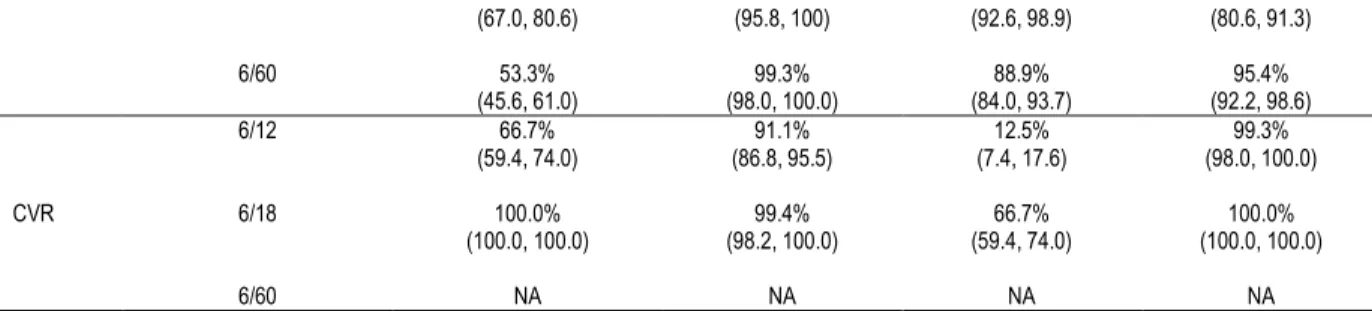
In summary, for the PVR, the sensitivity was 92.7%, 73.8% and 53.3%, and the specificity was 91.4%, 98.0% and 99.3% for detecting vision worse than 6/12, 6/18 and 6/60, respectively. For CVR, the sensitivity was 66.7% and 100%, while the specificity was 91.1% and 99.4% for detecting vision worse than 6/12 and 6/18, respectively. The positive predictive value (PPV) for PVR ranged from 88.7% to 95.7% with the negative predictive value (NPV) of 86% to 95.4%. The PPV value for CVR were 12.5% and 66.7% with NPV of 99.3% and 100% for the visual level of 6/12 and 6/18, respectively (Table 4).
Table 4: Summary of the diagnostic test results for Vis-Screen app against the gold standard Snellen chart for PVR and CVR for visual acuity level cut off worse than 6/12, 6/18 and 6/60 (n= 161)
Vision Test Visual Acuity Level Cut off (VA worse than)
Sn
(95% CI) (95% CI) Sp (95% CI) PPV (95% CI) NPV
PVR
6/12 92.7%
(88.6, 96.7) (87.1, 95.7) 91.4% (83.6, 93.6) 88.7% (90.9, 98.0) 94.9%
(67.0, 80.6) (95.8, 100) (92.6, 98.9) (80.6, 91.3) 6/60 53.3% (45.6, 61.0) (98.0, 100.0) 99.3% (84.0, 93.7) 88.9% (92.2, 98.6) 95.4% CVR 6/12 66.7% (59.4, 74.0) (86.8, 95.5) 91.1% (7.4, 17.6) 12.5% (98.0, 100.0) 99.3% 6/18 100.0% (100.0, 100.0) (98.2, 100.0) 99.4% (59.4, 74.0) 66.7% (100.0, 100.0) 100.0% 6/60 NA NA NA NA
Legend: PVR - Presenting Vision of the right eye, CVR - Corrected Vision of the right eye, Sn – Sensitivity, Sp – Specificity, PPV - Positive predictive value, NPV - Negative predictive value, CI - Confidence interval, NA – Not applicable
4.2 Reliability of the Vis-Screen
The mean age for the total of 118 participants involved in the reliability study was 30.48 years old. Among the study participants, 58.5% were males, while the remaining 41.5% were females. The mean test duration was 60.62 seconds. The reliability revealed by K alpha value for both PVR and CVR was 0.87 and 0.89, respectively (Table 5).
Table 5: Interrater reliability analysis by using Krippendorff’s alpha for multiple users of Vis –Screen app (n= 118)
Parameter K alpha z p-value
PVR 0.87 40.0 ˂0.001
CVR 0.89 35.95 ˂0.001
5.0
Discussion
5.1 Validity of the Vis-Screen
The issue of visual impairment involving more than a million individuals persisted as the global concern; thus, regular vision screening activities aim at detecting early visual impairment is vital. The device used for vision screening will affect the sensitivity and specificity of the outcomes according to the chosen level of visual impairment to be detected (American Academy of Pediatrics Section on Ophthalmology and Committee on Practice and Ambulatory Medicine, 2012). In our study, the visual level cut off point chosen for normal visual acuity was 6/12 as defined by the WHO. The purpose of our app is to be easily used by the general public with minimal training; therefore, the expected level of sensitivity and specificity were moderate. The visual level cut off point of 6/12 was set up wisely by the WHO, for it is necessary to aim for a very high sensitivity level in any screening activities (Murthy, 2000).
In PVR, the visual acuity worse than 6/12 obtained the highest sensitivity of 92.7% compared with other visual levels. Sixty-three participants were correctly identified as visually impaired by the app and Snellen chart, as shown in Table 2. Both PVR (worse than 6/60) and CVR (worse than 6/18) obtained a moderate sensitivity level. On the other hand, both the PVR and CVR obtained relatively high specificity. The high specificity value achieved indicates that our app is highly accurate in detecting individuals with visual impairment.
The Peek acuity app also had similar sensitivity and specificity level as the Vis-Screen. In the earlier study in 2015, Peek acuity showed the sensitivity and specificity of 85% and 98% respectively for the visual cut off point of 6/60 (Bastawrous et al., 2015). However, in the latter study, lower values of 77% and 91% for sensitivity and specificity of Peek acuity were noted accordingly with a different visual level cut off point (Rono et al., 2018). The almost equal level of sensitivity and specificity obtained by our app compared to the Peek acuity suggest that our app is equally valid and suitable for a vision screening tool in the community. The short test duration of about 1 minute is likewise an additional advantage.
The purpose of applying the pinhole test in our study is to differentiate between refractive errors as the underlying reason for the visual impairment against the presence of opacity in the optical media or other ocular diseases. The low cost, simple and easily operated by non-technical individuals highlights the pinhole test as the method of choice to be widely used in any vision screening within the community (Marmamula, Keeffe, Narsaiah, Khanna, & Rao, 2014). Currently, there is no other mobile app which utilizes the pinhole test for vision screening within their algorithm beside ours. Moreover, we have used the best-corrected visual acuity (BCVA) with full refractive correction instead of the only pinhole test in CVR using the Snellen chart in the clinical setting. Hence, it explained for the less number of cases detected with visual impairment and a lower sensitivity level at 66.7% for the 6/12 visual acuity level cut off point.
Regarding the predictive values, the lower PPV in CVR compared with the relatively high NPV in both PVR and CVR, strongly suggest the lower prevalence of uncorrected visual impairments within our community (Akobeng, 2007). In this pilot study, the sample size was considered small, with only the minority of them had uncorrected visual impairment caused by other ocular conditions. Thus, a more appropriate sample size number will be applied accordingly in the subsequent full validation study. Nevertheless, the reasonably high NPV values obtained for PVR and CVR imply that our app has high enough accuracy to rule out individuals with uncorrected visual impairment.
5.2 Reliability of the Vis-Screen
The use of Krippendorff’s alpha statistical analysis in this study is due to the data for the visual level results were categorical and to compare among five different users (Artstein & Poesio, 2008). The inter-rater reliability for both PVR and CVR were high with K alpha
values of 0.87 and 0.89, respectively (p-value of ˂0.001). The high K alpha values indicate that our app has good agreement or consistency between multiple users; hence, it is reliable and comparable with other mobile apps such as REST and Peek acuity, implying significant agreement with the Snellen and ETDRS charts (Bastawrous et al., 2015).
5.3 Limitation of the study
The difficulty in standardizing screen brightness between different smartphones devices and the ambient lighting around the testing area was the significant limitations identified during this study. Due to the many different models of smartphones used among the examiners, the screen brightness was not able to be standardized accordingly. However, a bit of advice was given to the examiners to set the screen brightness at a maximum level of 100% before vision testing. Previous studies with the use of the mobile device in visual acuity testing advocate standardizing the screen brightness between 75 to 100% (Bastawrous et al., 2015; Gounder et al., 2014). However, the differences in visual acuity measurement found between mobile devices, and the conventionally retro-illuminated chart was not statistically significant (Gounder et al., 2014). Instruction to examinees also includes not to face or sit against a bright source of light to minimize the effect of glare. The Institution of British Standards recommends the lighting around the vision testing area to be between 80 to 300 lux to avoid unnecessary over-lighting (Bastawrous et al., 2015).
6.0
Conclusion & Recommendations
This study revealed Vis-Screen mobile application as a valid and reliable tool to be used for vision screening. With only minimal training needed, it will assist any layperson in doing their vision testing within the community. Regardless of any smartphones models, this app has been calibrated and standardized for its optotype size; therefore, it is compatible with most Android users. The vision test results are also easily understood. Thus, it will help in promoting early detection and awareness regarding the vision level hence emphasizing the importance of prevention of blindness and visual impairment among the general public. Due to the limited number of participants for this study, a subsequent full validation study is in need.
Acknowledgement
This research is a self-funded study from all the contributing authors without any external grant. We want to thank all the medical students of UniSZA who were involved in the data collection process.
References
Ackland, P., Resnikoff, S., & Bourne, R. (2018). World Blindness and Visual Impairment: Despite many successes, the problem is growing. Community Eye Health Journal, 30(100), 71-73.
Akobeng, A. K. (2007). Understanding Diagnostic Tests 1: Sensitivity, Specificity and Predictive Values. Acta Paediatrica, 96, 338-341.
American Academy of Pediatrics Section on Ophthalmology and Committee on Practice and Ambulatory Medicine. (2012). Instrument-Based Pediatric Vision Screening Policy Statement. American Academy of Pediatrics, 130(5).
Artstein, R., & Poesio, M. (2008). Inter-Coder Agreement for Computational Linguistics. Computational Linguistics, 34(4), 555-596.
Bastawrous, A., Rono, H. K., Livingstone, I. A. T. Weiss, H. A., Jordan, S., Kuper, H., & Burton, M. J. (2015). Development and Validation of a Smartphone-based Visual Acuity Test (Peek Acuity) for Clinical Practice and Community-based Fieldwork. JAMA Ophthalmology, 133(8), 930-937.
Bourne, R. R. A., Flaxman, S. R., Braithwaite, T., Cicinelli, M. V, Das, A., Jonas, J. B., … Vision Loss Expert Group. (2017). Magnitude, Temporal Trends, and Projections of the Global Prevalence of Blindness and Distance and Near Vision Impairment: A Systematic Review and Meta-analysis. The Lancet. Global Health, 5(9), e888-e897. Chew, F. L. M., Salowi, M. A., Mustari, Z., Husni, M. A., Hussein, E., Adnan, T. H., …Goh, P.-P. (2018). Estimates of Visual Impairment and Its Causes from The National Eye Survey in Malaysia (NESII). PloS One, 13(6), 11.
Chua, J., Lim, B., Fenwick, E. K., Gan, A. T. L., Tan, A. G., Lamoureux, E., … Cheng, C.-Y. (2017). Prevalence, Risk Factors, and Impact of Undiagnosed Visually Significant Cataract: The Singapore Epidemiology of Eye Diseases Study. PloS One, 1-15.
Dandona, R., & Dandona, L. (2001). Socioeconomic status and Blindness. British Journal of Ophthalmology, 85, 1484-1488.
Flaxman, S. R., Bourne, R. R. A., Resnikoff, S., Ackland, P., Braithwaite, T., Cicinelli, M. V, … Wong, T. Y. (2017). Global Causes of Blindness and Distance Vision Impairment 1990-2020: A Systematic Review and Meta-analysis. The Lancet Global Health,5, 1221-1234.
Gounder, P. A., Cole, E., Colley, S., & Hille, D. M. (2014). Validation of a Portable Electronic Visual Acuity System. Journal of Mobile Technology in Medicine, 3(2), 35-39.
Kalpana, S., Karthick, J., & Jayarajini, S. (2013). Comparison of Static Visual Acuity Between Snellen and Early Treatment Diabetic Retinopathy Study Charts. International Journal of Educational Research and Development, 2(3), 82-88.
Selangor, Malaysia. Malaysian Journal of Public Health Medicine, 1, 18-25.
Lakshminarayanan, V., Zelek, J., & McBride, A. (2015). “Smartphone Science” in Eye Care and Medicine. Optics and Photonics, 44-51.
Lodhia, V., Karanja, S., Lees, S., & Bastawrous, A. (2016). Acceptability, Usability and Views on Deployment of Peek, a Mobile Phone mHealth Intervention for Eye Care in Kenya: Qualitative Study. JMIR Mhealth and Uhealth,4(2), 1-16.
Marmamula, S., Keeffe, J. E., Narsaiah, S., Khanna, R. C., & Rao, G. N. (2014). Population-based Assessment of Sensitivity and Specificity of a Pinhole for Detection of Significant Refractive Errors in the Community. Clinical and Experimental Optometry, 97, 523-527.
Murthy, G. V. S. (2000). Vision Testing for Refractive Errors in Schools. Community Eye Health, 13(33), 3-5.
Mutalib, A., Zin, N. M., Shahir, A., & Hassan, A. (2018). A Cataract Surgery Barrier Model in Eastern Zone of Peninsular Malaysia. Environment-Behaviour Proceeding Journal, 3(9), 57-62.
Rono, H. K., Bastawrous, A., Macleod, D., Wanjala, E., Tanna, G. L. Di, Weiss, H. A., & Burton, M. J. (2018). Smartphone-based Screening for Visual Impairment in Kenyan School Children: A Cluster Randomised Controlled Trial. Lancet Glob Health, 6, 924-932.
Salowi, M. A. (2016, May). The Cataract Free Zone Project. Malaysian Society of Ophthalmology.
Salowi, M. A., Ismail, M., & Hussin, D. A. (2017, April). Cataract Surgery Outcome Audit-Message from the Editors. National Eye Database, pp. 1-4.
Wolfram, C., Schuster, A. K., Elfein, H. M. Nickels, S., Schulz, A., Wild, P. S., … Pfeiffer, N. (2019). The Prevalence of Visual Impairment in the Adult Population. Deutsches Arzteblatt International, 116, 289-295.