Abstract—A sample-free method for determination of the linear thermal expansion coefficient (LTEC) and the speckle-interferometer setup are developed. The method and setup were evaluated using samples from a material with known LTEC value. The method is applied to LTEC measurement for AM fabricated aluminum-matrix composite materials of the Al-Si-Ni system directly on the hot-pressed cylindrical briquettes. The measurement left the material suitable for further use. The method enables LTEC measurements in three mutually perpendicular directions to estimate LTEC anisotropy. Aluminum-matrix composite materials manufacturing techniques are discussed. Conclusions are drawn on influence of disperse nanocarbon additives on LTEC of the considered AM fabricated composites.
Index Terms—thermal expansion coefficient, measurement, non-standard sample, aluminum-matrix composite, electron speckle-interferometry
I. INTRODUCTION
DDITIVE Manufacturing (AM) technologies are an exciting area of the modern industry and have applications in instrumentation, engineering, medicine, electronics, aerospace industry, and other fields [1-3]. The present methods tor LTEC measurements, as a rule, imply use of the dilatometers with standard samples with diameter up to 20 mm and length up to 100 mm [4]. If the samples have other shapes and sizes one should adapt various approaches and techniques for these samples [5].
In present paper we report on sample-free method for determination of the linear thermal expansion coefficient
Manuscript received March 21, 2018; revised April 4, 2018. This work was supported by the Russian Science Foundation (RSF project No. 17-19-01257).
A. L. Popov is with the Ishlinsky Institute for Problems in Mechanics of the Russian Academy of Sciences and National Research University, Moscow State University of Civil Engineering, Moscow, Russia (corresponding author phone: +7-495-434-3565; fax: 7-495-739-9531; e-mail: [email protected]).
V. N. Mironenko (e-mail: [email protected]) and V. V. Vasenev (e-mail: [email protected]) are with the "Kompozit OAO", Korolev, Russia.
V. M. Kozintsev (e-mail: [email protected]), D. A. Chelyubeev (e-mail: [email protected]), E. V. Murashkin (e-mail: [email protected]), A. V. Chentsov (e-mail: [email protected]) are with the Ishlinsky Institute for Problems in Mechanics of the Russian Academy of Sciences, Moscow, Russia.
S. P. Chervonobrodov is with the LLC KOGRAN, Moscow, Russia (e-mail: [email protected]).
(LTEC), based on electronic speckle-interferometry method [6], [7]. The LTEC measurements for AM fabricated aluminum-matrix composite materials directly on the hot-pressed briquettes produced by various technologies are performed by using this technique. To reveal the possible anisotropy of LTEC, the measurements were taken in three mutually perpendicular directions on sets of briquettes.
It is difficult to make more than one standard sample out of a single briquette. Then, for one briquette, the LTEC is usually defined just for a single direction. After manufacturing of a standard sample of the briquette does not suit as a billet any more.
Using the LTEC measurement technique described below the initial briquettes remain almost intact, remaining suitable for further exploitation after measurements. The similar technique, but suitable only for standard samples, was discussed in [8].
II. LTEC MEASUREMENT METHOD
The speckle-interferometry measurement method consists of following steps: 1) preparation of the object: drilling of small blind holes for thermocouples and deposition of parallel slits perpendicular to the direction in which the LTEC is determined. 2) heating of the briquette up to the temperature exceeding the top temperature of the measuring interval by approximately 10%, 3) putting the heated briquette according to the chosen direction of LTEC measurement onto the supports, which are two parallel console plate-like sensitive elements, 4) registration of temperature variation for the briquette at its cooling and displacements of the sensitive elements edges contacting it, 5) calculation of the LTEC in the predetermined temperature interval.
Control of uniformity of initial heating up of the briquette was done by the two thermocouples, first of which was inserted into a hole in the middle of a face surface of the cylindrical briquette, and the second one in a hole in the middle of its side surface.
As the briquette cooled down, its shortening was controlled by registration of bending displacements of supporting plates by the speckle interferometer electronics, and temperature variation was measured by the thermocouple inserted into a hole between slits.
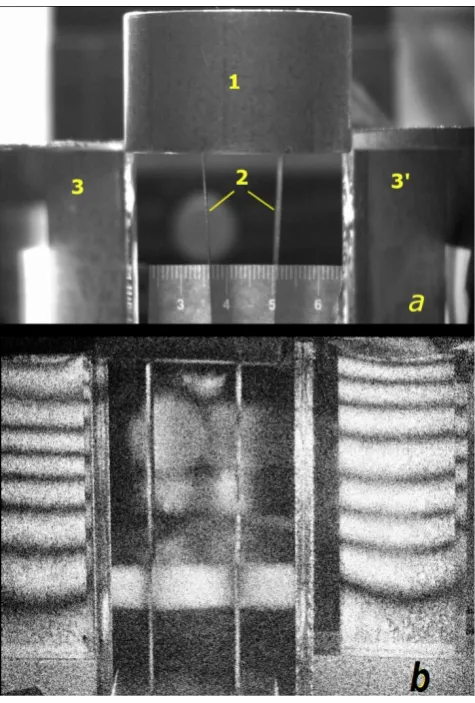
Fig. 1, a shows us the briquette 1 placed on top of the sensitive elements 2 in the form of rectangular plates cantilever-fixed in the lower basis; by 3 and 3ʹ we denote the
A. L. Popov, V. N. Mironenko, V. M. Kozintsev, D. A. Chelyubeev,
E. V. Murashkin,
Member,
IAENG
, A. V. Chentsov, V. V. Vasenev, and S. P. Chervonobrodov
Sample-Free Measurement of Linear Thermal
Expansion Coefficient of Aluminum-Matrix
Composites Using Speckle-Interferometry
Method
rotary mirrors providing lighting and display of the front planes of plates into the video-camera of interferometer. Microdisplacements of the plates surfaces were registered as speckle interferograms. The magnified characteristic a speckle interferogram of plates bending, generated at briquette's temperature variation and, respectively, change of its length is illustrated on Fig. 1, b.
Fig. 1. Measurement of sample length variation at change of its temperature: (a): 1 is briquette, 2 are supporting plate-like sensitive
elements, 3, 3 ʹ are rotary mirrors, (b) is interferogram.
The LTEC of a briquette in the chosen direction was determined by the total number of interference fringes on both sensitive elements registered in the chosen temperature range during briquette cooling. The known formula of thermal lengthening of the rod was used in form
∆
l= l
α∆Т
(1)
wherein α is the linear expansion coefficient, l is the initial length of a rod, ∆l is a length of increment, ∆Т is a temperature variation.
The distance between the ends of sensitive elements was accepted as the initial length of the rod. Change of this distance is calculated by equation
∆l=λN/2 (2) where N denotes total number of interference fringes on a sensitive elements, λ is a laser wavelength (in this case
λ = 0,532 microns).
After substituting equation (2) in (1) we can obtain
α = λ N/(2l ∆Т) (3) The equation (3) allows us to calculate the LTEC of the sample by total displacements of the ends of sensitive elements in the predetermined temperature range.
III. MATERIALS FOR THE STUDY
The studied composites of the Al-Si-Ni system are intended for use in precise instruments where objects with small temperature drift are required, i.e. the low LTEC of the material is important. Composites of this system have low LTEC up to 10-13 ppm/°C. The decreasing of the composite LTEC is made by introducing of the greatest possible quantity of Si by different ways since the LTEC for silicon is six times less, than for Al and the LTEC of composite material goes down at increase of silicon concentration [9]. Nickel also lowers LTEC, but its content is limited because big density of nickel substantially increases density of the composite and increase the mass of objects made from such materials.
Such composites are obtained by a multistage technological processes. During production of these composites, the Si, lowering LTEC, is introduced into aluminum matrix by the activational mechanical alloying up to the volume fraction of 48-50% [10], [11]. In the set of briquettes considered for testing the composite was obtained by alloying the powder of quickly crystallized matrix hypereutectic silumin in high-energy devices and subsequent hot pressing in high vacuum [12], [13]. Additionally, a briquette from a perspective composite obtained by infiltration of aluminum melt of brand 5083 into carbon fibers and containing 30% of carbon fiber is considered.
For powder particles balling up prevention during mechanical alloying the surfactants which are performing technological lubrication are used. For example, stearins, paraffins. However, these traditional organic substances at compaction and heating partially decay accompanied with hydrogen formation which is the reason of excessive residual porosity of the final product (more than 10% volume) that negatively influences on material properties. Reduction of porosity down to 1-2% is possible if disperse carbon is used as a surfactant. At the same time composites with aluminum and its alloys matrix and various micro or nano-disperse carbon fillers are also interesting in connection with a potential possibility of constructions weight decrease.
surface and low friction coefficient. Nanoparticles of RGO have high (up to 20000) relation of average diameter of particles (down to 20 microns) to their thickness (2-10 atomic layers).
We studied cylindrical briquettes with diameter of 50 mm and height 30 mm. 17 briquettes from composites of the Al-Si-Ni system and a briquette from a perspective composite containing 30% of carbon fiber were selected from the batches for LTEC measurements.
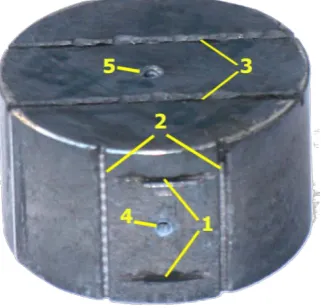
Preparation of briquettes for LTEC measurement consisted in cutting of pairs of parallel slits on one side surface and on one of the face planes of the briquettes. Slits were necessary for fixing the length and direction of a basic segment, and for prevention of slippage which could happen at briquette putting over the smooth surface of supporting plates. According to orientation of the slits, LTEC measurement in 3 directions was provided by: lengthwise, radial and chord. The holes for thermocouples placement were drilled between the slits. One of such briquettes with the slits oriented for LTEC measurement in lengthwise (1), chord (2) and radial (3) directions is shown on Fig. 2; the holes for thermocouples (4, 5) are also visible. The same sized sample from aluminum D16 alloy with known LTEC was prepared similarly to test the LTEC measurement technique.
[image:3.595.90.251.400.554.2]After our measurements, some samples were made out of a part of briquettes to perform LTEC measurements on the dilatometer DIL 402PC "Netzsch" by a standard method.
Fig. 2. Al-Si briquette with slits oriented for LTEC measurements in lengthwise (1), chord (2) and radial (3) directions; 4, 5 indicate holes for thermocouples.
IV.LTEC MEASUREMENTS RESULTS AND THEIR DISCUSSION
Measurements of LTEC in the lengthwise direction were taken on all briquettes, in the chord and radial directions were taken on a part of briquettes as LTEC anisotropy in various directions for the tested powder composites was small. A series of measurements of no less than three tests was performed on each briquette in the chosen direction. The measurement was performed during the whole time of briquette cooling from the temperature of 150°C down to room temperature. Their cooling rate was relatively low due to considerable mass of briquettes. The unevenness of temperature distribution on the briquette did not exceed 1°C In during the whole cooling period.
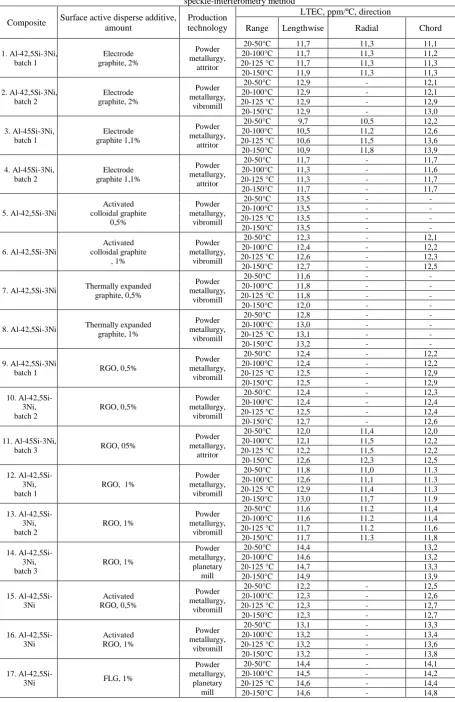
The results of LTEC measurements on all tested briquettes for temperature intervals 50°C, 100°C, 20-125°C and 20-150°C are given in Table 1. For this purpose,
during the hot briquette placed on sensitive elements cooling down from 150°C the data on their displacements by a number of fringes collected on sensitive elements interferograms were recorded through each 25°C. After full cooling of the briquette these fringes were united for LTEC calculation in the given temperature intervals according to formula (3).
Measurements of LTEC on a test sample of D16 alloy were as follows: for the temperature interval 20 ÷ 50 °C ̶ 22,4 ppm/°C, for intervals of 20 ÷ 100 °C and 20 ÷ 125 °C ̶ 22,7 ppm/°C, for the interval 20 ÷ 150 °C ̶ 22,9 ppm/°C that is close to the known LTEC values, that are: 22,7 ppm/°C in the range of temperatures 20 - 100 °C and 23,4 ppm/°C in the range of 20 - 200 °C [9]. The scatter of the measured LTEC values by three measurements in the modes of sample cooling from 150 °C to room temperature did not exceed ± 0,2 ppm/°C.
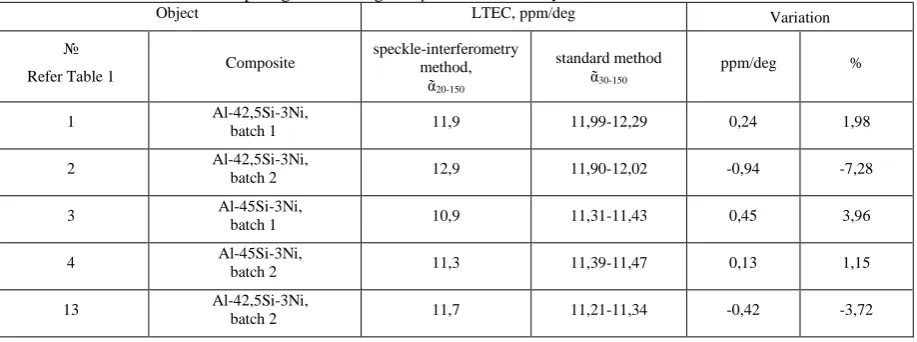
Considering Table 1 we can conclude the following remarks: stable measurement results on different batches of materials show that the suggested technique and equipment confidently measures LTEC in the range of temperatures 20-150 ºС. The results well correlate with the measurements performed on a standard dilatometer (Table 2).
The suggested technique enables determining the LTEC values with sufficient degree of reliability depending on chemical composition, production technology of the material and direction of samples cutting.
The briquettes from aluminum-matrix composite materials presented for the tests have average LTEC twice smaller, than the aluminum D16 alloy.
We find that the smallest values of LTEC were shown by composites with higher content of silicon and disperse nanocarbon RGO additive. Composites with disperse microcarbon additive of graphite had the most stable LTEC within the considered temperature range. The general tendency of other materials is smooth increase of LTEC values at increase in the upper bound of temperature range. The strong LTEC anisotropy is for the metal-composite obtained by melt infiltration. For lengthwise direction its LTEC was close to the same for D16 alloy.
For measurements error assessment we can note that for both heating and cooling of briquettes no noticeable differences in indications of thermal sensors placed in the middle of side surface and in the center of the end face of the cylinder were recorded that leads to a conclusion on almost uniform temperature field of the sample cooling down freely. Then we can neglect the influence of temperature field heterogeneity in a briquette on LTEC measurement error. The scatter of the measured LTEC values, characteristic for D16 test sample, was also observed at LTEC measurements on briquettes from aluminum-matrix composite materials.
Each of the listed errors makes the contribution to a total error of measured LTEC value. So, with an average LTEC for the considered composites of Al-Si-Ni system equal to 12 ppm/ºC, defined on an interval of 25°C at average distance between slits in 17 mm, an error in definition of displacements as a half-fringe this leads to an error in LTEC equal to ±0,3 ppm/ºC, an error in determination of temperature of ±0,5 °C - to an error in LTEC, equal to ±0,2 ppm/ºC, and an error in the measured distance between slits ±0,2 mm - to an error in LTEC, equal to ±0,2 ppm/ºC. From this follows that the total error in LTEC measurements LTEC can reach ±0,7 ppm/ºC.
Note that though the method is approved on objects of relative small sizes, it can be used for sample-free LTEC measurement on objects of considerably big sizes.
Thus, the suggested method provides sample-free LTEC measurement of objects in any direction and on any base at rather any form and the sizes of an object with a sufficient accuracy.
ACKNOWLEDGMENT
Authors thank S.Yu. Petrovich and G. G. Chernik for carrying out the activational mechanical alloying of powders for this work.
REFERENCES
[1] A. V. Manzhirov, "Advances in the theory of surface growth with applications to additive manufacturing technologies." Procedia Engineering, vol. 173, pp. 11-16, 2017.
[2] A. V. Manzhirov, and N. K. Gupta, "Fundamentals of continuous growth processes in technology and nature." Procedia IUTAM, vol. 23, pp. 1-12, 2017.
[3] A. V. Manzhirov, "Fundamentals of mechanical design and analysis for AM fabricated parts" Procedia Manufacturing, vol. 7, pp. 59-65, 2017.
[4] (Dilatometers Online Sources style) Available: http://www.theta-us.com/dil/dil1.html,
https://www.linseis.com/en/our-products/dilatometer/, https://www.azom.com/materials-equipment.aspx?cat=51.
[5] T. A. Kompan, “Measurement capabilities and prospects of development of dilatometry.” World of measurement, no. 7, pp. 14– 21, July 2011. [In Russ.]
[6] R. V. Gol'dshtein, V. M. Kozintsev, A. V. Podlesnykh, A. L. Popov, S. I. Solodovnikov, and D. A. Cheliubeev, “Method of dilatometry,” RF Patent 2559797, Aug. 10, 2015. [In Russ.]
[7] R.V. Goldshtein, V.M. Kozintsev, N.M. Osipenko, A.L. Popov, D.A. Chelubeev, “Application of Panoramic Speckle Interferometry for Testing Prismatic Porous Samples for Uniaxial Compression,” Izvestiya vysshih uchebnyh zavedenij. Mashinostroenie no. 4, pp. 60-70, Apr. 2016. [In Russ.]
[8] A. B. Kruglov, V. B. Kruglov and A. V. Osintsev, ¨Measurement of the thermal coefficient of linear expansion on a speckle-interferoetric dilatometer,¨Instruments and Experimental Techniquesvol. 59, no. 1, pp. 156–158, Feb. 2010. [In Russ.]
[9] Physical quantity. Handbook. Moscow: Energoatomizdat, 1991. [In Russ.]
[10] V. G.Gopienko, M. W. Smagorinsky, A. A. Grigoryev, A. D. Bellavin, “Sintered materials of aluminum powders, ”Moscow: Metallurgiya, 1993. [In Russ.]
[11] V. V. Boldyrev, Experimental methods in Mechanochemistry of solid inorganic substances. Novosibirsk. 1983. [In Russ.]
[12] V. N Mironenko., V. V. Vasenev, V. N. Butrim, “Development of Powder Aluminium Matrix Composites. Technology of Light Alloys,” All-Russia Institute of Light Alloys Stock Co, №4, pp. 50-58, Apr. 2011. [In Russ.]
[13] V. V. Vasenev, V. N Mironenko, V. N. Butrim, ”Development of powder composite based on Al-Si-Ni system and technology for making billets of this composite,” . Universities’ proceedings. Powder metallurgy and functional coatings, №3, pp. 41-50, Mar. 2017. [14] Srinivasa R. Bakshi, Arvind Agarwal,“An analysis of the factors
affecting strengthening in carbon nanotube reinforced aluminum composites,”CARBON, vol. 49, iss. 2, pp. 533–544, Feb. 2011.
[15] V. N. Mironenko, N. V. Skuridina, S. Y. Petrovich, V. P. Cherepanov, “Mechanical alloying as a technology of creating composite materials based on aluminum. Theory and practice of technologies of manufacturing composite materials and new metal alloys,”– TPKM. Proceedings of 5-th Moscow International conference, 24-27 April 2007. Moscow: Izd. "Znanie, pp. 252-260, 2008. [In Russ.]
[16] Colin Hong An Wong, A. Ambrosi and M. Pumera,“Thermally reduced graphene exhibiting a close relationship to amorphous carbon,”Nanoscale, №4, pp. 4972-4977, Apr. 2012.
[17] L.A. Yolshina, R.V. Muradymov, I.V. Korsun, G.A. Yakovlev, S. V. Smirnov,“Novel aluminum- graphene and aluminum-graphite metallic composite materials: Synthesis and properties,”Journal of Alloys and Compounds, vol. 663, pp. 449-459, Apr. 2016.
TABLE I
The linear thermal expansion coefficient of aluminum-matrix composites measured using speckle-interferometry method
Composite Surface active disperse additive, amount
Production technology
LTEC, ppm/ºC, direction
Range Lengthwise Radial Chord
1.Al-42,5Si-3Ni, batch 1 Electrode graphite, 2% Powder metallurgy, attritor
20-50°C 11,7 11,3 11,1
20-100°C 11,7 11,3 11,2
20-125 °C 11,7 11,3 11,3
20-150°C 11,9 11,3 11,3
2.Al-42,5Si-3Ni, batch 2 Electrode graphite, 2% Powder metallurgy, vibromill
20-50°C 12,9 - 12,1
20-100°C 12,9 - 12,1
20-125 °C 12,9 - 12,9
20-150°C 12,9 - 13,0
3.Al-45Si-3Ni, batch 1 Electrode graphite 1,1% Powder metallurgy, attritor
20-50°C 9,7 10,5 12,2
20-100°C 10,5 11,2 12,6
20-125 °C 10,6 11,5 13,6
20-150°C 10,9 11,8 13,9
4.Al-45Si-3Ni, batch 2 Electrode graphite 1,1% Powder metallurgy, attritor
20-50°C 11,7 - 11,7
20-100°C 11,3 - 11,6
20-125 °C 11,3 - 11,7
20-150°C 11,7 - 11,7
5.Al-42,5Si-3Ni Activated colloidal graphite 0,5% Powder metallurgy, vibromill
20-50°C 13,5 - -
20-100°C 13,5 - -
20-125 °C 13,5 - -
20-150°C 13,5 - -
6.Al-42,5Si-3Ni Activated colloidal graphite , 1% Powder metallurgy, vibromill
20-50°C 12,3 - 12,1
20-100°C 12,4 - 12,2
20-125 °C 12,6 - 12,3
20-150°C 12,7 - 12,5
7.Al-42,5Si-3Ni Thermally expanded graphite, 0,5%
Powder metallurgy,
vibromill
20-50°C 11,6 - -
20-100°C 11,8 - -
20-125 °C 11,8 - -
20-150°C 12,0 - -
8.Al-42,5Si-3Ni Thermally expanded graphite, 1%
Powder metallurgy,
vibromill
20-50°C 12,8 - -
20-100°C 13,0 - -
20-125 °C 13,1 - -
20-150°C 13,2 - -
9.Al-42,5Si-3Ni
batch 1 RGO, 0,5%
Powder metallurgy,
vibromill
20-50°C 12,4 - 12,2
20-100°C 12,4 - 12,2
20-125 °C 12,5 - 12,9
20-150°C 12,5 - 12,9
10. Al-42,5Si-3Ni, batch 2 RGO, 0,5% Powder metallurgy, vibromill
20-50°C 12,4 - 12,3
20-100°C 12,4 - 12,4
20-125 °C 12,5 - 12,4
20-150°C 12,7 - 12,6
11.Al-45Si-3Ni,
batch 3 RGO, 05%
Powder metallurgy,
attritor
20-50°C 12,0 11,4 12,0
20-100°C 12,1 11,5 12,2
20-125 °C 12,2 11,5 12,2
20-150°C 12,6 12,3 12,5
12. Al-42,5Si-3Ni, batch 1
RGO, 1%
Powder metallurgy,
vibromill
20-50°C 11,8 11,0 11.3
20-100°C 12,6 11,1 11.3
20-125 °C 12,9 11,4 11.3
20-150°C 13,0 11,7 11.9
13. Al-42,5Si-3Ni, batch 2 RGO, 1% Powder metallurgy, vibromill
20-50°C 11,6 11.2 11,4
20-100°C 11,6 11.2 11,4
20-125 °C 11,7 11.2 11,6
20-150°C 11,7 11.3 11,8
14. Al-42,5Si-3Ni, batch 3 RGO, 1% Powder metallurgy, planetary mill
20-50°C 14,4 13,2
20-100°C 14,6 13,2
20-125 °C 14,7 13,3
20-150°C 14,9 13,9
15. Al-42,5Si-3Ni Activated RGO, 0,5% Powder metallurgy, vibromill
20-50°C 12,2 - 12,5
20-100°C 12,3 - 12,6
20-125 °C 12,3 - 12,7
20-150°C 12,3 - 12,7
16. Al-42,5Si-3Ni Activated RGO, 1% Powder metallurgy, vibromill
20-50°C 13,1 - 13,3
20-100°C 13,2 - 13,4
20-125 °C 13,2 - 13,6
20-150°C 13,2 - 13,8
17.
Al-42,5Si-3Ni FLG, 1%
Powder metallurgy,
planetary mill
20-50°C 14,4 - 14,1
20-100°C 14,5 - 14,2
20-125 °C 14,6 - 14,4
18.5083 Graphite (fiber) Melt infiltration
20-50°C 19,6 17,3 11,9
20-100°C 19,7 17,6 12,3
20-125 °C 19,9 17,7 12,6
[image:6.595.83.542.133.304.2]20-150°C 20,6 18,0 13,4
TABLE II
Comparing LTEC using the speckle-interferometry and standard method
Object LTEC, ppm/deg Variation
№
Refer Table 1 Composite
speckle-interferometry method,
ᾶ20-150
standard method
ᾶ30-150
ppm/deg %
1 Al-42,5Si-3Ni,
batch 1 11,9 11,99-12,29 0,24 1,98
2 Al-42,5Si-3Ni, batch 2 12,9 11,90-12,02 -0,94 -7,28
3 Al-45Si-3Ni,
batch 1 10,9 11,31-11,43 0,45 3,96
4 Al-45Si-3Ni,
batch 2 11,3 11,39-11,47 0,13 1,15
13 Al-42,5Si-3Ni,