www.impactjournals.com/oncotarget/
Oncotarget, 2017, Vol. 8, (No. 35), pp: 59492-59499
Correlation between apparent diffusion coefficient (ADC) and
cellularity is different in several tumors: a meta-analysis
Alexey Surov
1,*, Hans Jonas Meyer
1,*and Andreas Wienke
2,*1 Department of Diagnostic and Interventional Radiology, University of Leipzig, Leipzig, Germany
2Institute of Medical Epidemiology, Biostatistics, and Informatics, Martin-Luther-University Halle-Wittenberg, Halle (Saale),
Germany
*All authors contributed equally for this work
Correspondence to: Alexey Surov, email: [email protected] Keywords: DWI, MRI, ADC, cellularity, tumor
Received: March 31, 2017 Accepted: April 27, 2017 Published: May 10, 2017
Copyright: Surov et al. This is an open-access article distributed under the terms of the Creative Commons Attribution License 3.0 (CC BY 3.0), which permits unrestricted use, distribution, and reproduction in any medium, provided the original author and source are credited.
ABSTRACT
The purpose of this meta-analysis was to provide clinical evidence regarding relationship between ADC and cellularity in different tumors based on large patient data.
Medline library was screened for associations between ADC and cell count in different tumors up to September 2016. Only publications in English were extracted. The Preferred Reporting Items for Systematic Reviews and Meta-Analyses statement (PRISMA) was used for the research.
Overall, 39 publications with 1530 patients were included into the analysis. The following data were extracted from the literature: authors, year of publication, number of patients, tumor type, and correlation coefficients.
The pooled correlation coefficient for all studies was ρ = -0.56 (95 % CI = [−0.62; −0.50]),. Correlation coefficients ranged from ρ=−0.25 (95 % CI = [−0.63; 0.12]) in lymphoma to ρ=−0.66 (95 % CI = [−0.85; −0.47]) in glioma. Other coefficients were as follows: ovarian cancer, ρ = −0.64 (95% CI = [−0.76; −0.52]); lung cancer, ρ = −0.63 (95 % CI = [−0.78; −0.48]); uterine cervical cancer, ρ = −0.57 (95 % CI = [−0.80; −0.34]); prostatic cancer, ρ = −0.56 (95 % CI = [−0.69; −0.42]); renal cell carcinoma, ρ = −0.53 (95 % CI = [−0.93; −0.13]); head and neck squamous cell carcinoma, ρ = −0.53 (95 % CI = [-0.74; −0.32]); breast cancer, ρ = −0.48 (95 % CI = [−0.74; −0.23]); and meningioma, ρ = -0.45 (95 % CI = [−0.73; −0.17]).
INTRODUCTION
Diffusion weighted imaging (DWI) is a magnetic
resonance imaging (MRI) technique based on measure of
water diffusion in tissues [1]. Beside diagnostic potential,
DWI
can distinguish malignant from benign lesions [2, 3].
As reported previously, malignant tumors showed lower
apparent diffusion coefficient (ADC) values in comparison
to benign lesions [2, 3].
According to the literature, DWI can also provide
additional information about tissue microstructure [1, 4–6].
Experimental studies showed a strong association
between ADC and cell count in vitro [4–6]. It has been
shown that increase of cell density restricted water
diffusion and decreased ADC [5, 6]. However, published
data of clinical investigations were inconsistent. While
some authors identified significant correlations between
ADC and cellularity in different tumor, other did not
[7–11]. Moreover, there was a wide spectrum of reported
correlation coefficients ranging from 0.1 to -0.79 [7–12].
Furthermore, the number of investigated patients/tumors
in most studies was up to 50 [7–12]. Only few reports
analyzed relative large collectives ranging from 102 to
138 patients [13–16]. Therefore, the reported data cannot
be considered as evident. Overall, these facts question
the possibility to use ADC as a surrogate biomarker for
cellularity in clinical practice.
The purpose of this meta-analysis was to provide
clinical evidence regarding relationship between ADC and
cellularity in different tumors based on large patient data.
RESULTS
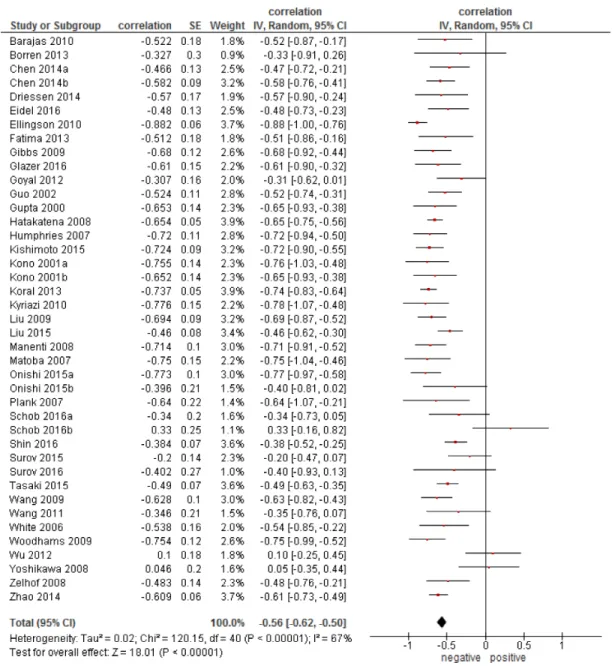
Overall, the pooled correlation coefficient for all
studies (Figure 1) was ρ = −0.56, (95 % CI = [−0.62;
−0.50]), heterogeneity τ
2= 0.02, (p < 0.00001), I
2= 67 %,
test for overall effect Z = 18.01 (p < 0.00001).
On the next step, correlation coefficients for every
tumor entities were calculated. For this analysis, only data
for primary tumors were acquired (Figure 2). The calculated
correlation coefficients ranged from ρ = −0.25 (95 % CI =
[−0.63; 0.12]) in lymphoma to ρ = −0.66 (95 % CI = [−0.85;
−0.47]) in glioma. Other coefficients were as follows: ovarian
cancer, ρ = −0.64 (95% CI = [−0.76; −0.52]); lung cancer,
ρ = −0.63 (95 % CI = [−0.78; −0.48]); uterine cervical cancer,
ρ = −0.57 (95 % CI = [−0.80; −0.34]); prostatic cancer,
ρ = −0.56 (95 % CI = [−0.69; −0.42]); renal cell carcinoma,
ρ = −0.53 (95 % CI = [−0.93; −0.13]); head and neck
squamous cell carcinoma (HNSCC), ρ = −0.53 (95 % CI =
[−0.74; −0.32]); breast cancer, ρ = −0.48 (95 % CI = [−0.74;
−0.23]); meningioma, ρ = −0.45 (95 % CI = [−0.73; −0.17]).
DISCUSSION
The present analysis provides evidence regarding
correlation between ADC, in particular ADC
mean, and
cellularity in different tumors based on a large sample.
Figure 1: Forest plots of correlation coefficients between ADC
meanand cellularity in patients from all involved 39
Previously, numerous studies investigated
associations between ADC and cell density in several
tumors [7-46]. Overall, most reports showed significant
correlations between these parameters [7, 9, 15, 16, 21, 32,
33, 41, 43]. So, Woodhams et al. found a strong inverse
correlation ( ρ = −0.75, p = 0.001) between ADC and cell
count in mucinous breast carcinoma [43]. Based on the
reported data, it has been postulated that DWI, namely
ADC is an imaging tool to estimate tumor cellularity [43].
However, there were also reports, in which no significant
correlations between ADC values and cell count were
found [11, 38]. For example, in different lymphomas,
the correlation coefficient between cell count and ADC
was ρ = 0.1 (p = 0.58) [10]. Similar negative results were
published for head and neck carcinoma (ρ = −0.418, p =
0.201) [39], meningioma ( ρ = −0.20, p = 0.164) [38],
and breast cancer (ρ = 0.048, p = 0.812) [11]. Some
previous reports attempted to explain their negative
findings by small number of patients [37, 39]. However,
another cause of the controversial results in the literature
is possible. Presumably, different tumors may have also
different associations between ADC and tumor cell count.
Our results confirmed this assumption. As seen, ADC
showed a moderate inverse correlation with cellularity
in the general collective. However, this finding did not
apply for each tumor entity, and, therefore, cannot be used
in clinical practice. We found that the correlation ADC
vs cellularity ranged significantly in different tumors.
It was weak in lymphomas, weak-to-moderate in breast
cancer and meningiomas, moderate in most investigated
epithelial tumors, and strong in gliomas, ovarian cancer,
and lung cancer. It is still unclear, why ADC correlates
well with cell count in some tumors, whereas in other
does not. Presumably, not only cell count, but also
other histopathological features, such as extracellular
matrix, nucleic areas, ratio stroma/parenchyma, and /or
microvessel density may play a role here. In fact, some
studies found statistically significant associations between
nucleic size and ADC in several lesions [46, 47]. Overall,
our findings suggest that ADC does not reflect cellularity
in all tumors.
Our analysis also identified another problem.
There are no reports regarding associations between
ADC and cellularity in most gastrointestinal tumors:
esophageal cancer, gastric cancer, colorectal carcinoma,
gastrointestinal stromal tumors, hepatocellular carcinoma,
pancreatic carcinomas, and gall bladder cancer. Also
in malignancies of cutis, such as malignant melanoma,
no reports about ADC/cell count could be identified.
Except renal cell carcinoma and prostatic cancer, no data
exist for urological malignancies. In addition, several
tumors involved into the present meta-analysis, for
Figure 2: Forest plots of correlation coefficients between ADCmean and cellularity in different primary tumors.
example, HNSCC, renal cell carcinoma, lung cancer,
and lymphomas contained small number of patients. This
relativizes the calculated results. Finally, for some tumors,
such as pancreatic neuroendocrine carcinoma [41], soft
tissue sarcomas [15], and thyroid cancer [37], only one
report was published, respectively. Therefore, no evident
data could be estimated for these entities. Clearly, further
researches are needed to investigate possible associations
between ADC and cellularity in these tumors. Thereafter,
a similar meta-analysis is also needed to prove new data.
In conclusion, different inverse correlations were
identified between ADC and cell count in the analyzed
tumors. ADC correlated strongly with cell count in
gliomas, followed by ovarian cancer, and lung cancer.
Therefore, in these tumors, ADC can be used as an
imaging marker to estimate cellularity. Moderate inverse
correlations were identified between ADC and cell count
in prostatic cancer, renal cell carcinoma, uterine cervical
cancer, and head/neck squamous cell carcinomas.
Furthermore, weak-to-moderate correlations were
found in breast cancer and meningioma. This finding
relativizes the possibility of ADC use to predict cellularity
in these tumors. Finally, weak correlation was identified
in lymphomas. Therefore, ADC cannot be used as a
cellularity biomarker in this entity.
No evident data can be provided to date for other
malignancies.
MATERIALS AND METHODS
Data acquisition and proving
MEDLINE library was screened for associations
between ADC and cell count in different tumors up to
September 2016. The following search words were used:
“DWI or diffusion weighted imaging or diffusion-weighted
imaging or ADC or apparent diffusion coefficient AND
cellularity or cell density or cell count or cell number”.
Only publications in English were extracted. The Preferred
Reporting Items for Systematic Reviews and Meta-Analyses
statement (PRISMA) was used for the research [48].
After exclusion of duplicates, a total of 494
publications was identified. These reports were involved
into the further analysis. For this work, only data regarding
ADC
meanderived from diffusion weighted imaging (DWI)
were acquired. Papers which did not contain correlation
coefficients between ADC and cell count were excluded.
In addition, data retrieved from diffusion tensor imaging
and other DWI parameters, such as D, ADC
max, and ADC
minwere also excluded. Finally, we excluded experimental
animals and in vitro studies. Overall, 455 publications
were excluded. Therefore, the present analysis comprises
39 publications with 1530 patients [7-46]. The following
data were extracted from the literature: authors, year
of publication, number of patients, tumor type, and
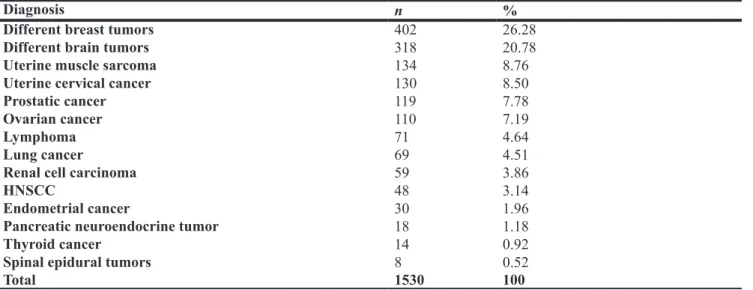
correlation coefficients. Most frequently, different breast,
followed by several brain tumors, uterine sarcomas,
uterine cervical cancer, prostatic cancer,and ovarian cancer
were reported (Table 1). Other tumors were rarer.
Meta-analysis
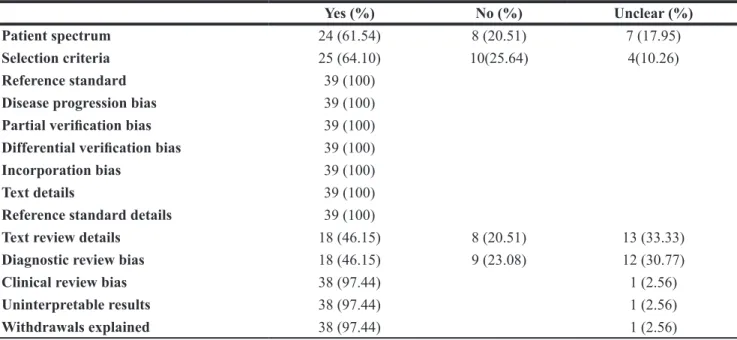
The methodological quality of the 39 included
studies was independently checked by two observers (A.S.
and H.J.M.) using the Quality Assessment of Diagnostic
Studies (QUADAS) instrument according to previous
descriptions [49, 50]. The results of QUADAS proving
are shown in Table 2.
Spearman’s correlation coefficient was used to
analyze associations between ADC
meanand cell count.
The reported Pearson correlation coefficients in some
publications were converted into Spearman correlation
coefficients as reported previously [51].
Table 1: Patients involved into the study
Diagnosis
n
%
Different breast tumors
402
26.28
Different brain tumors
318
20.78
Uterine muscle sarcoma
134
8.76
Uterine cervical cancer
130
8.50
Prostatic cancer
119
7.78
Ovarian cancer
110
7.19
Lymphoma
71
4.64
Lung cancer
69
4.51
Renal cell carcinoma
59
3.86
HNSCC
48
3.14
Endometrial cancer
30
1.96
Pancreatic neuroendocrine tumor
18
1.18
Thyroid cancer
14
0.92
Spinal epidural tumors
8
0.52
Total
1530
100
The meta-analysis was undertaken by using
RevMan 5.3. Heterogeneity was calculated by means of
the inconsistency index I² [52, 53]. In a subgroup analysis
studies were stratified by tumor type. Furthermore,
DerSimonian and Laird random-effects models with
inverse-variance weights were used without any further
correction [54].
REFERENCES
1. Fornasa F. Diffusion-weighted Magnetic Resonance Imaging: What Makes Water Run Fast or Slow? J Clin Imaging Sci. 2011; 1:27.
2. Wang J, Takashima S, Takayama F, Kawakami S, Saito A, Matsushita T, Momose M, Ishiyama T. Head and neck lesions: characterization with diffusion-weighted echo-planar MR imaging. Radiology. 2001; 220:621–30. 3. Sasaki M, Eida S, Sumi M, Nakamura T. Apparent diffusion
coefficient for sinonasal diseases: differentiation of benign and malignant lesions. AJNR Am J Neuroradiol. 2011; 32:1100–06.
4. Xu J, Does MD, Gore JC. Sensitivity of MR diffusion measurements to variations in intracellular structure: effects of nuclear size. Magn Reson Med. 2009; 61:828–33. 5. Galons JP, Lope-Piedrafita S, Divijak JL, Corum C,
Gillies RJ, Trouard TP. Uncovering of intracellular water in cultured cells. Magn Reson Med. 2005; 54:79–86.
6. Harkins KD, Galons JP, Secomb TW, Trouard TP. Assessment of the effects of cellular tissue properties on ADC measurements by numerical simulation of water diffusion. Magn Reson Med. 2009; 62:1414–22.
7. Barajas RF Jr, Rubenstein JL, Chang JS, Hwang J, Cha S. Diffusion-weighted MR imaging derived apparent
diffusion coefficient is predictive of clinical outcome in primary central nervous system lymphoma. AJNR Am J Neuroradiol. 2010; 31:60–66.
8. Borren A, Moman MR, Groenendaal G, Boeken Kruger AE, van Diest PJ, van der Groep P, van der Heide UA, van Vulpen M, Philippens ME. Why prostate tumour delineation based on apparent diffusion coefficient is challenging: an exploration of the tissue microanatomy. Acta Oncol. 2013; 52:1629–36.
9. Driessen JP, Caldas-Magalhaes J, Janssen LM, Pameijer FA, Kooij N, Terhaard CH, Grolman W, Philippens ME. Diffusion-weighted MR imaging in laryngeal and hypopharyngeal carcinoma: association between apparent diffusion coefficient and histologic findings. Radiology. 2014; 272:456–63.
10. Wu X, Pertovaara H, Dastidar P, Vornanen M, Paavolainen L, Marjomäki V, Järvenpää R, Eskola H, Kellokumpu-Lehtinen PL. ADC measurements in diffuse large B-cell lymphoma and follicular lymphoma: a DWI and cellularity study. Eur J Radiol. 2013; 82:e158–64. 11. Yoshikawa MI, Ohsumi S, Sugata S, Kataoka M,
Takashima S, Mochizuki T, Ikura H, Imai Y. Relation between cancer cellularity and apparent diffusion coefficient values using diffusion-weighted magnetic resonance imaging in breast cancer. Radiat Med. 2008; 26:222–26. 12. Ellingson BM, Malkin MG, Rand SD, Connelly JM,
Quinsey C, LaViolette PS, Bedekar DP, Schmainda KM. Validation of functional diffusion maps (fDMs) as a biomarker for human glioma cellularity. J Magn Reson Imaging. 2010; 31:538–48.
13. Hatakenaka M, Soeda H, Yabuuchi H, Matsuo Y, Kamitani T, Oda Y, Tsuneyoshi M, Honda H. Apparent diffusion coefficients of breast tumors: clinical application. Magn Reson Med Sci. 2008; 7:23–29.
Table 2: Methodological quality of the involved 39 studies according to the QUADAS criteria
Yes (%)
No (%)
Unclear (%)
Patient spectrum
24 (61.54)
8 (20.51)
7 (17.95)
Selection criteria
25 (64.10)
10(25.64)
4(10.26)
Reference standard
39 (100)
Disease progression bias
39 (100)
Partial verification bias
39 (100)
Differential verification bias
39 (100)
Incorporation bias
39 (100)
Text details
39 (100)
Reference standard details
39 (100)
Text review details
18 (46.15)
8 (20.51)
13 (33.33)
Diagnostic review bias
18 (46.15)
9 (23.08)
12 (30.77)
Clinical review bias
38 (97.44)
1 (2.56)
Uninterpretable results
38 (97.44)
1 (2.56)
14. Shin HJ, Kim SH, Lee HJ, Gong G, Baek S, Chae EY, Choi WJ, Cha JH, Kim HH. Tumor apparent diffusion coefficient as an imaging biomarker to predict tumor aggressiveness in patients with estrogen-receptor-positive breast cancer. NMR Biomed. 2016; 29:1070–78.
15. Tasaki A, Asatani MO, Umezu H, Kashima K, Enomoto T, Yoshimura N, Aoyama H. Differential diagnosis of uterine smooth muscle tumors using diffusion-weighted imaging: correlations with the apparent diffusion coefficient and cell density. Abdom Imaging. 2015; 40:1742–52.
16. Zhao SH, Qiang JW, Zhang GF, Ma FH, Cai SQ, Li HM, Wang L. Diffusion-weighted MR imaging for differentiating borderline from malignant epithelial tumours of the ovary: pathological correlation. Eur Radiol. 2014; 24:2292–99. 17. Chen L, Zhang J, Chen Y, Wang W, Zhou X, Yan X,
Wang J. Relationship between apparent diffusion coefficient and tumour cellularity in lung cancer. PLoS One. 2014; 9:e99865.
18. Eidel O, Neumann JO, Burth S, Kieslich PJ, Jungk C, Sahm F, Kickingereder P, Kiening K, Unterberg A, Wick W, Schlemmer HP, Bendszus M, Radbruch A. Automatic Analysis of Cellularity in Glioblastoma and Correlation with ADC Using trajectory analysis and automatic nuclei counting. PLoS One. 2016; 11:e0160250.
19. Fatima Z, Motosugi U, Waqar AB, Hori M, Ishigame K, Oishi N, Onodera T, Yagi K, Katoh R, Araki T. Associations among q-space MRI, diffusion-weighted MRI and histopathological parameters in meningiomas. Eur Radiol. 2013; 23:2258–63.
20. Gibbs P, Liney GP, Pickles MD, Zelhof B, Rodrigues G, Turnbull LW. Correlation of ADC and T2 measurements with cell density in prostate cancer at 3.0 Tesla. Invest Radiol. 2009; 44:572–76.
21. Glazer DI, Hassanzadeh E, Fedorov A, Olubiyi OI, Goldberger SS, Penzkofer T, Flood TA, Masry P, Mulkern RV, Hirsch MS, Tempany CM, Fennessy FM. Diffusion-weighted endorectal MR imaging at 3T for prostate cancer: correlation with tumor cell density and percentage Gleason pattern on whole mount pathology. Abdom Radiol (NY). 2017; 42:918–25.
22. Goyal A, Sharma R, Bhalla AS, Gamanagatti S, Seth A, Iyer VK, Das P. Diffusion-weighted MRI in renal cell carcinoma: a surrogate marker for predicting nuclear grade and histological subtype. Acta Radiol. 2012; 53:349–58. 23. Guo Y, Cai YQ, Cai ZL, Gao YG, An NY, Ma L,
Mahankali S, Gao JH. Differentiation of clinically benign and malignant breast lesions using diffusion-weighted imaging. J Magn Reson Imaging. 2002; 16:172–78. 24. Gupta RK, Cloughesy TF, Sinha U, Garakian J, Lazareff J,
Rubino G, Rubino L, Becker DP, Vinters HV, Alger JR. Relationships between choline magnetic resonance spectroscopy, apparent diffusion coefficient and quantitative histopathology in human glioma. J Neurooncol. 2000; 50:215–26.
25. Humphries PD, Sebire NJ, Siegel MJ, Olsen ØE. Tumors in pediatric patients at diffusion-weighted MR imaging: apparent diffusion coefficient and tumor cellularity. Radiology. 2007; 245:848–54.
26. Kishimoto K, Tajima S, Maeda I, Takagi M, Ueno T, Suzuki N, Nakajima Y. Endometrial cancer: correlation of apparent diffusion coefficient (ADC) with tumor cellularity and tumor grade. Acta Radiol. 2016; 57:1021–28.
27. Kono K, Inoue Y, Nakayama K, Shakudo M, Morino M, Ohata K, Wakasa K, Yamada R. The role of diffusion-weighted imaging in patients with brain tumors. AJNR Am J Neuroradiol. 2001; 22:1081–88.
28. Koral K, Mathis D, Gimi B, Gargan L, Weprin B, Bowers DC, Margraf L. Common pediatric cerebellar tumors: correlation between cell densities and apparent diffusion coefficient metrics. Radiology. 2013; 268:532–37. 29. Kyriazi S, Nye E, Stamp G, Collins DJ, Kaye SB,
deSouza NM. Value of diffusion-weighted imaging for assessing site-specific response of advanced ovarian cancer to neoadjuvant chemotherapy: correlation of apparent diffusion coefficients with epithelial and stromal densities on histology. Cancer Biomark. 2010; 7:201–10.
30. Liu Y, Bai R, Sun H, Liu H, Wang D. Diffusion-weighted magnetic resonance imaging of uterine cervical cancer. J Comput Assist Tomogr. 2009; 33:858–62.
31. Liu Y, Ye Z, Sun H, Bai R. Clinical Application of Diffusion-weighted magnetic resonance imaging in uterine cervical cancer. Int J Gynecol Cancer. 2015; 25:1073–78. 32. Manenti G, Di Roma M, Mancino S, Bartolucci DA,
Palmieri G, Mastrangeli R, Miano R, Squillaci E, Simonetti G. Malignant renal neoplasms: correlation between ADC values and cellularity in diffusion weighted magnetic resonance imaging at 3 T. Radiol Med (Torino). 2008; 113:199–213.
33. Matoba M, Tonami H, Kondou T, Yokota H, Higashi K, Toga H, Sakuma T. Lung carcinoma: diffusion-weighted mr imaging—preliminary evaluation with apparent diffusion coefficient. Radiology. 2007; 243:570–77.
34. Onishi N, Kanao S, Kataoka M, Iima M, Sakaguchi R, Kawai M, Kataoka TR, Mikami Y, Toi M, Togashi K. Apparent diffusion coefficient as a potential surrogate marker for Ki-67 index in mucinous breast carcinoma. J Magn Reson Imaging. 2015; 41:610–15.
35. Plank C, Koller A, Mueller-Mang C, Bammer R, Thurnher MM. Diffusion-weighted MR imaging (DWI) in the evaluation of epidural spinal lesions. Neuroradiology. 2007; 49:977–85.
36. Schob S, Meyer J, Gawlitza M, Frydrychowicz C, Müller W, Preuss M, Bure L, Quäschling U, Hoffmann KT, Surov A. Diffusion-Weighted MRI reflects proliferative activity in primary CNS Lymphoma. PLoS One. 2016; 11:e0161386. 37. Schob S, Voigt P, Bure L, Meyer HJ, Wickenhauser C,
Surov A. Diffusion-Weighted imaging using a readout-segmented, multishot EPI sequence at 3 T distinguishes between morphologically differentiated and undifferentiated subtypes of thyroid carcinoma-a preliminary study. Transl Oncol. 2016; 9:403–10.
38. Surov A, Gottschling S, Mawrin C, Prell J, Spielmann RP, Wienke A, Fiedler E. Diffusion-weighted imaging in meningioma: prediction of tumor grade and association with histopathological parameters. Transl Oncol. 2015; 8:517–23.
39. Surov A, Stumpp P, Meyer HJ, Gawlitza M, Höhn AK, Boehm A, Sabri O, Kahn T, Purz S. Simultaneous (18) F-FDG-PET/MRI: associations between diffusion, glucose metabolism and histopathological parameters in patients with head and neck squamous cell carcinoma. Oral Oncol. 2016; 58:14–20.
40. Wang XZ, Wang B, Gao ZQ, Liu JG, Liu ZQ, Niu QL, Sun ZK, Yuan YX. Diffusion-weighted imaging of prostate cancer: correlation between apparent diffusion coefficient values and tumor proliferation. J Magn Reson Imaging. 2009; 29:1360–66.
41. Wang Y, Chen ZE, Yaghmai V, Nikolaidis P, McCarthy RJ, Merrick L, Miller FH. Diffusion-weighted MR imaging in pancreatic endocrine tumors correlated with histopathologic characteristics. J Magn Reson Imaging. 2011; 33:1071–79. 42. White ML, Zhang Y, Robinson RA. Evaluating tumors and
tumorlike lesions of the nasal cavity, the paranasal sinuses, and the adjacent skull base with diffusion-weighted MRI. J Comput Assist Tomogr. 2006; 30:490–95.
43. Woodhams R, Kakita S, Hata H, Iwabuchi K, Umeoka S, Mountford CE, Hatabu H. Diffusion-weighted imaging of mucinous carcinoma of the breast: evaluation of apparent diffusion coefficient and signal intensity in correlation with histologic findings. AJR Am J Roentgenol. 2009; 193:260–66. 44. Zelhof B, Pickles M, Liney G, Gibbs P, Rodrigues G,
Kraus S, Turnbull L. Correlation of diffusion-weighted magnetic resonance data with cellularity in prostate cancer. BJU Int. 2009; 103:883–88.
45. Chen SD, Hou PF, Lou L, Jin X, Wang TH, Xu JL. The correlation between MR diffusion-weighted imaging and pathological grades on glioma. Eur Rev Med Pharmacol Sci. 2014; 18:1904–09.
46. Langer DL, van der Kwast TH, Evans AJ, Plotkin A, Trachtenberg J, Wilson BC, Haider MA. Prostate tissue composition and MR measurements: investigating the relationships between ADC, T2, K(trans), v(e), and corresponding histologic features. Radiology. 2010; 255:485–94.
47. Surov A, Caysa H, Wienke A, Spielmann RP, Fiedler E. Correlation between different ADC fractions, cell count, Ki-67, total nucleic areas and average nucleic areas in meningothelial meningiomas. Anticancer Res. 2015; 35:6841–46.
48. Moher D, Liberati A, Tetzlaff J, Altman DG, PRISMA Group. Preferred reporting items for systematic reviews and meta-analyses: the PRISMA statement. PLoS Med. 2009; 6:e1000097.
49. Whiting P, Rutjes AW, Reitsma JB, Bossuyt PM, Kleijnen J. The development of QUADAS: a tool for the quality assessment of studies of diagnostic accuracy included in systematic reviews. BMC Med Res Methodol. 2003; 3:25. 50. Whiting PF, Weswood ME, Rutjes AW, Reitsma JB,
Bossuyt PN, Kleijnen J. Evaluation of QUADAS, a tool for the quality assessment of diagnostic accuracy studies. BMC Med Res Methodol. 2006; 6:9.
51. Chalkidou A, Landau DB, Odell EW, Cornelius VR, O’Doherty MJ, Marsden PK. Correlation between Ki-67 immunohistochemistry and 18F-fluorothymidine uptake in patients with cancer: A systematic review and meta-analysis. Eur J Cancer. 2012; 48:3499–513.
52. Leeflang MM, Deeks JJ, Gatsonis C, Bossuyt PM, Cochrane Diagnostic Test Accuracy Working Group. Systematic reviews of diagnostic test accuracy. Ann Intern Med. 2008; 149:889–97.
53. Zamora J, Abraira V, Muriel A, Khan K, Coomarasamy A. Meta-DiSc: a software for meta-analysis of test accuracy data. BMC Med Res Methodol. 2006; 6:31.
54. DerSimonian R, Laird N. Meta-analysis in clinical trials. Control Clin Trials. 1986; 7:177–88.