Ames Laboratory Conference Papers, Posters, and
Presentations
Ames Laboratory
2003
Quasi-Static Transduction Characterization of
Galfenol
Richard A. Kellogg
Iowa State University
Alison B. Flatau
University of Maryland - College Park
Arthur E. Clark
Clark Associates
Marilyn Wun-Fogle
United States Navy
Thomas A. Lograsso
Iowa State University, [email protected]
Follow this and additional works at:
http://lib.dr.iastate.edu/ameslab_conf
Part of the
Aerospace Engineering Commons, and the
Metallurgy Commons
This Conference Proceeding is brought to you for free and open access by the Ames Laboratory at Iowa State University Digital Repository. It has been accepted for inclusion in Ames Laboratory Conference Papers, Posters, and Presentations by an authorized administrator of Iowa State University Digital Repository. For more information, please [email protected].
Recommended Citation
Kellogg, Richard A.; Flatau, Alison B.; Clark, Arthur E.; Wun-Fogle, Marilyn; and Lograsso, Thomas A., "Quasi-Static Transduction Characterization of Galfenol" (2003).Ames Laboratory Conference Papers, Posters, and Presentations. 61.
Quasi-Static Transduction Characterization of Galfenol
Abstract
The objective of the work presented is characterization of the magnetoelastic transduction properties of single crystal and textured polycrystalline Fe-Ga alloys (Galfenol) under controlled mechanical, magnetic and thermal conditions. Polycrystalline samples of interest include a directionally solidified specimen, which possesses a favorable saturation magnetostriction output, and an extruded specimen, whose magnetostriction properties were significantly reduced by annealing. A brief discussion of the thermally controlled transducer used for the magnetic testing is presented first. Thereafter, the single crystal response to major-loop cyclic magnetic fields under different temperature and stress conditions, as well as its response to minor-loop cyclic magnetic fields and major-loop cyclic stress is examined. Next, the magnetic and magnetostrictive responses to major-loop cyclic magnetic field conditions are compared for the directionally solidified, extruded and single crystal specimens. The paper concludes with a magnetic characterization summary of the different Fe-Ga alloys examined.
Keywords
Aerospace Engineering
Disciplines
Aerospace Engineering | Materials Science and Engineering | Metallurgy
Comments
This article is fromASME 2003 International Mechanical Engineering Congress and Exposition68 (2003): pp. 273-280, doi:10.1115/IMECE2003-43140
Proceedings of IMECE’03: 2003 ASME International Mechanical Engineering Congress & Exposition November 16-21, 2003, Washington, D.C. USA
IMECE2003-43140
QUASI-STATIC TRANSDUCTION CHARACTERIZATION OF GALFENOL
Rick A. Kellogg
Aerospace Eng. & Eng. Mechanics Iowa State University, Ames, IA 50011
Alison Flatau
Aerospace Engineering
University of Maryland, College Park, MD 20742
Arthur E. Clark
Clark Associates Adelphi, MD 20783
Marilyn Wun-Fogle
Naval Surface Warfare Center, Carderock Division, W. Bethesda, MD 20817
Thomas Lograsso
DOE Ames Laboratory Ames, IA 50011
ABSTRACT
The objective of the work presented is characterization of the magnetoelastic transduction properties of single crystal and textured polycrystalline Fe-Ga alloys (Galfenol) under controlled mechanical, magnetic and thermal conditions. Polycrystalline samples of interest include a directionally solidified specimen, which possesses a favorable saturation magnetostriction output, and an extruded specimen, whose magnetostriction properties were significantly reduced by annealing. A brief discussion of the thermally controlled transducer used for the magnetic testing is presented first. Thereafter, the single crystal response to major-loop cyclic magnetic fields under different temperature and stress conditions, as well as its response to minor-loop cyclic magnetic fields and major-loop cyclic stress is examined. Next, the magnetic and magnetostrictive responses to major-loop cyclic magnetic field conditions are compared for the directionally solidified, extruded and single crystal specimens. The paper concludes with a magnetic characterization summary of the different Fe-Ga alloys examined.
1. THERMALLY CONTROLLED TRANSDUCER
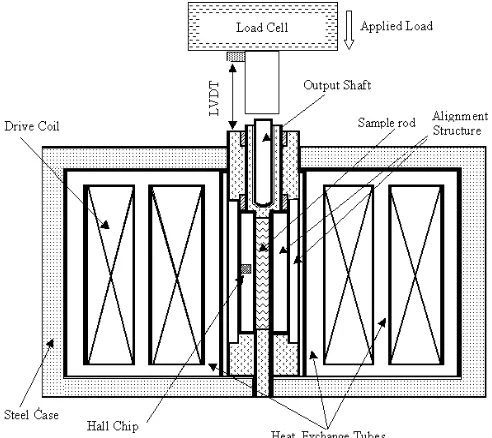
With the goal of testing rod-shaped Fe-Ga alloys (Galfenol) under controlled quasi-static conditions, thermal, magnetic and mechanical operating regimes were considered in the design and operation of the thermally controlled transducer. A schematic (Figure 1) highlights the transducer components and their magnetic and mechanical configurations, which are essential to effective specimen characterization. The Fe-Ga rod under study resides at the transducer’s center. Immediately surrounding the rod is a sense coil (not shown) for detecting the sample’s magnetic induction. A Hall Effect chip, which detects the local magnetic field, is located at the midpoint of the rod length and adjacent to the rod’s surface. Exterior to the sense coil and Hall chip is a cooling tube encased solenoid. For this study, the design constraint for thermal control was steady state operation ±1°C over a range of -21°C to +80°C while generating magnetic fields up to 258 kA/m (3240 Oersted).
Thermally regulated fluid was used in the heat-exchange tubes to mitigate the effects of ohmic heating produced by the drive solenoid. Minimizing demagnetizing effects of low aspect ratio samples, annealed low carbon steel end pieces served as interfaces between a sample and the steel transducer housing to form a complete magnetic circuit. The end pieces and output shaft functioned as the load path through which compressive forces up to 3600 N were transmitted to the system through a load cell. A free-hanging weight assembly imposed constant longitudinal compressive loads for the major and minor-loop cyclic magnetic tests, while a hydraulic MTS machine generated variable loads for the major-loop cyclic stress tests. Further design, construction and operational details of the thermally controlled transducer are given by Kellogg [1].
For all test procedures, each specimen’s magnetization state was recorded using a sense coil and flux meter while the magnetostriction was measured with strain gauges. Two strain gauges were used, each with an active area of 6.1 x 1.9 mm, and were positioned on opposing sides of the rod at mid-length. Throughout specimen testing, data was collected by a computer-controlled system at 50 scans per second. The data recorded includes the magnetic induction, local magnetic field, solenoid current, load and longitudinal strain.
2. SINGLE CRYSTAL
The single crystal Fe81.0Ga19.0 rod (6.35 mm diameter by
23.7 mm long) used for this study was extracted from a single crystal ingot grown at 4 mm/hour using the modified Bridgman technique. The ingot was annealed at 1000°C for 168 hours and afterward water quenched from 800°C to obtain a nearly random Ga distribution throughout the crystal lattice. Using back reflection Laue diffraction, the rod was oriented and sectioned from the ingot with a [100] crystal axis aligned within 0.5° of the rod’s longitudinal axis.
2.1 Major-loop cyclic magnetic field
The magnetization and magnetostrictive response of the single crystal specimen was measured under quasi-static 0.05 Hz, 800 Oe amplitude sinusoidal applied magnetic field conditions. Testing was conducted for constant compressive stress conditions including 14.4, 45.3 and 87.1 MPa and at constant temperatures ranging from -21°C to +80°C. For each combination of stress and temperature examined, the sample was stabilized at the desired temperature and stress level then demagnetized over 240 cycles using a 1.0 Hz sinusoidal field, which underwent a 5% geometric decay every 1.5 cycles from an initial amplitude of 1600 Oe. Acquired data provided characterization of the material’s permeability, magnetization and magnetostriction as a function of applied magnetic field, compressive stress and temperature.
2.1.1 Stress effects
Figure 2 shows the magnetostriction and magnetization developed due to an applied magnetic field for temperatures of 22°C and 80°C. This figure highlights the effect of stress on the Fe-Ga alloy’s magnetomechanical response. As the magnitude of compressive stress is increased, attaining equivalent levels of magnetostriction requires larger applied magnetic fields. The 14.4 MPa stress condition exhibits less strain for applied fields above 300 Oe as this stress is too low to provide complete pre-alignment of magnetic moments along the <100> easy axes perpendicular to the rod’s longitudinal axis. The maximum magnetostriction obtained at 22°C (near maximum magnetization with an applied field of 800 Oe) was 306 x10-6
for the 14.4 MPa stress condition and 322 x10-6 for both the
45.3 MPa and 87.1 MPa stress conditions. The maximum
magnetostriction obtained at 80°C was 273 x10-6 for the 14.4
MPa stress condition and 298 x10-6 for both the 45.3 MPa and
87.1 MPa stress conditions. Notably, 95% or more of the maximum strain for each stress level was developed with applied fields of 400 Oe or less. Figure 2 also demonstrates that for all load cases with fields of less than 300 Oe the magnetization reaches 95% or more of the maximum magnetization of 1295 and 1265 kA/m at 800 Oe respectively for 22°C and 80°C. Below 200 Oe the decreasing slope of the magnetization versus applied field curve indicates that increasing stress levels reduce the permeability. Measured near the coercive field for both temperature conditions, the relative permeability decreases 6-fold from µr ∼360 to µr ∼60 for the
14.4 MPa and 87.1-MPa stress conditions respectively. The hysteresis in the magnetostriction and magnetization plots of Figure 2 occurs for two primary reasons. The sample experiences domain wall pinning due to crystal defects and the transducer itself generates a 12-Oe hysteresis in the applied magnetic field due to remanence of the steel flux-return path.
Figure 2. Applied magnetic field dependencies of the magnetostriction and magnetization of Fe81.0Ga19.0 for various compressive stresses: a) at 22ºC; b) at 80ºC.
All measurements were made at 0.05 Hz.
[image:4.612.32.278.45.264.2]b) a)
Figure 1. Thermally controlled transducer used for measuring the response of Fe-Ga rod-shaped specimens to the quasi-static application of coaxial
[image:4.612.322.576.264.454.2]magnetic fields and compressive stress. The closed magnetic circuit provides a flux return path.
Figure 3 provides some insight into the sample’s magnetization process where the magnetostriction is shown as a function of the magnetization squared for three compressive stress levels at 22°C. Assuming sufficient compressive stress to dominate the magnetostriction process and to align all the magnetic moments with the <100> easy axes perpendicular to the rod’s longitudinal axis at zero field, one would expect the theoretical linear plot indicated. This follows from the relationship λ = (3/2)λs(M/Ms)2, which describes the
magnetostriction λ generated by the magnetization M where λs
and Ms are the conventional saturation magnetostriction and
(determined at room temperature by orthogonal saturating applied fields) and Ms = 1313 kA/m that were previously
measured by Clark et al. [3] using a (010) disk cut from the same Fe-Ga alloy ingot the rod used in this study was from. The fact that the experimental traces of Figure 3 are nonlinear indicates that the stress anisotropy generated by these compressive stresses were insufficient to cause the magnetization processes to occur solely by 90° moment rotation even at 87.1 MPa. Additionally, the maximum λ values for both the 45.3 MPa and 87.1 MPa compressive stress conditions at this temperature were identically 320 x10-6, which
suggests that the (3/2)λs value of 395 x10-6 may be unattainable
[image:5.612.320.575.153.344.2]even with further increases in compressive stress.
Figure 3. Magnetization squared dependencies of the magnetostriction of Fe81.0Ga19.0 at 22ºC for three
[image:5.612.43.281.191.363.2]compressive stresses.
Figure 3. Magnetization squared dependencies of the magnetostriction of Fe81.0Ga19.0 at 22ºC for three
compressive stresses.
2.1.2 Temperature effects 2.1.2 Temperature effects
The effects of temperature on the relationship of magnetostriction and magnetization versus applied magnetic field were measured for the 45.3 MPa compressive stress condition. Figure 4a illustrates that the magnetization exhibits only a small reduction with increasing temperature. Likewise, the magnetostriction experiences only a small reduction with increasing temperature for applied fields above 100 Oe. The small and consistent nature of the temperature dependencies suggests that no anomalous changes in the anisotropy constants
K1 or K2 or the magnetostriction constants λ100 or λ111 are
occurring. Figure 4b shows the maximum magnetostriction and magnetization values at an 800 Oe applied field and 45.3 MPa stress as a function of temperature. The maximum magnetostriction declines 12% from 340 x10-6 at -21°C to 298
x10-6 at 80°C. Similarly, the maximum magnetization declines 3.6% from 1313 kA/m to 1265 kA/m. These temperature dependencies of maximum magnetostriction and magnetization are consistent with the trends observed up to 27°C for Fe83Ga17
[4] and Fe82Ga18 [5].
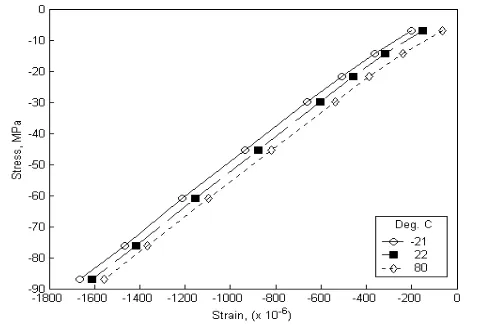
To supplement the knowledge of the magnetic and magnetostrictive properties of Fe-Ga alloys, the value of Young’s modulus of a Fe81.0Ga19.0 single crystal rod was
measured. The sample’s strain (in a demagnetized state at each stress level) was obtained over a 7.2 to 87.1 MPa compressive
stress range for temperatures of -21°, 22° and 80°C (Figure 5). Note that the initial strain levels at -7.2 MPa are arbitrary. Calculations of the slope for the 21 to 87.1 MPa compressive stress range (region of best linearity) reveal that the modulus is nearly temperature independent with a value of 56.6 ± 0.3 GPa. This modulus is lower than the high stress low field value of
∼77 GPa reported for single crystal Fe85Ga15 [4].
To supplement the knowledge of the magnetic and magnetostrictive properties of Fe-Ga alloys, the value of Young’s modulus of a Fe81.0Ga19.0 single crystal rod was
measured. The sample’s strain (in a demagnetized state at each stress level) was obtained over a 7.2 to 87.1 MPa compressive
stress range for temperatures of -21°, 22° and 80°C (Figure 5). Note that the initial strain levels at -7.2 MPa are arbitrary. Calculations of the slope for the 21 to 87.1 MPa compressive stress range (region of best linearity) reveal that the modulus is nearly temperature independent with a value of 56.6 ± 0.3 GPa. This modulus is lower than the high stress low field value of
∼77 GPa reported for single crystal Fe85Ga15[4].
Figure 4. Temperature dependencies of the magnetostriction and magnetization of Fe81.0Ga19.0 for a 45.3 MPa compressive stress: a) Applied magnetic field
response for three temperatures. b) Maximum magnetostriction and magnetization values for an 800 Oe
applied field. All measurements were made at 0.05 Hz. Figure 4. Temperature dependencies of the magnetostriction and magnetization of Fe81.0Ga19.0 for a 45.3 MPa compressive stress: a) Applied magnetic field
response for three temperatures. b) Maximum magnetostriction and magnetization values for an 800 Oe
applied field. All measurements were made at 0.05 Hz.
a) b)
Figure 5. Fe81.0Ga19.0 single crystal static stress-strain relationship for three different temperatures. Each
data point was collected after the specimen was demagnetized under the static load. Initial strain
levels are arbitrary.
Figure 5. Fe81.0Ga19.0 single crystal static stress-strain relationship for three different temperatures. Each
data point was collected after the specimen was demagnetized under the static load. Initial strain
levels are arbitrary.
[image:5.612.325.567.473.637.2]
2.2 Minor-loop cyclic magnetic field
The magnetostrictive response of the Fe81.0Ga19.0 single
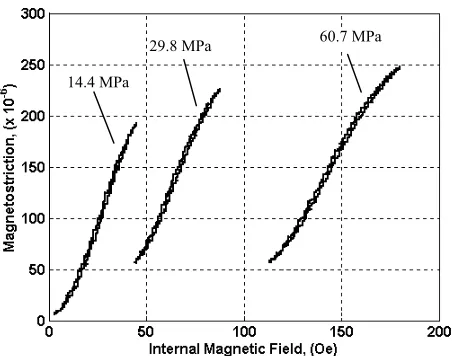
crystal rod was measured under quasi-static (0.05 Hz) minor-loop sinusoidal applied magnetic field conditions at room temperature using the thermally controlled transducer. Prior to each test, the sample was demagnetized using a 1.0 Hz, 5% geometrically decaying sinusoidal field to generate a consistent initial magnetic state. The initial magnetic field application included a sinusoidal increase to a DC bias field followed by sinusoidal field oscillation about that DC bias level. To provide the maximum range of an approximately linear magnetostrictive response, the magnetic DC bias level and minor-loop amplitude were optimized for each compressive stress level. Tests were conducted at 14.4, 29.8 and 60.7 MPa compressive stress conditions with loads produced by a hanging weight assembly. The magnetostriction as a function of internal magnetic field (i.e. the Hall chip reading, which is equivalent to the applied field minus demagnetizing fields) is shown in Figure 6 for the three stress levels. As compressive stress increases, the DC magnetic field bias must also be increased to maintain the best linear response. Considering the 60.7 MPa stress condition as an example, a 30 Oe AC field superimposed on a 150 Oe DC field yields an approximate peak to peak strain capability of 200 x10-6. For all stress levels
examined, the hysteresis is low (~2 Oe). This indicates that the energy loss/cycle is low for this quasi-static excitation field. However, it should be noted that eddy current losses will likely become a significant loss mechanism as the operating frequency is increased, because of a finite resistivity value of the material. The resistivity of disordered Fe1-xGax where 13 ≤ x
≤ 19 has not been measured, however Kawamiya et al. have reported the room temperature resistivity of Fe72Ga28, which
has an ordered Fe3Ga structure, to be ~70 µΩ
cm [5].
2.3 Major-loop cyclic stress
Major loop cyclic compressive stress testing of the Fe81.0Ga19.0 single crystal rod was conducted at room
temperature using the thermally controlled transducer and a
hydraulic MTS machine. Strain, magnetization and applied magnetic field data were recorded while the sample was linearly stress cycled in compression from 0 to 115 MPa and back. The test procedure consisted of three processes. First, the specimen was demagnetized under zero load over 240 cycles using a 1.0 Hz sinusoidal field undergoing a 5% geometric decay every 1.5 cycles from an initial amplitude of 1600 Oe. This demagnetization process was used to bring the Fe-Ga alloy sample to a reproducible demagnetized state prior to the start of each cyclic compression test. Second, a DC magnetic field, up to 891 Oe, was applied by linearly increasing the applied field from zero to the final value at a rate of 40 Oe/second. Finally, while recording data, the specimen was compressed and uncompressed at 2 MPa/second using a MTS machine in feedback load-control mode.
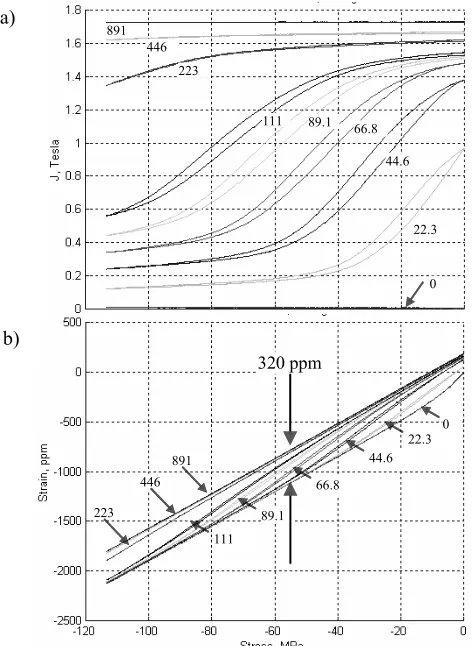
Repetition of the demagnetization, magnetic field application and cyclic compression steps for various levels of DC applied magnetic field produced a thorough characterization of the crystal’s strain and magnetization response. The combined test results for various applied field levels are shown in Figure 7 where strain and magnetization are plotted against stress. At the beginning of each test near zero stress, the initial magnetization and magnetostrictive strain levels are those arising from field-induced changes from the demagnetized state. With increasing levels of the applied field, the magnetostriction and magnetization values increase and approach their saturation values. These initial strain and magnetization values could be plotted against the applied field to give the initial responses (for a zero load condition) similar to that of Figure 2. Tracking each curve’s response to cyclic stress, the strain and magnetization loops are hysteretic, thus indicating an energy loss occurring over the compression and decompression cycle. Compared to conventional metals, the overall hysteresis is larger due to the coupling of mechanical and magnetic energy states. Energy losses arise during the magnetization changes are due to irreversible processes such as domain wall pinning. The stress-induced hysteretic losses of this Fe-Ga alloy are significantly smaller than those observed for giant magnetostrictive materials such as Terfenol-D [1]. Notably, the hysteresis is lowest for the curves where mechanical processes dominate the response to stress. This occurs for the extreme applied field conditions of zero and 891 Oe where magnetic moment rotations are limited. In the former case, compressive stress quickly pin the magnetic moments to the <100> easy axes perpendicular to the longitudinal axis. In the latter case, the magnetic moments are held in rigid alignment parallel to the rod’s longitudinal axis by the applied field. In both situations limited changes in magnetization with changing stress minimize the hysteresis.
29.8 MPa 60.7 MPa
[image:6.612.51.278.414.592.2]14.4 MPa
Figure 6. Quasi-static minor-loop cyclic magnetostrictive response of Fe81.0Ga19.0 single crystal rod for three constant compressive stress
levels collected at room temperature.
The slopes of the magnetic induction curves reflect the rate of change of magnetization with respect to stress. For constant levels of applied magnetic field, the differential ∆J/∆σ
approximates this slope to yield the piezomagnetic parameter d*
33. The values of d*33 are plotted against stress in Figure 8a
for the compression portion of the cyclic stress test. As the level of DC applied field increases, for values above 22.3 Oe, the peak values of d*
33 decrease while the peak locations occur
at increasing magnitudes of compressive stress. The lower d* 33
energy states. Sensor applications that detect stress changes using magnetomechanical coupling could maximize sensitivity (i.e. maximize d*
33) by using an optimal DC magnetic field for
an anticipated level of bias stress.
approach the strain-stress line for the zero applied field case (bottom left). Increasing applied field levels delay the onset of lower modulus values to larger magnitude compressive stress values. An evaluation of the strain-stress curve slopes shows that high fields and hence constant induction conditions, gave a magnetically saturated elastic modulus of Es = 57 GPa, which
was observed at all stress levels. For the zero field case, in the initial or demagnetized state, the elastic modulus at low stress was Eo = 28 GPa and the modulus at high stress was Eo = 57
GPa. The measured delta-E effect at low stress is (Es-Eo)/Eo =
104%. An additional feature of interest in Figure 7b is how the
slope of strain-stress curves vary with the different levels of applied magnetic field. The slope gives the material’s compliance, SH, with the inverse ratio providing the material’s
Young’s modulus of elasticity EYH, which is plotted against
stress in Figure 8b. The superscript “H” implies compliance and modulus values evaluated at a constant applied magnetic field. Larger slope values correspond to an increase in compliance and likewise a decrease in the modulus of elasticity. The elastic modulus for a given applied magnetic field and stress state is a result of the interplay between the mechanical and magnetic energy regimes. Considering the strain curves for the extreme applied field conditions, the response of the zero-field case is dominated by mechanical effects for stresses more negative than -20 MPa, and the response of the 891 Oe case is dominated by mechanical effects at least up to the -115 MPa stress level tested. As was mentioned when discussing hysteresis, magnetic moment rotation is constrained under both of these extreme conditions. For intermediate levels of applied field, the traces transition through a region of low elastic modulus then asymptotically
A final point of interest for the strain-stress response is the difference in strain values for the zero and 891 Oe applied fields at constant stress levels less than -20 MPa. Under these conditions of maximal magnetic moment rotation the strain difference is ∼320 x10-6, which is approximately equivalent to
the room temperature saturation magnetostriction capability of the specimen given in Figure 4b.
0 22.3 44.6 66.8 89.1 891
111 446
223
0 22.3 44.6
66.8
89.1 223
111 446
891
a)
b)
[image:7.612.324.552.244.587.2]320 ppm
Figure 7. Fe81.0Ga19.0 quenched single crystal major- loop cyclic stress response for DC applied magnetic fields (based on solenoid current) of 0, 22.3, 44.6,
66.8, 89.1, 111, 223, 446 and 891 Oe: a) Material induction vs. stress; b) Strain vs. stress.
0
22.3 44.6
66.8
89.1
891 111
446 223
0 22.3 44.6 66.8 89.1 891
111 446
[image:7.612.44.281.321.644.2]223
Figure 8. Fe81.0Ga19.0 quenched single crystal major- loop cyclic stress response for DC applied magnetic fields (based on solenoid current) of 0, 22.3, 44.6, 66.8, 89.1, 111, 223, 446 and 891 Oe: a) Piezomagnetic
parameter d*
33; b) Young’s modulus.
b) a)
b) a)
3. POLYCRYSTALLINE MAGNETIC RESPONSE
The quasi-static magnetization and magnetostriction responses of several Fe81Ga17 alloy rod-shaped polycrystalline
specimens were investigated to better understand their magnetic
processes and determine their suitability as actuation elements. These specimens include the directionally solidified, extruded and extruded plus annealed textured materials produced by the methods described by Kellogg [6]. The room temperature response to a 0.05 Hz sinusoidal applied magnetic field, having an amplitude of 900 Oe, was recorded for the 28.1 MPa constant compressive stress conditions using the thermally controlled transducer and hanging weight assembly.
Figure 9 shows the results for these three polycrystalline specimens along with the Fe81.0Ga19.0 single crystal response for
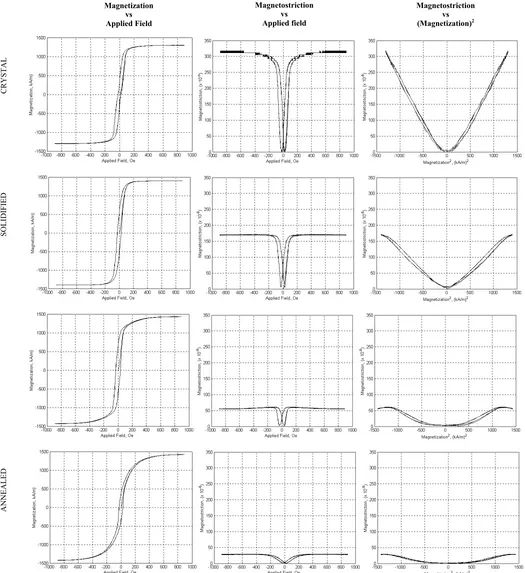
comparison. The first column of the figure illustrates each sample’s magnetization characteristics as a function of applied magnetic field. The Fe-19%Ga single crystal saturates at ∼1300 kA/m compared to a ∼1400 kA/m value for the Fe-17%Ga polycrystalline samples. This increase in saturation magnetization is consistent with a reduction in the content of nonmagnetic Ga [5]. The magnetization curves of the single crystal and directionally solidified specimens are nearly identical; however, the extruded and extruded plus annealed specimens are increasingly difficult to magnetize. This magnetization difficulty is indicated by the increasingly rounded approach to the final saturation magnetization level. Recalling magnetization curves for cubic Fe, the material becomes increasingly difficult to magnetize going from <100> to <110> and finally <111> crystallographic textures due to magnetocrystalline anisotropy. Comparing the extruded and extruded plus annealed specimens, the magnetization response suggests that annealing may have induced an increase in the <111> texture component.
The second column of Figure 9 presents the magnetostriction as a function of applied magnetic field. The quenched Fe-19%Ga single crystal generates the maximum output at 320 x10-6, with its near perfect <100> texture,
compared to values of 170 x10-6, 60 x10-6 and 30 x10-6 for the
Fe-17%Ga polycrystalline directionally solidified, extruded and extruded plus annealed specimens respectively. This trend in decreasing magnetostrictive output reflects an increasing deviation from the ideal <100> texture.
The final column of Figure 9 reveals that the magnetostriction and magnetization relationship varies depending upon the method of processing and ultimately with the degree and type of crystallographic texture. As presented for the single crystal in Section 2.1.1, theory suggests that the magnetostriction will be proportional to the magnetization squared. Therefore, if the goal of a high degree of <100> texturing had been achieved, the plots should increase linearly with variation of the ordinate value of M2. Although the single
crystal magnetostriction versus M2 response is fairly linear
beyond the initial magnetization phase at 400 (kA/m)2, the
extruded and polycrystalline specimens’ responses deviate substantially from linearity. Given the presence of the crystallographic grain misorientations revealed in the texture analysis of these samples by Kellogg [6], such deviations were not altogether unanticipated.
4. MAGNETIC CHARACTERIZATION SUMMARY
The Fe81.0Ga19.0 single crystal’s magnetic response under
broad temperature and stress conditions is well behaved. The applied magnetic fields required to develop most of the measured maximum magnetization and magnetostriction at
each temperature tested are low; only 400 Oe is needed for compressive stresses up to 87.1 MPa. Surprisingly, the stress of 87.1 MPa proved insufficient to cause magnetization processes to occur exclusively by 90° moment rotations. Constant temperature tests showed that compressive stresses greater than 14.4 MPa were needed to achieve the maximum magnetostriction. Over the -21°C to 80°C temperature range examined, the maximum magnetostriction and magnetization results decreased monotonically by 12% and 3% with increasing temperature from their respective maximum values of 340 x10-6 and 1313 kA/m at -21°C. This magnetostrictive
decrease is consistent with the 3.6% decrease in magnetization over the same temperature range (recall that magnetostriction is proportional to magnetization squared). No anomalous responses were found. The Young’s modulus of the demagnetized sample was nearly temperature insensitive over the -21°C to 80°C range with a value of ∼ 55 ± 1 GPa.
The room temperature quasi-static minor-loop cyclic magnetic field tests established that the Fe81.0Ga19.0 single
crystal can generate magnetostrictions of ∼ 200 x10-6 with good
linearity for compressive stresses up to 87.1 MPa. The applied magnetic field inputs required for this performance were a 30 Oe amplitude AC field superimposed on a bias field of 150 Oe. Transduction efficiencies should be favorable for this material as the observed hysteresis was small, with only a 2 Oe loop width detected using the Hall chip. Operating losses in activation applications may vary from this result, however, due to differences in transducer efficiencies arising from hysteresis in the transducer solenoid and flux return path.
Major-loop cyclic stress testing demonstrated that the Fe81.0Ga19.0 single crystal’s maximum delta-E effect is 104%
with a stiff modulus of 57 GPa coinciding with limited magnetic moment rotation and a soft modulus of 28 GPa coinciding with maximum magnetic moment rotation. In addition, the hysteresis developed over a stress cycle was dependent on the balance of stress and applied magnetic field energies. Maximum hysteresis is produced when magnetic moment rotation is abundant and energy is dissipated through domain wall motion and through pinning sites. Stress induced magnetization changes gave a maximum sensitivity of d*
33 =
~20x10-9 Tesla/Pa over a 20 MPa stress range. Optimizing this
sensitivity for sensing applications will require the proper choice of combined DC applied magnetic field and stress. Finally, the difference between the strain values for the saturating and zero applied magnetic fields (at any stress level less that -20 MPa) reflects the maximum magnetostriction capability of the material. In this case that was ∼ 320 x10-6.
The room temperature quasi-static major-loop cyclic magnetic field tests of the polycrystalline samples showed that the directionally solidified magnetization response was similar to that of the single crystal. However, the extruded and extruded plus annealed specimens exhibited greater magnetic anisotropy due to the presence of misoriented grains having magnetically hard axes in the direction of the applied magnetic field. These unfavorable grain orientations likely include <110> and <111> texture components. Magnetization trends were corroborated by the magnetostriction measurements whose values were 170 x10-6, 60 x10-6 and 30 x10-6 for the Fe-17%Ga
Figure 9. Comparison of magnetostriction and magnetization responses to applied magnetic field under a 28.1 MPa compressive stress for Fe81.0Ga19.0 quenched single crystal, Fe81Ga17 directionally solidified, Fe81Ga17
extruded, and Fe81Ga17 extruded plus annealed specimens.
SING
LE
CRYSTAL
Magnetostriction vs (Magnetization)2
DIRECTION-ALLY
SOLI
DIF
IED
EXTRU
D
ED
EXTRU
D
ED
&
ANNE
ALE
D
Magnetization vs Applied Field
Magnetostriction vs Applied field
plus annealed specimens, respectively. Unfortunately, the polycrystalline materials’ magnetostriction capability falls far short of the 320 x10-6 value observed for a <100> oriented
single crystal.
Despite the limited magnetostriction of the polycrystalline specimens developed to date, the large magnetostrict on of single crystals, high permeability and temperature insensitivity combined with previously observed robust mechanical properties make Fe-Ga alloys an attractive material for sensing applications as well as transducer, active vibration control and damping applications where the material is employed as an active structural material.
i
ACKNOWLEDGMENTS
This work was supported by the U.S. Office of Naval Research, the Carderock Division of the Naval Surface Warfare Center and the Office of Basic Energy Sciences, Materials Sciences Division of the U.S. Department of Energy. The assistance of the Ames Laboratory staff and use of their facilities for some of the work reported here is gratefully acknowledged. The Ames Laboratory is operated by Iowa State University for the United States Department of Energy under contract W-7405-ENG-82.
REFERENCES
[1] Kellogg, R.A., 2000, “The Delta-E Effect in Terfenol-D and its Application in a Tunable Mechanical Resonator,” Masters thesis, Iowa State University, Ames, IA.
[2] Cullity, B.D., 1972, Introduction to Magnetic Materials, (Chapter 8) Addison-Wesly Publishing Co., Reading MA. [3] Clark, A. E., Wun-Fogle, M. Restorff, J.B., and Lograsso, T.A., 2002, "Magnetostrictive Properties of Galfenol Alloys Under Compressive Stress," Materials Transactions, 43, pp. 881 - 886.
[4] Clark, A.E., Restorff, J.B., Wun-Fogle, M., Lograsso, T.A., and Schlagel, D.L., 2000, “Magnetostrictive properties of body-centered cubic Fe-Ga and Fe-Ga-Al alloys,”IEEE Transactions on Magnetics, 36, pp. 3238-3240.
[5] Kawamiya, N., Adachi, K., Nakamura, Y., 1972, “Magnetic properties and Mossbauer investigations of Fe-Ga alloys,” Journal of the Physical Society of Japan, 33(5), pp. 1318 – 1327.
![3 Methyl 4 {(E) [4 (methylsulfanyl)benzylidene]amino} 1H 1,2,4 triazole 5(4H) thione](data:image/gif;base64,R0lGODlhAQABAIAAAP///wAAACH5BAEAAAAALAAAAAABAAEAAAICRAEAOw==)