ORIGINAL RESEARCH
PEDIATRICS
Metrics and Textural Features of MRI Diffusion to Improve
Classification of Pediatric Posterior Fossa Tumors
D. Rodriguez Gutierrez, A. Awwad, L. Meijer, M. Manita, T. Jaspan, R.A. Dineen, R.G. Grundy, and D.P. Auer
ABSTRACT
BACKGROUND AND PURPOSE: Qualitative radiologic MR imaging review affords limited differentiation among types of pediatric posterior fossa brain tumors and cannot detect histologic or molecular subtypes, which could help to stratify treatment. This study aimed to improve current posterior fossa discrimination of histologic tumor type by using support vector machine classifiers on quantitative MR imaging features.
MATERIALS AND METHODS: This retrospective study included preoperative MRI in 40 children with posterior fossa tumors (17 medul-loblastomas, 16 pilocytic astrocytomas, and 7 ependymomas). Shape, histogram, and textural features were computed from contrast-enhanced T2WI and T1WI and diffusivity (ADC) maps. Combinations of features were used to train tumor-type-specific classifiers for medulloblastoma, pilocytic astrocytoma, and ependymoma types in separation and as a joint posterior fossa classifier. A tumor-subtype classifier was also produced for classic medulloblastoma. The performance of different classifiers was assessed and compared by using randomly selected subsets of training and test data.
RESULTS:ADC histogram features (25th and 75th percentiles and skewness) yielded the best classification of tumor type (on average ⬎95.8% of medulloblastomas,⬎96.9% of pilocytic astrocytomas, and⬎94.3% of ependymomas by using 8 training samples). The resulting joint posterior fossa classifier correctly assigned⬎91.4% of the posterior fossa tumors. For subtype classification, 89.4% of classic medulloblastomas were correctly classified on the basis of ADC texture features extracted from the Gray-Level Co-Occurence Matrix.
CONCLUSIONS: Support vector machine– based classifiers using ADC histogram features yielded very good discrimination among pediatric posterior fossa tumor types, and ADC textural features show promise for further subtype discrimination. These findings suggest an added diagnostic value of quantitative feature analysis of diffusion MR imaging in pediatric neuro-oncology.
ABBREVIATIONS:EP⫽ependymoma; Gd⫽gadolinium; max⫽maximum; MB⫽medulloblastoma; PA⫽pilocytic astrocytoma; SVM⫽support vector machine; TA⫽texture analysis
D
iffusion MR imaging discriminates different types of adult brain tumors.1-3In the pediatric literature, the diffusionre-striction has also been suggested to differentiate primitive neu-roectodermal tumor/medulloblastoma (MB) and other supra-and infratentorial tumors.4Several studies demonstrated that
pi-locytic astrocytomas (PAs) are characterized by significantly
higher average ADC values than ependymomas (EPs) and medul-loblastomas, but no clear difference was shown between EPs and MBs (Table 1).3,5-7However, by using the 75th percentile from
the ADC histogram, instead of an average ADC, a promising dis-crimination of 90% was achieved,7suggesting that individual
tu-mor components allow better classification or grading than aver-aged metrics. This concept is well in line with the known heterogeneity of underlying tumor biology and the current prac-tice of histologic diagnosis based on the most characteristic tumor parts.
Texture analysis (TA) is another powerful approach to char-acterize and quantify the tumor matrix. TA features provide in-Received June 17, 2013; accepted after revision August 20.
From the Division of Radiological and Imaging Sciences (D.R.G., A.A., M.M., R.A.D., R.G.G., D.P.A.), and Children’s Brain Tumor Research Centre (D.R.G., L.M., R.G.G., D.P.A.), University of Nottingham, Nottingham, UK; and Nottingham University Hospital Trust (A.A., L.M., T.J., R.A.D.), Nottingham, UK.
This work was funded by grant C7809/A10342, Children’s Cancer and Leukemia Group (Cancer Research United Kingdom and Engineering and Physical Sciences Research Council-CIP, in association with the Medical Research Council and Eng-land Department of Health).
Previously presented in part as a poster or oral presentations at: 36th European Society of Neuroradiology Annual Meeting, September 20 –23, 2012; Edinburgh, Scotland; and European Society for Magnetic Resonance in Medicine and Biology 2012 Congress, October 4 – 6, 2012; Lisbon, Portugal.
Please address correspondence to Dorothee Auer, MD, Division of Radiological and Imaging Sciences, Room W/B 1441, Queens Medical Centre, Derby Rd, Notting-ham NG7 2UH, United Kingdom; e-mail: [email protected]
Indicates open access to non-subscribers at www.ajnr.org
formation about spatial patterns in the distribution of image in-tensities and have been successfully used to discriminate tumor types8-11and types of tissue for segmentation12,13and to predict
prognosis.14Most important, texture features offer the potential
to discriminate distinct genetic tumor subtypes15-17 by using
combinations of T1WI, gadolinium (Gd)-enhanced T1WI, T2WI or FLAIR, and diffusion imaging in adult oligodendroglial tumors.
Significant advances are being made in characterizing molec-ular genetic tumor subtypes that predict differential survival and treatment responsiveness, which are particularly promising for future treatment stratification in medulloblastomas.18-20There is
a great interest in developing novel imaging tools to noninvasively predict tumor types and subtypes that may offer added value for first-line surgical treatment planning before histologic and mo-lecular diagnosis is available and in follow-up decision-making when repeat biopsies are impractical. Most approaches to date demand a significant increase in acquisition time (eg, MR spec-troscopy) and may be expensive and not widely available (eg,
18F-PET). Dedicated advanced image processing may, instead,
offer improved brain tumor classification without the time pen-alty based on the current standard brain tumor MR imaging pro-tocol, which includes Gd-enhanced T1, T2, and diffusion MR imaging.
The purpose of our study was to investigate the value of quan-titative analysis of standard clinical MR imaging to discriminate the main types of pediatric posterior fossa tumors (PA, MB, and EP) and subtypes (eg, to discriminate classic MB from other pos-terior fossa tumors). We compared the performance of individual or combined features derived from shape, texture, and histogram from anatomic T1WI and T2WI and diffusion map images. Mul-tiple features were combined to train support vector machines (SVMs), a widely used supervised learning approach that has been
previously suggested for tumor segmen-tation.21,22In SVM classifiers, features are
represented asn-dimensional vectors and combined to create a model of a particular class by using true and false training examples.
MATERIALS AND METHODS
Patients [image:2.594.52.371.59.122.2]Before this study, informed consent was obtained from all partic-ipating patients or their guardians to allow data collection and analysis for research by the UK Child Cancer and Leukemia Group Functional Imaging Group data base, a UK National Health Service Research Ethics Committee–approved study. Forty patients with posterior fossa tumors (17 MBs, 16 PAs, and 7 EPs; Table 2) were included. Inclusion criteria were confirmed histologic diagnosis along with a World Health Organization grading/subtype when applicable and a preoperative clinical MR imaging (without previous therapy), including diffusion imaging (Table 3).
MR Imaging
Because we only included preoperative MR imaging, acquisition was undertaken by using standard pediatric neuro-oncologic pro-tocols on several scanner platforms: 1.5T Signa (GE Healthcare, Milwaukee, Wisconsin); and 1.5T Intera or 3T Achieva (Philips Healthcare, Best, the Netherlands). For this analysis, Gd-en-hanced spin-echo T1WI (TR⫽598 – 647 ms, TE⫽12–14 ms, and 0.4 – 0.5⫻0.4 – 0.5 ⫻4.0 –5.0 mm3voxel size), fast spin-echo
T2WI (TR⫽3000 ms, TE⫽14 – 85 ms, and 0.4 – 0.5⫻0.4 – 0.5⫻ 4.0 –5.0 mm3voxel size), and diffusion data were used. Diffusion
data were obtained with different sequences, ranging from 3-di-rection diffusion-weighted imaging to 15-di3-di-rection diffusion ten-sor imaging, by using B0⫽0 s/mm2and either b
max⫽1000
s/mm2or b
max⫽800 s/mm2, TR⫽4883–5800 ms, TE⫽59 – 89
ms, and 1.9 –2.0⫻1.9 –2.0⫻3.0 – 4.0 mm3voxel size. Missing
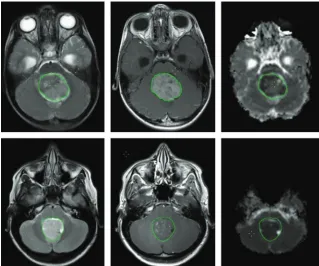
data or exclusion due to motion artifacts reduced the total num-ber of cases per imaging sequence (Table 3). ADC maps were generated by using the FMRIB Software Library toolbox (http:// www.fmrib.ox.ac.uk/fsl/). Two sample cases can be seen in Fig 1.
Normalization
T2WI and ADC maps were registered, by using the FMRIB Linear Registration Tool (FLIRT), to the contrast-enhanced T1WI data (in general, T1WI was acquired with a voxel size of 0.5⫻0.5⫻4.0 mm3; in 9 cases in which the dimensions were slightly different,
these were interpolated to a grid with 0.5⫻0.5⫻4.0 mm3voxel
size by using cubic interpolation). To minimize heterogeneity in image intensity caused by the use of different scanners and acqui-sition sequences, we intensity normalized the data to the mean value of normal-appearing white matter from 2 small ROIs drawn bilaterally above the ventricles.
Tumor Segmentation
[image:2.594.53.286.239.314.2]Whole-tumor ROIs were manually drawn by 2 clinical research fellows with radiology training and 4 years (M.M.) and 1 year (A.A.) of experience in neuroimaging research by using NeuROI Table 1: Average tumor ADC values in pediatric posterior fossa tumors (ⴛ10ⴚ3mm2/s)
Yamasaki et al 20053
Rumboldt et al 20066
Schneider et al 20075
Bull et al 20127
No. (MB/EP/PA) (9/6/6) (8/5/17) (7/2/4) (16/5/11)
EP 1.05–1.33 0.97–1.29 ⫺0.8–1.4 1.10–1.25
MB 0.68–0.99 0.48–0.93 ⫺0.5–1.0 0.67–1.22
Sig. difference (MB/EP) Yes Yes No No
Note:—Sig. indicates significant.
Table 2: Demographics
Total PA EP MB
Sex (M/F) 9:7 2:5 9:8
Age (yr)
Mean 8.4 9.4 8.2 7.8
Range 1.1–18.4 2.6–18.4 1.1–15.5 3.6–16.0
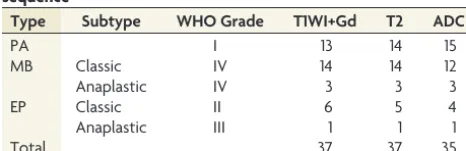
Table 3: No. of cases used in the analysis per MR imaging sequence
Type Subtype WHO Grade T1WI+Gd T2 ADC
PA I 13 14 15
MB Classic IV 14 14 12
Anaplastic IV 3 3 3
EP Classic II 6 5 4
Anaplastic III 1 1 1
Total 37 37 35
(http://www.nottingham.ac.uk/research/groups/clinicalneurology/ neuroi.aspx). Tumor ROIs were defined on the T1WI⫹Gd im-ages as areas of abnormal enhancement by using the coregis-tered precontrast T2WI to identify and exclude peripheral blood vessels adjacent to enhancing tumor and to include low-contrast tumor or necrotic tissue, excluding perilesional edema.
Shape, Histogram, and Texture Analysis
Shape, histogram, and texture features (Table 4) were extracted for each technique and patient by using in-house software devel-oped in Matlab R2010a (MathWorks, Natick, Massachusetts). For shape features, values were computed on each section, and the mean value was used to characterize the whole tumor. Histogram-derived metrics and texture features were calculated from quan-tized data, by using 80 bins for the range (0.5– 4.5⫻10⫺3mm2/s)
(bin width⫽ 0.05⫻10⫺3mm2/s). Histogram-derived metrics
were calculated from whole-tumor ROIs. Texture features were calculated from Gray-Level Co-Occurrence Matrices, as per Haralick.23As per the shape measures,
mean whole-tumor values were calcu-lated across tumor sections. For each case, several co-occurrence matrices were cal-culated, corresponding to different dis-tances (0.5, 1.0, 1.5, 2.0, and 2.5 mm). For each distance, co-occurrence matrices for several directions (0°, 45°, 90°) were computed.
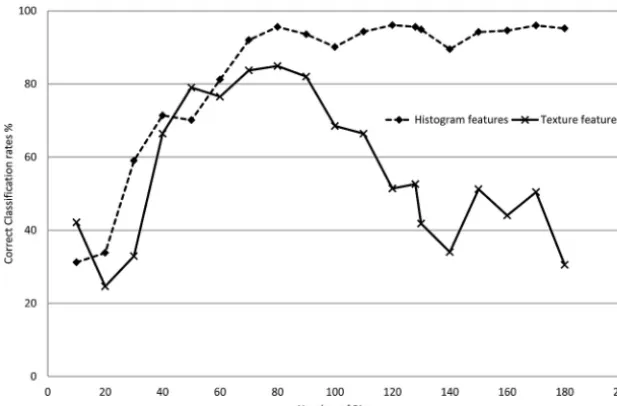
The effect of the number of bins (ie, intensity quantization level) used for tex-ture analysis on the ADC textex-ture featex-tures was investigated by recomputing the co-occurrence matrices for different quanti-zation levels (from 10 to 180 gray-level intensities). This is an important aspect in calculating co-occurrence matrices be-cause it directly determines the pairs of pixels with the same intensity that may be found within a region of interest.
Tumor-Type SVM Classifiers
Shapes from region-of-interest, histogram, and TA features from ADC, T1WI⫹Gd, and T2WI were used independently or in combination to train tumor-type specific binary classifiers for MB, PA, and EP. The SVM classifiers used are part of the Bioinformatics Toolbox in Matlab. They were implemented as linear classifiers that pro-duced a true/false classification for each tumor type.
Single-feature classifiers were created for every shape, histo-gram, and texture feature. In addition, combined classifiers (go-ing only up to a maximum of 4 features, to avoid overtrain(go-ing) were produced by a systematic combination of all features.
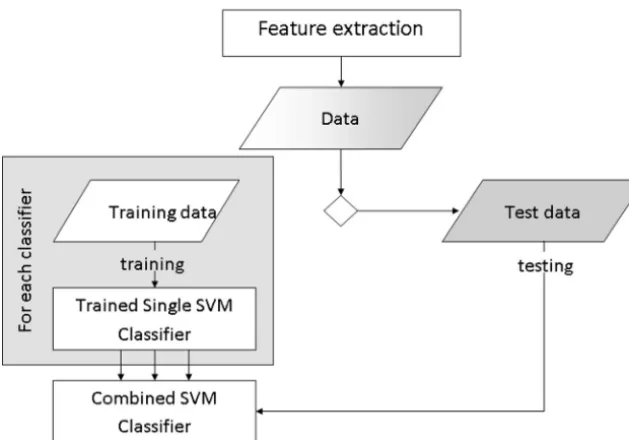
These individual tumor-type classifiers were combined to pro-duce a joint posterior fossa classifier (3 posterior fossa tumor classi-fiers) by using a simple voting system based on single-classifier per-formance. A diagram of the process can be seen in Fig 2.
Training was performed by randomly choosing both true (nT)
and false (nF) samples for each tumor type and by using the
remain-ing samples as a test set. Each classifier was retrained with different-size training sets (nT⫽nF⫽2, 3, 4) for each tumor type. For each
tumor type and training set size, the training and testing process was repeated 500 times to obtain average classification rates for each classifier.
Radiologic reports at our institution were reviewed to investi-gate the accuracy of qualitative classification. Provisional diagno-sis based on standard (including diffusion) MR imaging was re-corded and matched to histopathology for MB, EP, and PA tumor types. Cases in which no provisional diagnosis was provided were considered as incorrectly classified.
Tumor-Subtype SVM Classifiers
In addition to tumor-type classifiers, a set of classic MB classifiers was produced to investigate tumor-subtype classification. The FIG 1. T1WI⫹Gd (left), T2WI (middle), and ADC map (right) of an anaplastic (top) and classic MB.
[image:3.594.53.373.47.313.2]The overlaid region of interest (inside the green outline) is used to derive shape features and to calculate histogram and texture features for each image sequence.
Table 4: Shape, histogram, and texture parameters used in analysis
Parameter
Shape Volume, compactness, solidity
Histogram Mean variance, mode, maximum probability, skewness, kurtosis, energy, entropy; percentiles: 10%, 25%, 50%, 75%, and 90% Gray-Level
Co-Occurrence Matrix
[image:3.594.53.286.374.512.2]classic MB classifiers were based on ADC histogram and textural features.
Statistics
For both tumor type and subtype, we predefined⬍75% discrimina-tion accuracy as futile for potential clinical use. Group mean differ-ences for average ADC were calculated by using 1-way ANOVA and Tamhane T2 post hoc multiple comparison correction.
RESULTS
Between-Group Comparison of Metrics and Features
[image:4.594.53.368.46.266.2]There was a substantial overlap among the 3 tumor types for all metrics and features on all histogram and TA features investi-gated. Group mean differences for average ADCs were significant (Table 5).
Tumor-Type Classifiers
Average classification rates for those classifiers yielding at least 75% correct classification performance are shown in Table 6 for joint posterior fossa classifiers based on T2WI and T1WI⫹Gd features with 8 sample randomly selected training sets tested on the remaining samples. The best classifier was based on a combination of size, histogram, and textural features, and it achieved⬍80% correct discrimination among the 3 groups. Classifiers trained with smaller sample sizes produced lower correct classification rates.
Average classification rates for the best performing joint posterior fossa classifi-ers based on ADC features with 8 sample randomly selected training sets and tested on the remaining samples can be seen in Table 7. Combined histogram-feature classifiers performed better than single-feature classifiers. Classifiers based on his-togram metrics performed best with clin-ically useful 91% 3-way discrimination accuracy, which was better than that of classifiers built on either texture in isola-tion or combinaisola-tions of histogram and textural features. The best performing ADC texture classifier based on entropy and homogeneity failed to reach the pre-defined minimum 75% accuracy level.
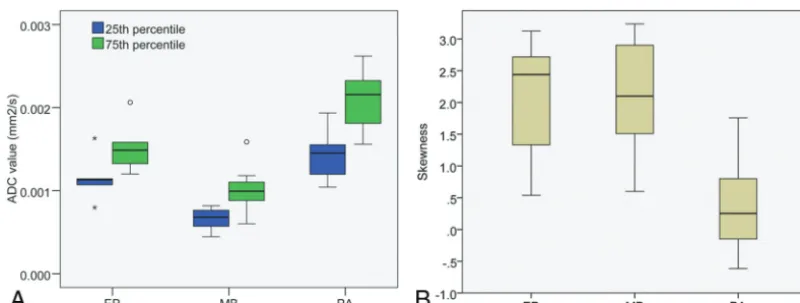
The best single-feature ADC classifier for our dataset was the 25th percentile of the ADC histogram (Table 7). Average ADC classification performance was sub-stantially lower at 71.9% (PA 87.2%, MB 70.6%, and EP 59.0%). The best multiple-feature classifier was a combination of histogram percentiles and skewness. The distributions for the 25th and 75th percentiles (though the normalized distributions were used in the classifiers) and skewness can be seen in Fig 3.
Neuroradiologists’ assessment at our institution according to clinical reports for the same dataset produced the following cor-rect classification rates: PA 65%, MB 53%, and EP 60%.
Tumor-Subtype Classifiers
Due to the low number of nonclassic MBs, tumor-subtype classi-fication was investigated by discriminating classic MB from other MBs (anaplastic MBs) and EPs, again by using a training set size of up to 8 randomly selected samples and by using the remaining samples as a test set. ADC texture-based features (best classifier: sum average⫹sum variance, 89.4% average correct classifica-tion) were more effective in discriminating classic MBs than ADC histogram features (best classifier: 75th percentle⫹max proba-bility, 68.0%) or T2WI and T1WI⫹Gd derived classifiers (best classifier: 77.6%). The inclusion of shape features did not result in increased performance.
Effect of the Number of Bins on Classification
All the histogram and texture features were calculated by using 80 bins (bin size⫽0.05⫻10⫺3mm2/s). The effect of the number of
bins or the bin size on classification performance was investigated by training a series of PA classifiers on the basis of histogram features only (ADC 25th percentile) and another on the basis of texture features only (ADC entropy⫹homogeneity) by using different bin sizes. With a range from 10 bins (bin size⫽0.4⫻ 10⫺3mm2/s) to 180 bins (bin size⫽0.02⫻10⫺3mm2/s),
classi-fication rates can be seen in Fig 4. For classifiers based on histo-gram metrics, a higher number of bins resulted in higher classifi-cation rates. Texture-based classificlassifi-cation decreased with both low and high numbers of bins. For this dataset, it was observed that the FIG 2. Training process to create single support vector machine classifiers for each tumor type
[image:4.594.53.285.316.409.2]and a combination step to produce a posterior fossa classifier to be tested on the remaining data.
Table 5: Average tumor ADC values (ⴛ10ⴚ3mm2/s)
PA EP MB PValuea
Tumor
Mean/SD 1.70/0.26 1.34/0.29 0.85/0.18 ⬍.05 Range 0.76–2.91 0.72–2.33 0.49–1.90
Normal-appearing white matter
Mean/SD 0.72/0.03 0.76/0.04 0.81/0.06 ⬍.05 Range 0.63–0.87 0.62–0.95 0.59–0.93 a
range of 60 –90 bins (sized 0.07– 0.04⫻10-3mm2/s) produced the
best classification rates.
DISCUSSION
We show that quantitative feature analysis based on clinical MR imaging allows discriminating the main pediatric posterior fossa tumor types with an accuracy of 91% when using a combination of diffusion histogram metrics. These were found to be the best-performing metrics from a comparison of histogram and texture analysis features derived from ADC, Gd-enhanced T1WI, and T2WI scans. Conversely, textural ADC features predicted classic MB on average in 89% of test runs, demonstrating the potential for further tumor subtyping and highlighting the need for dedi-cated task-specific classifier optimization.
Features from diffusion MR imaging allowed better diagnosis of tumor type than textural features derived from conventional imaging. In agreement with Bull et al,7we found that
histogram-derived metrics also outperformed mean tumor metrics. In this study, the 25th percentile expected to characterize the most cellu-lar and hence most aggressive tumor part allowed the best classi-fication. This is in partial contrast to the previously reported best discrimination based on the 75th percentile,7which also yielded a
good discrimination in our study. The difference may be
ex-plained by the exclusion of cystic components in their study but deliberate inclusion in ours.
Quantitative analysis of tumor characteristics produced higher correct classification rates than clinical radiology reports provided by neuroradiologists in a tertiary neuroscience center. This difference likely reflects both the added value of quantitative analysis and the current lack of emphasis in radiology reporting of predicting tumor type provided by histology. The proposed approach yielding higher accuracy in predicting tumor types and possibly subtypes opens new avenues of research to explore the potential patient benefit based on noninvasive cancer classifica-tion. The surge of promising stratified care concepts highlight the need for parallel development of noninvasive classifiers to com-plement histologic and genetic classification systems. High-qual-ity diagnosis of tumor type/subtype preoperatively would allow better planning of surgical resection extent and may become par-ticularly useful for treatment guidance in residual/recurrent disease.
The possibility of combining several features by using SVMs was investigated to complement the discriminatory information and therefore increase classification rates. The best performance was achieved when combining the 25th percentile⫹75th percen-tile⫹skewness (91.4% average correct classification). This per-Table 6: Average correct classification rates for joint posterior fossa classifiers (3-PFT) based on shape, T2WI, and T1WIⴙGd histogram/ texture featuresa
T1WI+Gd and T2WI Features PA (%) MB (%) EP (%) 3-PFT C (%)
ROI volume⫹T1WI⫹Gd histogram energy⫹T1WI⫹Gd sum entropy 83.5 78.2 74.6 78.8
ROI volume⫹T1WI⫹Gd mean⫹T1WI⫹Gd sum entropy 80.0 81.9 69.7 76.4
T2WI histogram skewness⫹T2WI mean⫹T2WI cluster prominence⫹T2WI sum variance 76.7 78.1 71.3 75.2 Note:—3-PFT indicates 3 posterior fossa tumor; 3-PFT C, 3 posterior fossa tumor classifiers.
a
[image:5.594.55.531.65.110.2]The performance of the separate individual classifiers that make up the combined classifier is also shown.
Table 7: Average correct classification rates for joint posterior fossa classifiers (3-PFT) based on shape and ADC histogram/texture featuresa
ADC Features PA (%) MB (%) EP (%) 3-PFT C (%)
Histogram 25th percentile⫹histogram 75th percentile⫹histogram skewness 96.9 95.8 94.3 91.4
Histogram 25th percentile⫹histogram median 95.6 92.0 91.8 89.2
ROI volume⫹histogram 75th percentile⫹histogram median⫹histogram entropy 96.2 91.3 83.9 87.4
Histogram 25th percentile 95.6 91.1 88.7 85.3
Histogram 75th percentile 96.1 89.7 85.1 83.5
Histogram median 92.3 89.9 82.2 78.9
Note:—3-PFT indicates 3 posterior fossa tumor; 3-PFT C, 3 posterior fossa tumor classifiers.
a
The performance of the separate individual classifiers that make up the combined 3-PFT classifier is also shown. The bottom 3 rows correspond to the best single-feature classifiers.
[image:5.594.55.534.152.230.2] [image:5.594.93.493.270.421.2]formance is similar to classifiers based on single-voxel proton MR spectroscopy studies of pediatric posterior fossa tumors (85%– 93%).5,24,25To date, MR spectroscopy is available in most
neuro-imaging centers but comes at a significant increase of acquisition time and is limited to large nonhemorrhagic tumors. There is, however, the potential for even higher classification rates of up to 98%26when using well-defined research protocols with multiple
TE MR spectroscopy with even longer acquisition times. In con-trast, we show here that a short single-technique ADC scan that is applicable to all posterior fossa tumors regardless of size or hem-orrhagic components affords a particular time-efficient classifica-tion of tumors.
The shape measures and ADC textural features, separately or in combination, neither yielded useful classification performance nor improved further ADC histogram metrics-based perfor-mance. Shape, textural, and histogram features from T1WI⫹Gd and T2WI data achieved moderate classification only (78.8% for the best classifier based on volume⫹T1WI⫹Gd histogram en-ergy⫹T1WI⫹Gd sum entropy). This comparative quantitative analysis provides further evidence that diffusion MR imaging is particularly well-suited to tumor characterization, and, in con-junction with advanced postprocessing, may overcome current limitations in the discriminatory performance of conventional MR imaging for posterior fossa tumors.
Most interesting, ADC textural features and not histogram metrics provided the best tumor-subtype classification perfor-mance, namely 89% correct classification of classic MBs. This was achieved by using a combination of ADC textural features (sum average and sum variance of the Gray-Level Co-Occurrence Ma-trix). However, the classifier was only binary in that it specified whether a sample was a classic MB. There were insufficient data to train a similar anaplastic MB classifier, but these promising results suggest that it may be possible to train subtype classifiers and that there may be specific imaging features that best reflect
specific tumor phenotypes. T2WI tex-tural features have been found to be strongly predictive of genotype muta-tions in low-grade gliomas.17
Feature selection for the classifiers in this study consisted of a systematic com-bination of up to 4 individual features for each technique. Histogram and textural features from different imaging sequences (T1WI⫹Gd, T2WI, or ADC) were not cross-matched. Some of those features may provide an overlapping description of the tumor characteristics (eg, histo-gram percentiles describe slightly differ-ent aspects of the same distribution), and feature-reduction techniques such as principal component analysis that pro-duce orthogonal features may improve classifier performance. Similarly, there are techniques that can be used to com-bine classifiers iteratively, such as Ada-Boost,27which operates by weighting the
combination of classifiers to minimize training error. These techniques produce strong classifiers from sets of weak classifiers that have the potential to further improve tumor type and subtype classification. Last, the SVM method-ology proposed here is flexible and can be used to incorporate other shape and texture measures28and wavelets29and to
com-bine multimodal imaging data.
Limitations
The main limitations are the relatively small datasets used, in which low numbers of tumor types (especially in EP) resulted in small training sets (maximum training set sizenT⫹ nF⫽8).
Using new data from other centers/scanners to train the SVM classifiers can help to improve their robustness. Most important, the presented classification is a best case scenario, given the data, and despite the promising accuracy, the generated classifiers from our dataset need to be prospectively tested on independent data to determine their robustness.
CONCLUSIONS
SVM-based classifiers by using a small set of ADC features (his-togram and/or textural) and a small training dataset yielded very good discrimination among pediatric posterior fossa tumors, even though the individual features substantially overlapped. Fea-tures derived from ADC histograms yielded classification rates similar to those in reports based on MR spectroscopy and higher than those extracted from conventional T1WI⫹Gd or T2WI data. ADC textural features showed promise in discriminating tumor subtypes.
ACKNOWLEDGMENTS
The authors thank Gill Glen for data management.
Disclosures: Daniel Rodriguez Gutierrez—RELATED:Grant: Cancer Research United Kingdom,* Engineering and Physical Sciences Research Council.* Amir Awwad—
RELATED:Grant: Cancer Research United Kingdom,* EPSRC.* Timothy Jaspan—
[image:6.594.57.366.47.250.2]UNRELATED:Consultancy: Hoffman La Roche,*Comments: radiologist on HERBY study, a joint academia/pharma research study investigating the use of the antian-giogenic drug bevacizumab in pediatric high-grade glioma. Dorothee P. Auer— RE-LATED:Grant: Cancer Research UK,* Engineering and Physical Sciences Research Council UK,*Comments: includes some allowance for project-related travel, UNRE-LATED:Board Membership: Parkinson’s UK,Comments: reimbursement of travel expenses to Parkinson’s UK Research Advisory Panel Meetings,Grants/Grants Pend-ing: MRC,* Engineering and Physical Sciences Research Council,* NIHR,* Stroke As-sociation,* Arthritis Research UK,* Special Trustees NUHT,* Parkinson’s UK* due to start. *Money paid to the institution.
REFERENCES
1. Heijmen L, Verstappen MC, Ter Voert EE, et al.Tumour response prediction by diffusion-weighted MR imaging: ready for clinical use?Crit Rev Oncol Hematol2012;83:194 –207
2. Gauvain KM, McKinstry RC, Mukherjee P, et al.Evaluating pediatric brain tumor cellularity with diffusion-tensor imaging.AJR Am J Roentgenol2001;177:449 –54
3. Yamasaki F, Kurisu K, Satoh K, et al.Apparent diffusion coefficient of human brain tumors at MR imaging.Radiology2005;235:985–91 4. Erdem E, Zimmerman RA, Haselgrove JC, et al.Diffusion-weighted imaging and fluid attenuated inversion recovery imaging in the evaluation of primitive neuroectodermal tumors.Neuroradiology
2001;43:927–33
5. Schneider JF, Confort-Gouny S, Viola A, et al.Multiparametric dif-ferentiation of posterior fossa tumors in children using diffusion-weighted imaging and short echo-time 1H-MR spectroscopy. J Magn Reson Imaging2007;26:1390 –98
6. Rumboldt Z, Camacho DL, Lake D, et al.Apparent diffusion coeffi-cients for differentiation of cerebellar tumors in children.AJNR Am J Neuroradiol2006;27:1362– 69
7. Bull JG, Saunders DE, Clark CA.Discrimination of paediatric brain tumours using apparent diffusion coefficient histograms.Eur Ra-diol2012;22:447–57
8. Schad LR, Bluml S, Zuna I.MR tissue characterization of intracra-nial tumors by means of texture analysis.Magn Reson Imaging
1993;11:889 –96
9. Eliat PA, Olivie D, Saikali S, et al.Can dynamic contrast-enhanced magnetic resonance imaging combined with texture analysis differ-entiate malignant glioneuronal tumors from other glioblastoma?
Neurol Res Int2012;2012:195176
10. Lerski RA, Straughan K, Schad LR, et al. MR image texture analysis–an approach to tissue characterization.Magn Reson Imag-ing1993;11:873– 87
11. Kassner A, Thornhill RE.Texture analysis: a review of neurologic MR imaging applications.AJNR Am J Neuroradiol2010;31:809 –16 12. Herlidou-Meˆme S, Constans JM, Carsin B, et al.MRI texture analysis
on texture test objects, normal brain and intracranial tumors.Magn Reson Imaging2003;21:989 –93
13. Assefa D, Keller H, Menard C, et al.Robust texture features for re-sponse monitoring of glioblastoma multiforme on T1-weighted
and T2-FLAIR MR images: a preliminary investigation in terms of identification and segmentation.Med Phys2010;37:1722–36 14. Drabycz S, Roldan G, de Robles P, et al.An analysis of image texture,
tumor location, and MGMT promoter methylation in glioblastoma using magnetic resonance imaging.Neuroimage2010;49:1398 – 405 15. Choi KY, Jung TY, Jung S, et al.Prognosis of oligodendroglial tumor with ring enhancement showing central necrotic portion.J Neu-rooncol2011;103:103–10
16. Jenkinson MD, Smith TS, Brodbelt AR, et al.Apparent diffusion coefficients in oligodendroglial tumors characterized by genotype.
J Magn Reson Imaging2007;26:1405–12
17. Brown R, Zlatescu M, Sijben A, et al.The use of magnetic resonance imaging to noninvasively detect genetic signatures in oligodendro-glioma.Clin Cancer Res2008;14:2357– 62
18. Leary SE, Olson JM. The molecular classification of medullo-blastoma: driving the next generation clinical trials.Curr Opin Pe-diatr2012;24:33–39
19. Gajjar A, Hernan R, Kocak M, et al.Clinical, histopathologic, and molecular markers of prognosis: toward a new disease risk stratifi-cation system for medulloblastoma.J Clin Oncol2004;22:984 –93 20. Gibson P, Tong Y, Robinson G, et al.Subtypes of medulloblastoma
have distinct developmental origins.Nature2010;468:1095–99 21. Hoisak JD, Koh E-S, Yu E, et al.An image similarity-guided
corre-spondence correction for voxel-wise analysis applied to MR imag-ing of glioblastoma multiforme acquired pre- and post-chemora-diotherapy. In: Proceedings of the 18th Annual Meeting of the International Society for Magnetic Resonance in Medicine, Stockholm, Sweden. May 1–7, 2010
22. Luts J, Heerschap A, Suykens JA, et al.A combined MRI and MRSI based multiclass system for brain tumour recognition using LS-SVMs with class probabilities and feature selection.Artif Intell Med
2007;40:87–102
23. Haralick RM.Statistical and structural approaches to texture. Pro-ceedings of the IEEE1979;67:786 – 804
24. Wang Z, Sutton LN, Cnaan A, et al.Proton MR spectroscopy of pediatric cerebellar tumors. AJNR Am J Neuroradiol 1995;16: 1821–33
25. Davies NP, Wilson M, Harris LM, et al.Identification and character-isation of childhood cerebellar tumours by in vivo proton MRS.
NMR Biomed2008;21:908 –18
26. Vicente J, Fuster-Garcia E, Tortajada S, et al.Accurate classification of childhood brain tumours by in vivo (1)H MRS: a multi-centre study.Eur J Cancer2013;49:658 – 67
27. Freund Y, Schapire RE.A decisitheoretic generalization of on-line learning and an application to boosting.Journal of Computer and System Sciences1997;55:119 –39
28. Tang XO.Texture information in run-length matrices.IEEE Trans Image Process1998;7:1602– 09