D
-Phenylglycinium bromide
Mohanadoss Parthasarathy,aKannan Arun Kumarband Rengasamy Gopalakrishnana*
a
Crystal Research Laboratory, Department of Physics, Anna University, Chennai 600 025, India, andbDepartment of Chemistry, Loyola College (Autonomous), Chennai 600 034, India
Correspondence e-mail: [email protected]
Received 30 January 2013; accepted 19 February 2013
Key indicators: single-crystal X-ray study;T= 295 K; mean(C–C) = 0.003 A˚; Rfactor = 0.022;wRfactor = 0.046; data-to-parameter ratio = 19.0.
In the crystal of the title salt, C8H10NO2+Br
, the bromide anions and the phenylglycinium cations are linked through N—H Br, O—H Br and C—H O hydrogen bonds, generating sheets lying parallel to (001).
Related literature
For a similar compound with a different halogen anion, see: Ravichandran et al.(1998). For related structures and back-ground, see: Srinivasan et al.(2001); Bouchouit et al.(2004); Ramaswamyet al.(2001); Bouacidaet al.(2006); Thomsenet al.(1994). For biological importance, see: Satyamet al.(1996); Jayasinghe et al.(1994); Chun et al.(2010); Thomas & West (2011).
Experimental Crystal data
C8H10NO2+Br
Mr= 232.08
Orthorhombic,P212121
a= 5.5240 (5) A˚ b= 7.4735 (5) A˚ c= 23.1229 (18) A˚
V= 954.60 (13) A˚3 Z= 4
MoKradiation = 4.27 mm1
T= 295 K
0.350.300.25 mm
Data collection
Bruker Kappa APEXII CCD diffractometer
Absorption correction: multi-scan (SADABS; Bruker, 2004) T = 0.317,T = 0.415
5824 measured reflections 2170 independent reflections 2003 reflections withI> 2(I) Rint= 0.022
Refinement
R[F2> 2(F2)] = 0.022 wR(F2) = 0.046
S= 1.03 2170 reflections 114 parameters
H-atom parameters constrained
max= 0.25 e A˚3
min=0.29 e A˚3
Absolute structure: Flack (1983) Flack parameter: 0.011 (8)
Table 1
Hydrogen-bond geometry (A˚ ,).
D—H A D—H H A D A D—H A
N1—H1B Br1i 0.89 2.54 3.3586 (17) 154 N1—H1C Br1ii
0.89 2.57 3.429 (2) 163 N1—H1A Br1 0.89 2.45 3.3166 (18) 164 O1—H1D Br1iii 0.82 2.39 3.2027 (17) 171 C7—H7 O2iv
0.98 2.59 3.527 (3) 159
Symmetry codes: (i) xþ1;y1 2;zþ
3
2; (ii) x1;y;z; (iii) x1;y1;z; (iv) xþ1;y;z.
Data collection:APEX2(Bruker, 2004); cell refinement:APEX2
and SAINT (Bruker, 2004); data reduction: SAINT and XPREP
(Bruker, 2004); program(s) used to solve structure:SIR92(Altomare
et al., 1993); program(s) used to refine structure:SHELXL97 (Shel-drick, 2008); molecular graphics:ORTEP-3 for Windows(Farrugia, 2012) andMercury(Macraeet al., 2008); software used to prepare material for publication:PLATON(Spek, 2009).
The authors are grateful to Professor K. Sivakumar, Department of Physics, Anna University, Chennai-25, for fruitful scientific discussions. The authors are thankful to the SAIF, IIT Madras, Chennai-36, India, for the X-ray data collection.
Supplementary data and figures for this paper are available from the IUCr electronic archives (Reference: PK2465).
References
Altomare, A., Cascarano, G., Giacovazzo, C. & Guagliardi, A. (1993).J. Appl. Cryst.26, 343–350.
Bouacida, S., Merazig, H. & Benard-Rocherulle, P. (2006).Acta Cryst.E62, o838–o840.
Bouchouit, K., Bendheif, L. & Benali-Cherif, N. (2004).Acta Cryst.E60, o272– o274.
Bruker (2004).SADABS,APEX2,SAINTandXPREP. Bruker AXS Inc., Madison, Wisconsin, USA.
Chun, L. W., Yang, B. F., Hsiao, H. L., Tung, H. T., Ming, C. T. & Hui, P. W. (2010).J. Biomed. Sci.17, 71–78.
Farrugia, L. J. (2012).J. Appl. Cryst.45, 849–854. Flack, H. D. (1983).Acta Cryst.A39, 876–881.
Jayasinghe, L. R., Datta, A., Ali, S. M., Zymunt, J., Van der Velde, D. G. & Georg, G. I. (1994).J. Med. Chem.37, 2981–2984.
Macrae, C. F., Bruno, I. J., Chisholm, J. A., Edgington, P. R., McCabe, P., Pidcock, E., Rodriguez-Monge, L., Taylor, R., van de Streek, J. & Wood, P. A. (2008).J. Appl. Cryst.41, 466–470.
Ramaswamy, S., Sridhar, B., Ramakrishnan, V. & Rajaram, R. K. (2001).Acta Cryst.E57, o1149–o1151.
Ravichandran, S., Dattagupta, J. K. & Chakrabarti, C. (1998).Acta Cryst.C54, 499–501.
Satyam, A., Hocker, M. D., Kanemaguire, K. A., Morgan, A. S., Villar, H. O. & Lyttle, M. H. (1996).J. Med. Chem.39, 1736–1747.
Sheldrick, G. M. (2008).Acta Cryst.A64, 112–122. Spek, A. L. (2009).Acta Cryst.D65, 148–155.
Srinivasan, N., Sridhar, B. & Rajaram, R. K. (2001).Acta Cryst.E57, o754– o756.
Thomas, G. & West, G. B. (2011).J. Pharm. Pharmacol.26, 151–152. Thomsen, C., Boel, E. & Suzdak, P. D. (1994).Eur. J. Pharmacol.267, 77–84. Acta Crystallographica Section E
Structure Reports Online
supporting information
Acta Cryst. (2013). E69, o470 [doi:10.1107/S1600536813004807]
D
-Phenylglycinium bromide
Mohanadoss Parthasarathy, Kannan Arun Kumar and Rengasamy Gopalakrishnan
S1. Comment
D-Phenylglycine is an important constituent in the production of semisynthetic penicillins and cephalosporins. Recently
the usages of some phenylglycine derivatives in the synthesis of antitumor drugs and other pharmacological applications
have been found to be increasing (Satyam et al., 1996; Jayasinghe et al., 1994). Phenylglycine has been reported as a
delivery tool for improving l-dopa absorption (Chun et al., 2010) and also found to have anti-inflammatory activity
(Thomas et al., 2011). The torsion angle N1-C7-C8-O1, which indicates the relative orientation of the carboxyl group and
the amino N atom, is 15.5 (3)° and close to the corresponding value of 18.9°(5) reported for D-Phenylglycine
Hydro-chloride (Ravichandran et al., 1998). The orientation of the phenyl ring as described by the torsion angle C5—C6—C7—
N1 is 130.05 (3)°. The intermolecular interaction between the molecular ions are primarly decided by hydrogen bonding.
The hydrogen bonds N1—H1A···Br1, N1—H1B···Br1i [Symmetry code: (i) -x+1, y-1/2, -z+3/2], N1—H1C···Br1ii
[Symmetry code: (ii) x-1, y, z] and O1—H1D···Br1iii [Symmetry code: (iii) x-1, y-1, z] and C7—H7···O2iv [Symmetry
code: (iv) x-1, y-1, z] hydrogen bond interconnects the molecular ions to form an extensive two-dimensional molecular
sheet parallel to (001) plane. Parallel stacking of these sheets along [0 0 1] direction constitute the molecular packing of
the crystal.
S2. Experimental
The title compound (I), was prepared by mixing a 1:1 ratio of D-Phenylglycine and hydrobromic acid in water solvent.
The suitable single-crystal of the compound was selected for X-ray analysis from the above solution by slow evaporation
method.
S3. Refinement
The hydrogen atoms associated with C atoms were identified from the difference electron density peaks and subsequently
treated as riding atoms with distances of d(C–H) = 0.98 Å (for CH) with Uiso(H) = -1.5Ueq(C) and d(C–H) = 0.93 Å (for
aromatic CH) with Uiso(H) = 1.2Ueq(C). The carboxylic acid hydrogen was constrained to a distance of d(O–H) = 0.82 Å
Figure 1
Displacement ellipsoid plot of the molecular structure drawn at the 40% probability level.
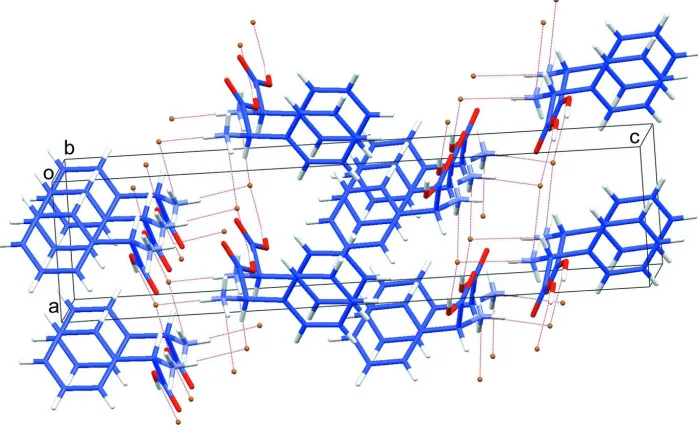
Figure 2
Part of the crystal structure showing the two dimensional anionic-cationic (0 0 1) sheet formed through N—H···Br, O—
[image:3.610.131.480.385.600.2]D-Phenylglycinium bromide
Crystal data
C8H10NO2+·Br− Mr = 232.08
Orthorhombic, P212121 Hall symbol: P 2ac 2ab a = 5.5240 (5) Å b = 7.4735 (5) Å c = 23.1229 (18) Å V = 954.60 (13) Å3 Z = 4
F(000) = 464 Dx = 1.615 Mg m−3
Mo Kα radiation, λ = 0.71073 Å Cell parameters from 3239 reflections θ = 2.6–28.8°
µ = 4.27 mm−1 T = 295 K Block, colourless 0.35 × 0.30 × 0.25 mm
Data collection
Bruker Kappa APEXII CCD diffractometer
Radiation source: fine-focus sealed tube Graphite monochromator
ω and φ scan
Absorption correction: multi-scan (SADABS; Bruker, 2004) Tmin = 0.317, Tmax = 0.415
5824 measured reflections 2170 independent reflections 2003 reflections with I > 2σ(I) Rint = 0.022
θmax = 27.5°, θmin = 3.3° h = −6→7
k = −9→5 l = −28→30
Refinement
Refinement on F2 Least-squares matrix: full R[F2 > 2σ(F2)] = 0.022 wR(F2) = 0.046 S = 1.03 2170 reflections 114 parameters 0 restraints
Primary atom site location: structure-invariant direct methods
Secondary atom site location: difference Fourier map
Hydrogen site location: inferred from neighbouring sites
H-atom parameters constrained w = 1/[σ2(F
o2)] (Δ/σ)max = 0.003 Δρmax = 0.25 e Å−3 Δρmin = −0.29 e Å−3
Extinction correction: SHELXL97 (Sheldrick, 2008), Fc*=kFc[1+0.001xFc2λ3/sin(2θ)]-1/4 Extinction coefficient: 0.0530 (13)
Absolute structure: Flack (1983) Absolute structure parameter: 0.011 (8)
Special details
Geometry. All e.s.d.'s (except the e.s.d. in the dihedral angle between two l.s. planes) are estimated using the full covariance matrix. The cell e.s.d.'s are taken into account individually in the estimation of e.s.d.'s in distances, angles and torsion angles; correlations between e.s.d.'s in cell parameters are only used when they are defined by crystal symmetry. An approximate (isotropic) treatment of cell e.s.d.'s is used for estimating e.s.d.'s involving l.s. planes.
Refinement. Refinement of F2 against ALL reflections. The weighted R-factor wR and goodness of fit S are based on F2, conventional R-factors R are based on F, with F set to zero for negative F2. The threshold expression of F2 > σ(F2) is used only for calculating R-factors(gt) etc. and is not relevant to the choice of reflections for refinement. R-factors based on F2 are statistically about twice as large as those based on F, and R- factors based on ALL data will be even larger.
Fractional atomic coordinates and isotropic or equivalent isotropic displacement parameters (Å2)
x y z Uiso*/Ueq
C1 0.1060 (5) 0.5444 (3) 0.56980 (9) 0.0370 (5)
H1 −0.0251 0.5884 0.5906 0.044*
H2 −0.0006 0.6372 0.4921 0.050*
C3 0.3119 (5) 0.5092 (3) 0.47991 (9) 0.0424 (6)
H3 0.3196 0.5290 0.4402 0.051*
C4 0.4922 (5) 0.4160 (3) 0.50678 (9) 0.0443 (6)
H4 0.6229 0.3734 0.4855 0.053*
C5 0.4804 (4) 0.3849 (3) 0.56595 (9) 0.0355 (5)
H5 0.6024 0.3204 0.5842 0.043*
C6 0.2866 (4) 0.4500 (2) 0.59770 (7) 0.0264 (4)
C7 0.2695 (4) 0.4057 (2) 0.66152 (7) 0.0282 (5)
H7 0.4217 0.3499 0.6738 0.034*
C8 0.0650 (4) 0.2773 (3) 0.67328 (8) 0.0311 (5)
N1 0.2266 (4) 0.5687 (2) 0.69772 (6) 0.0345 (4)
H1A 0.3369 0.6514 0.6892 0.063 (8)*
H1B 0.2379 0.5399 0.7350 0.063 (8)*
H1C 0.0794 0.6117 0.6905 0.047 (7)*
O1 0.1199 (4) 0.1163 (2) 0.65347 (8) 0.0561 (5)
H1D 0.0051 0.0486 0.6586 0.084*
O2 −0.1206 (3) 0.3164 (2) 0.69632 (6) 0.0441 (4)
Br1 0.71415 (4) 0.82278 (3) 0.681529 (8) 0.03843 (9)
Atomic displacement parameters (Å2)
U11 U22 U33 U12 U13 U23
C1 0.0381 (14) 0.0388 (11) 0.0339 (11) 0.0062 (12) 0.0048 (10) −0.0032 (10) C2 0.0552 (17) 0.0342 (12) 0.0360 (12) 0.0066 (11) −0.0030 (11) 0.0072 (10) C3 0.0638 (18) 0.0364 (12) 0.0270 (10) −0.0101 (13) 0.0087 (11) 0.0010 (9) C4 0.0417 (16) 0.0496 (14) 0.0415 (14) −0.0021 (12) 0.0170 (11) −0.0082 (11) C5 0.0277 (13) 0.0429 (12) 0.0360 (12) 0.0004 (11) 0.0035 (9) −0.0027 (10) C6 0.0261 (11) 0.0258 (9) 0.0273 (9) −0.0062 (10) 0.0011 (9) −0.0013 (7) C7 0.0261 (13) 0.0316 (10) 0.0269 (9) −0.0034 (10) 0.0012 (8) 0.0002 (7) C8 0.0352 (14) 0.0323 (11) 0.0258 (11) −0.0071 (10) −0.0018 (9) 0.0014 (8) N1 0.0377 (13) 0.0396 (9) 0.0262 (9) −0.0137 (10) 0.0029 (8) −0.0036 (7) O1 0.0634 (15) 0.0333 (8) 0.0715 (12) −0.0161 (9) 0.0238 (10) −0.0057 (8) O2 0.0328 (9) 0.0448 (9) 0.0547 (9) −0.0106 (9) 0.0085 (7) −0.0021 (8) Br1 0.04061 (14) 0.03701 (12) 0.03766 (12) −0.01269 (10) 0.00446 (10) −0.00279 (9)
Geometric parameters (Å, º)
C1—C6 1.382 (3) C6—C7 1.515 (2)
C1—C2 1.383 (3) C7—N1 1.497 (2)
C1—H1 0.9300 C7—C8 1.507 (3)
C2—C3 1.361 (3) C7—H7 0.9800
C2—H2 0.9300 C8—O2 1.192 (3)
C3—C4 1.365 (3) C8—O1 1.323 (3)
C3—H3 0.9300 N1—H1A 0.8900
C4—C5 1.389 (3) N1—H1B 0.8900
C4—H4 0.9300 N1—H1C 0.8900
C5—H5 0.9300
C6—C1—C2 119.8 (2) C5—C6—C7 119.15 (19)
C6—C1—H1 120.1 N1—C7—C8 107.37 (17)
C2—C1—H1 120.1 N1—C7—C6 112.12 (15)
C3—C2—C1 120.6 (2) C8—C7—C6 111.19 (16)
C3—C2—H2 119.7 N1—C7—H7 108.7
C1—C2—H2 119.7 C8—C7—H7 108.7
C2—C3—C4 120.4 (2) C6—C7—H7 108.7
C2—C3—H3 119.8 O2—C8—O1 125.1 (2)
C4—C3—H3 119.8 O2—C8—C7 124.73 (19)
C3—C4—C5 120.0 (2) O1—C8—C7 110.16 (19)
C3—C4—H4 120.0 C7—N1—H1A 109.5
C5—C4—H4 120.0 C7—N1—H1B 109.5
C6—C5—C4 119.9 (2) H1A—N1—H1B 109.5
C6—C5—H5 120.0 C7—N1—H1C 109.5
C4—C5—H5 120.0 H1A—N1—H1C 109.5
C1—C6—C5 119.30 (19) H1B—N1—H1C 109.5
C1—C6—C7 121.4 (2) C8—O1—H1D 109.5
C6—C1—C2—C3 0.2 (4) C1—C6—C7—N1 −54.0 (3)
C1—C2—C3—C4 −0.3 (4) C5—C6—C7—N1 130.1 (2)
C2—C3—C4—C5 0.5 (4) C1—C6—C7—C8 66.2 (2)
C3—C4—C5—C6 −0.6 (3) C5—C6—C7—C8 −109.7 (2)
C2—C1—C6—C5 −0.2 (3) N1—C7—C8—O2 15.6 (3)
C2—C1—C6—C7 −176.2 (2) C6—C7—C8—O2 −107.4 (2)
C4—C5—C6—C1 0.5 (3) N1—C7—C8—O1 −165.48 (17)
C4—C5—C6—C7 176.5 (2) C6—C7—C8—O1 71.5 (2)
Hydrogen-bond geometry (Å, º)
D—H···A D—H H···A D···A D—H···A
N1—H1B···Br1i 0.89 2.54 3.3586 (17) 154
N1—H1C···Br1ii 0.89 2.57 3.429 (2) 163
N1—H1A···Br1 0.89 2.45 3.3166 (18) 164
O1—H1D···Br1iii 0.82 2.39 3.2027 (17) 171
C7—H7···O2iv 0.98 2.59 3.527 (3) 159