ISSN Online: 2327-509X ISSN Print: 2327-5081
DOI: 10.4236/jbm.2019.75007 May 17, 2019 34 Journal of Biosciences and Medicines
Foot Loading Pattern Variations between
Normal Weight, Overweight, and Obese
Adults Aged 24 to 50 Years
Suhad K. R. Al-Magsoosi, Albert K. Chong
University of Southern Queensland West Street, Toowoomba QLD, Australia
Abstract
Recently, health problems related to weight gain and obesity have increased in all age groups, especially adults. Overweight and obese adults are associ-ated with psychological, metabolic and musculoskeletal problems. The aim of this study was to examine foot-loading characteristics during gait of nor-mal-weight; overweight and obese adults aged 25 - 46 years. Methods: This paper outlined tests that were performed on 30 feet of 15 participants. The subjects were gathered in three groups according to their body mass index values, each containing five study participants: five healthy weights (age 35.4 ± 6.3 yrs, BMI 21.9 ± 1.3 kg /m2) matched to five overweight (age 39.2 ± 6.1 yrs,
BMI 27.5 ± 1.34 kg /m2); and five obese adults (age 36.5 ± 7.8 yrs, BMI 34.5 ±
10.3 kg /m2. The measurements were compared between these groups and the
correlation of body mass index with the foot plantar pressure parameters was assessed. Results: The foot pressure measure in the obese group was greater under the metatarsal heads and the heel of the foot compared to the healthy weight group. Moreover, there were rises in pressure beneath the H, MF, second metatarsal and third metatarsal regions of the foot. It may be consid-ered that in obese individuals, this variation resulted from greater weakness in the ligaments of the foot. As results, the obese group may suffer from dis-comfort in their feet. The choice of the footwear may depend on the gait and the resulting pain. In addition, they may be less likely to take part in walking or other activities. Therefore, further studies related to these issues, would be advisable. Conclusion: especially, the feet of obese individuals vary from those healthy and overweight adults, because obese subjects’ feet are wider. In the obese was established the greatest foot pressure measure increases beneath the heel of the foot and the metatarsal heads.
Keywords
An Advanced Foot Pressure Sensor, Gait, Overweight and Obesity, How to cite this paper: Al-Magsoosi,
S.K.R. and Chong, A.K. (2019) Foot Load-ing Pattern Variations between Normal Weight, Overweight, and Obese Adults Aged 24 to 50 Years. Journal of Biosciences and Medicines, 7, 34-49.
https://doi.org/10.4236/jbm.2019.75007
DOI: 10.4236/jbm.2019.75007 35 Journal of Biosciences and Medicines Foot Plantar, Body Mass Index
1. Introduction
In the 21st century, the increasing number of overweight and obese adults has become a significant public health concern worldwide, which is associated with both increasing health care cost and disability [1] [2]. In 2016, Excess weight and obese adults are major clinical and public health problems worldwide. The esti-mated total numbers of more than 1.9 billion adults, 18 years and older, were overweight. Of these over 650 million were obese. 41 million children under the age of five were overweight or obese and over 340 million children and adoles-cents aged 5 - 19-years-old were overweight or obese in the same period [3]. Healthcare experts and physicians have commonly utilized the body mass index (BMI) scale to define overweight and obesity [4]. BMI (kg/m2) is calculated by
dividing weight in kilograms (kg) by the square of the height (length) in meters (m) [5], [3] as described in Equation 1.
DOI: 10.4236/jbm.2019.75007 36 Journal of Biosciences and Medicines obese individuals. Many studies examining this point have been carried out [17] [18] [19] [20]. However, fewer studies have compared the plantar pressures of obese individuals and non-obese individuals [9] [16] [21]. Moreover, we could find no study comparing the plantar pressures of normal weight, overweight and obese individuals as separate groups during the literature review. For this reason, we do not have sufficient information about the difference between the groups in terms of plantar pressures using the insole system, and if the pressure in-creases in parallel with the level of obesity. From this point, in this paper, the purpose of the study is to assess dynamic foot plantar pressure characteristics in adults, who were normal weight, overweight and obese, during level walking us-ing the insole pressure system, and then to compare those values (findus-ings) with those of a healthy control group.
2. Methods
We designed our research to allow the independent variable to be body mass in-dex. The dependent variables were measures of plantar pressure (pressure time integral, peak pressure, pressure contact area and average pressure) over ten re-gions of the foot namely: (heel (H), midfoot (MF), first metatarsal head (1 MH), second metatarsal head (2 MH), third metatarsal head (3 MH), fourth metatarsal head (4 MH), five metatarsal head (5 MH), hallux (1stT), second toe (2ndT), and three to five toes (3rd-5thT) (Figure 1), using F-Scan software (Version 6.70-03, Tekscan, Boston, MA).
2.1. Test Subjects
In 2018, the research proposal was accepted by the Research Ethics Committee (proposal number: (H18REA065). All participants signed an informed consent form to participate voluntarily in the study.
[image:3.595.212.541.586.709.2]Fifteen adult males’ participants recruited in this study; the participants were aged between to 29 - 50 years. Adults were excluded from participation in the study if they disclosed a history of orthopaedic problems, any disturbance of balance, musculoskeletal dysfunction or any difficulties in independent locomo-tion neurological and/or musculoskeletal problems likely to affect their gait. According to the body mass index (BMI) were divided participants into three
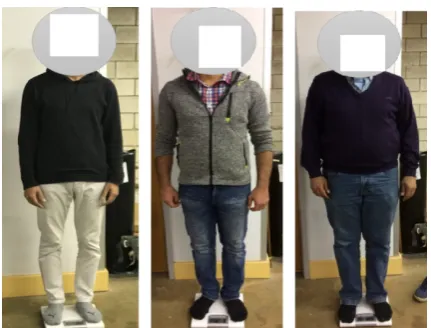
DOI: 10.4236/jbm.2019.75007 37 Journal of Biosciences and Medicines categories: healthy weight (BMI < 25), overweight (25 < BMI < 30), and obese (BMI > 30) as displayed in (Figure 2); which following similar protocols to those used with children and adults, described by [22]; [9] to obtain three groups for comparison.
[image:4.595.266.482.428.592.2]The participants were divided into three categories namely for a healthy weight, overweight, and obese group. Participant demographics are presented in Table 1.
2.2. Instruments
Plantar pressure measures were recorded using the Tekscan in-shoe pressure system (Tekscan, Boston, MA). This system comprises a wireless transmitter and two sensor cuffs. The in-shoe sensor F-ScanR 3000E standard was utilized. These sensors were approximately (15 mm) thick and comprised 960 sensing elements. A sampling rate of 100 Hz was utilized for all trials. All data were collected and processed using the F-Scan Version 6 research software. All walking trials were completed.
2.3. Foot Pressures
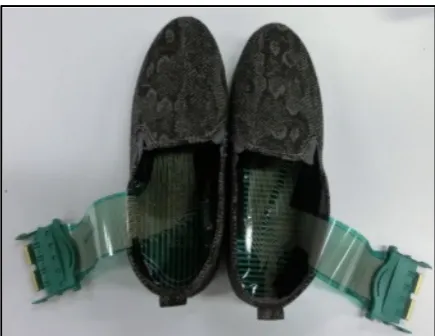
Protocols for the assessment of plantar pressures in adults previously used in our laboratory were the three-step method wearing the in-sole sensor (Figure 3). The in-sole sensor is becoming increasingly, popular in both research and clini-cal tools for pressure measurement and force data during dynamic movements, such as evaluating the foot plantar pressure of humans worldwide [23] [24].
[image:4.595.205.539.645.729.2]Figure 2. The foot pressure sensor system set-up.
Table 1. Participant demographics.
Group N Age (years) Height (m) Weight (kg) BMI (kg/m
2)
Mean SD Mean SD Mean SD Mean SD
Healthy 5 35.40 6.35 1.78 0.09 69.42 7.48 21.88 1.26
Over-weight 5 36.20 4.76 1.68 0.05 76.12 6.61 26.82 1.60
DOI: 10.4236/jbm.2019.75007 38 Journal of Biosciences and Medicines Figure 3. The in-shoe pressure system (Pressure sensor).
All participants were asked to walk along a five-meter walkway with the foot pressure insole system that was attached to the participants’ shoes. Participants were instructed to familiarize themselves with the test using the pressure sensing system, thus ensuring that they were comfortable with the procedure. Partici-pants were encouraged to adopt a natural gait pattern and to walk at a self-selected speed. Three trials of the gait were recorded for each participant.
2.4. Statistical Evaluation of Foot Pressures
We designed our research to allow the independent variable to be the body mass index. The statistical procedures were conducted using the SPSS software (v.25; SPSS Inc, Chicago, IL, USA). The mean of the three repetitions of each subject was computed and all the statistical procedures were performed with these mean values. All data were analysed using statistical software (SPSS version 25.0). Sta-tistical significance was accepted at the p < 0.01 level of confidence. The mean of the three repetitions of each subject was computed and all the statistical proce-dures were performed with these mean ± SD values, and presented in the format mean (standard deviation). A one-way Analysis of Variance (ANOVA) was used to test for significant differences in plantar loading measure across the obese, overweight and normal weight groups.
3. Results
The three groups (five people in each group) of adult male participants were re-cruited into the study. Division of these groups was based on participants’ body mass and BMI: normal weight, overweight and obese. The participants were aged between 25 and 46 years, and the BMI value obtained for obese adults (32.9 kg/m2) was significantly higher (p ≤ 0.001) than that of the healthy group (21.88
kg/m2). To study the effect of differences in body mass of adults on plantar
DOI: 10.4236/jbm.2019.75007 39 Journal of Biosciences and Medicines
3.1. Force and Contact Area Measurements
Descriptive data for force (F, kg) and contact area (CA, cm2) were shown in
Ap-pendix Table A1. There was a statistically significant variation (P-values < 0.001) for the force measure (F). The lower differences in mean F measure value were located at the 3rd-5thT and 2ndT between the normal weight and over-weight adults for which the value for F was (0.63) and (1.45) respectively. The mean F measure values were higher for the overweight group compared with the healthy group: which were (7.13 kg) to (5.54 kg), respectively.
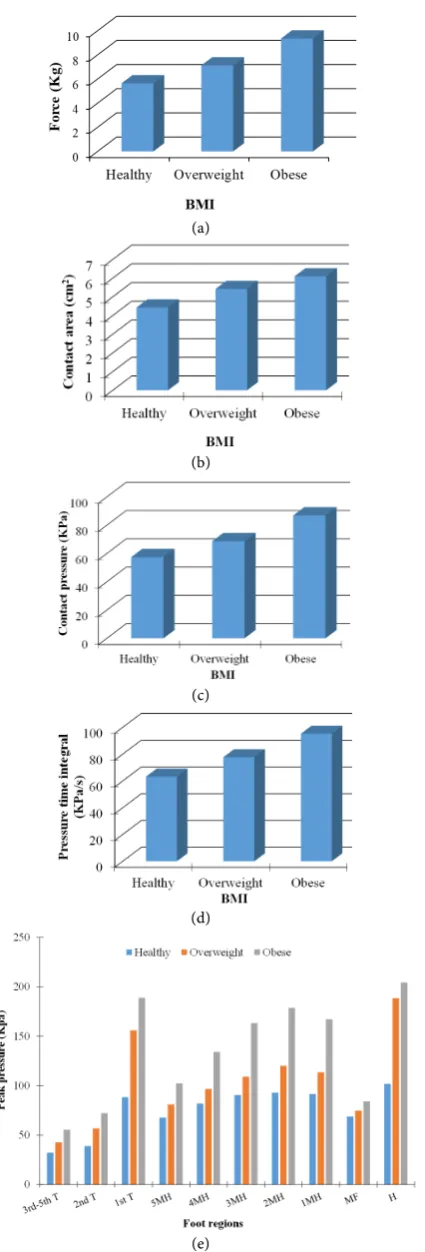
Statistically significant differences were found between the obese adults group and normal weight adults group in the following regions with mean values for F measure (P-values < 0.001) at the H (30.67 kg), 1 MH (14.54 kg) followed by 1stT and 2 MH (10.55 and 10.00 kg) respectively. In contrast, the mean values of the F variable in the obese group were approximately twice that under the 1 MH (14.54 kg), 1stT (10.55 kg) and 2 MH (10.00 kg) in contrast with the control (healthy) group with values (7.18, 4.62 and 5.05 kg) at the same foot area. A higher correction (r = 0.99) was observed between the average values of the F measure and body mass index for these three groups, as shown in (Figure 4(a)).
Illustrative data for CA (cm2) in the adults who were obese, overweight and
normal weight is seen in Appendix Table A1. In general, there were statistically significant differences (P-values < 0.001) for the CA. The lower differences for the CA measure was located at the 3rd-5thT and 2ndT between the normal weight and overweight adults for which the values for CA were (0.74 cm2) and
(1.17 cm2), respectively. The higher CA value was found to be within the
over-weight group compared with the healthy group.
The overweight group showed greater CA than the normal weight adults of the same age, these differences were located beneath the H (16.53 cm2), 1 MH
(7.20 cm2), MF (4.90 cm2) followed by 2 MH (4.23 cm2) and 3 MH (4.06 cm2),
regions. The obese groups had a higher foot CA values in comparison with the control group, under the H, 1 MH and MF regions with the value (17.88, 9.41 and 7.88 cm2), respectively. Thus, all values were higher within the obese group.
Figure 4(b) presents the relationships detected between the CA measurements within these three groups, displaying a strong regression coefficient (r = 0.94).
3.2. Contact Pressure and Pressure-Time Integrals
A consistent increase of the overall foot loading data for contact pressure (CP, kPa) and temporal characteristics of foot loading pressure-time integrals (PTI, KPa/s) for the groups are summarised, as shown in Appendix Table A2. There were significant differences between all three groups in CP and PTI measures which were observed at (P-values < 0.001).
DOI: 10.4236/jbm.2019.75007 40 Journal of Biosciences and Medicines (a)
(b)
(c)
(d)
[image:7.595.272.485.65.692.2](e)
DOI: 10.4236/jbm.2019.75007 41 Journal of Biosciences and Medicines (85.58 KPa) which was approximately twice the under the same region in the healthy group with a mean of (42.86 KPa). In addition, the obese group pre-sented roughly twice the value under the 1stT zone with a mean value (103.84 KPa) compared with the control group (55.38 KPa).
There were slight differences between the overweight and normal weight groups for CP located at H (98.98 KPa), 2 MH (84.67 KPa), 1stT (83.82 KPa) and 3 MH (80.68 KPa), in the normal group the CP values were (90.20, 69.98, 55.38 and 68.14 KPa) respectively under the same foot area. On the other hand, the lowest CP value was observed within 3rd-5thT and 2ndT regions with the mean value for overweight (37.65 and 42.11KPa) and healthy groups (26.32 and 30.89 KPa). The greatest correlation (r = 99) between the CP measure value and BMI was observed within these three groups as shown in (Figure 4(c)).
Elevated pressure-time integrals (PTI) were attributed to the smallest level of probability (Duncan test) for the PTI for these groups. The normal weight group was (66.93) followed by the overweight (84. 50) and the obese group (89.28). The results show higher PTI value underneath the H, 1stT, 2 MH and 3 MH in the obese group (P-values < 0.001) compared with the control group. The obese group had mean values under the H, 1stT, 2 MH and 3 MH regions (123.24, 116.63, 109.65, 100.02 KPa), respectively.
The overweight group PTI also was higher compared with the control group beneath the H, 2 MH, and 1stT regions; with the mean values of (116.00, 93.64, and 90.81 KPa) receptively. On the other hand, the lowest region within this PTI measure was absorbed under 3rd-5thT (58.76, 37.04 KPa) for both groups (P-values < 0.01) compared with the normal weight (25.92 KPa) group, as shown in Appendix Table A2. It was observed that there was a higher regression coeffi-cient between mean value PTI measures within the three groups, as presented in (Figure 4(d)).
3.3. Peak Pressure
DOI: 10.4236/jbm.2019.75007 42 Journal of Biosciences and Medicines
4. Discussion
The experiment was designed to examine the effect of differences in body mass in adults aged between (25 and 46) years in the three groups (overweight, obese and healthy weight), on plantar pressure distribution characteristics by calculat-ing clinical foot measurements (F, CA, CP, PP and PTI) in ten different foot re-gions during gait. The findings identified that those who were overweight dis-played marked differences in foot loading when compared with adults of healthy weight. Overweight adults generated significantly greater F and CA in the MF and 2 MH - 5 MH regions of the foot; a trend that was similar for the obese adults. Overweight adults also generated increased CP and PTI under the MF and 2nd-5th MH. A similar trend that the obese adults with significant differ-ences also found at the heel in comparison with normal weight adults.Plantar foot pressure parameters such as peak pressure and contact pressure showed sta-tistically significant increases with increasing weight. This was observed with in-creasing volunteer BMI weight class. The outcomes give important objective knowledge regarding the functional limitations particular to foot mechanics in walking status.
struc-DOI: 10.4236/jbm.2019.75007 43 Journal of Biosciences and Medicines tural foot dysfunction, such as the collapse of the longitudinal arc, which espe-cially leads to an increased middle foot contact area [18].
4.1. Force and Contact Area
F values of the total foot were highest for the obese and overweight, and lowest for normal-weight adults, as presented in Figure 4(a). Changes in peak F data were largely eliminated owing to body mass. However, the findings at the Hand forefoot (specifically 2 MH and 3 MH and 1stT) for adults who are obese and overweight demonstrated increased loading at these sites. These results are con-sistent with previous [18] [20]. These findings have identified elevated levels of loading, in children who are obese at the plantar H, MF and 2 MH - 5 MH when compared with non-obese children. The outcomes for F, found by [28], corre-spond with those of this study. They found that H, MF and forefoot had the higher F value. The objective of the study undertaken by [27] was to determine the effects of overweight and obesity on plantar pressures generated by pre-school children during gait. They emphasized that higher stress made the feet of overweight/obese children vulnerable to bony fatigue and soft tissue damage due to higher forces over larger contact areas.
Figure 4(b) showed the remarkable main impact of obesity on dynamic CA. The higher foot CA in overweight and obese adults was compared with their normal-weight counterparts. The higher CA was measured in both groups under the H, MF, 1 MH, 2 MH, 3 MH anatomical regions. In this study, the higher CA within MF was confirmed by previous research [9] [33]. These studies empha-sized that the foot pressure distribution parameter power ratio value is greater for the diabetic foot than the normal foot [34]. This power ratio value decreases as the BMI increases because the total contact area increases due to exposure to higher loads, and does not depend on larger feet. Hence this study found sig-nificant variations in power ratio value in MF and the plantar ground contact area of overweight subjects compared with healthy subjects while standing be-cause plantar pressure increase begins from the MF in low grade obese subjects (i.e. overweight) due to an increase CA in MF. [28] outcomes for CA correspond with those of this study. They found H, MF and forefoot CA were higher in overweight and obesity compare to healthy children. The study contacted by [28] used children. It assessed plantar pressure in relation to overweight and obesity. They emphasized that increased contact area was not found to be suffi-cient to compensate for the high forces generated during walking, thus causing higher plantar pressure with increased stress.
accept-DOI: 10.4236/jbm.2019.75007 44 Journal of Biosciences and Medicines able to assume that the obese children displayed flattening of the medial longi-tudinal arch. In contrast, it is not yet clear why this flattening and, consequently, the rise in CA in the MF region occurs.
4.2. Contact Pressure and Pressure-Time Integrals
As described in the results section, overweight and obese adults have a higher value of CP at the H, 2 MH, 3 MH, 1 MH, 1stT and MF regions. These increased the CP consequences are compatible with [9]. [9] used a pressure distribution platform to asses plantar pressure in obese and healthy adults, when they were both standing and walking states.
They emphasized the reason for subjects to have excessive body weight. In this study, the CP was statistically significantly higher in the H, 2 MH, 3 MH, 1 MH, 1stT and MF regions. This result was dissimilar to the finding of [35] who found no significant alteration was observed in PP within both metatarsal head area and H area. [35] determined foot stability according to the results of plantar pressure and spontaneity balance in the normal group and in the obesity, group based on BMI, using a pressure distribution platform. They stressed the reason for participants having a reduction within the spontaneity balance index within the heel region of each of the categories obese and healthy. This is often thought to be a mechanism of compensating for the minimized heel balance within the contact area and foot pressure increasing to make amends for balance. PTI, also referred to as impulse, were found to be statistically higher beneath the H, 1stT, 2ndT, 3 MH, 1 MH and MF. PTI measured value provides information regard-ing the load distribution over time. The PTI outcomes for [28] correspond with those of this study. [28] found that the MF displayed significantly higher values. [28] was studied to establish the influences of both body conditions overweight and obesity on foot plantar pressures in pre-school children through gait. They found overweight/obese children have higher F, greater CA and higher stress and, in turn, vulnerability to bony fatigue and soft tissue deterioration.
In this study, the PTI was statistically significantly higher in 1 MH to 3 MH. This finding is similar to the finding of [36]. [36] investigated the in-shoe pres-sure differences in Caucasians and Indians. This variable is thought to be im-portant in the pathogenesis of skin lesions [37] [38].
4.3. Peak Pressure
DOI: 10.4236/jbm.2019.75007 45 Journal of Biosciences and Medicines are controlled. The PP outcomes from [28] correspond with those of this study. [28] found that the MF displayed a significantly higher value. In the present study, the PP was statistically significantly higher in the H, 1stT and metatarsal regions in particular (2 MH, 3 MH and 1 MH). This finding was similar to that of [20], who found that no significant change was observed in the forefoot and hind-foot peak pressure. The study by study was designed to examine the effects of obesity on dynamic plantar pressure distribution during walking for prepu-bescent children, using a plantar pressure plate system. They emphasized that higher plantar pressures in obese children will increase loading on the develop-ing foot and may result in foot discomfort and possibly deformity, which may increase the risk of injury. In this study, the highest PP was found under the H. These findings are supported by studies investigating foot function in children [39] [40] and adults [41] [42].
5. Conclusion
The current research has explained the differences in the groups in relation to plantar loading. Advanced insole foot pressure sensors have made the demon-stration of the effect of overweight on the ankle motion possible. Preliminary tests showed that the technique is practical for clinical study and clinical demon-stration. Further testing will be needed to demonstrate the suitability of the techniques for developing an indexing scheme for the study of ankle injury of obese people. Obese and overweight adults showed increases in heel and forefoot regions. In the obese set, the highest foot pressure measure increases were found under the heel of the foot and the metatarsal heads. Observing the changes in plantar pressure with increased BMI, it can be seen that BMI has a marked effect on the structure of the foot. In addition, participants with greater BMI reported suffering discomfort in the feet because of the increased pressure. Plantar heel pain seems to be a common problem. In this area, further study is warranted.
Conflicts of Interest
The authors declare no conflicts of interest regarding the publication of this paper.
References
[1] Sheffler, L.R., Bailey, S.N., Gunzler, D. and Chae, J. (2014) Effect of Body Mass In-dex on Hemiparetic Gait. PM & R, 6, 908-913.
https://doi.org/10.1016/j.pmrj.2014.03.012
[2] Anandacoomarasamy, A., Caterson, I., Sambrook, P., Fransen, M. and March, L. (2007) The Impact of Obesity on the Musculoskeletal System. Internal Medicine Journal, 37, A35.
[3] World Health Organization (2016) Obesity and Overweight.
http://www.who.int/news-room/fact-sheets/detail/obesity-and-overweight
DOI: 10.4236/jbm.2019.75007 46 Journal of Biosciences and Medicines Science, 108, 1-7. https://doi.org/10.4102/sajs.v108i5/6.907
[5] Jegede, J.A., Adegoke, B.O. and Olagbegi, O.M. (2017) Effects of a Twelve-Week Weight Reduction Exercise Programme on Selected Spatiotemporal Gait Parameters of Obese Individuals. Journal of Obesity, 2017.
https://doi.org/10.1155/2017/4193256
[6] Butterworth, P.A., Landorf, K.B., Smith, S.E. and Menz, H.B. (2012) The Association between Body Mass Index and Musculoskeletal Foot Disorders: A Systematic Re-view. Obesity Reviews, 13, 630-642.
https://doi.org/10.1111/j.1467-789X.2012.00996.x
[7] Mickle, K.J., Munro, B.J., Lord, S.R., Menz, H.B. and Steele, J.R. (2011) Gait, Balance and Plantar Pressures in Older People with Toe Deformities. Gait & Posture, 34, 347-351. https://doi.org/10.1016/j.gaitpost.2011.05.023
[8] Stuck, R.M., Sohn, M.W., Budiman-Mak, E., Lee, T.A. and Weiss, K.B. (2008) Charcot Arthropathy Risk Elevation in the Obese Diabetic Population. The Ameri-can Journal of Medicine, 121, 1008-1014.
https://doi.org/10.1016/j.amjmed.2008.06.038
[9] Hills, A.P., Hennig, E.M., McDonald, M. and Bar-Or, O. (2001) Plantar Pressure Differences between Obese and Non-Obese Adults: A Biomechanical Analysis. In-ternational Journal of Obesity, 25, 1674. https://doi.org/10.1038/sj.ijo.0801785
[10]Riddle, D.L., Pulisic, M., Pidcoe, P. and Johnson, R.E. (2003) Risk Factors for Plan-tar Fasciitis: A Matched Case-Control Study. JBJS, 85, 872-877.
https://doi.org/10.2106/00004623-200305000-00015
[11]Irving, D.B., Cook, J.L., Young, M.A. and Menz, H.B. (2007) Obesity and Pronated Foot Type May Increase the Risk of Chronic Plantar Heel Pain: A Matched Case-Control Study. BMC Musculoskeletal Disorders, 8, 41.
https://doi.org/10.1186/1471-2474-8-41
[12]Prichasuk, S. (1994) The Heel Pad in Plantar Heel Pain. The Journal of Bone and Joint Surgery: British Volume, 76, 140-142.
https://doi.org/10.1302/0301-620X.76B1.8300659
[13]Birrell, S.A. and Haslam, R.A. (2009) The Effect of Military Load Carriage on 3-D Lower Limb Kinematics and Spatiotemporal Parameters. Ergonomics, 52, 1298-1304. https://doi.org/10.1080/00140130903003115
[14]Smith, B., Roan, M. and Lee, M. (2010) The Effect of Evenly Distributed Load Car-rying on Lower Body Gait Dynamics for Normal Weight and Overweight Subjects. Gait & Posture, 32, 176-180. https://doi.org/10.1016/j.gaitpost.2010.04.007
[15]Gravante, G., Russo, G., Pomara, F. and Ridola, C. (2003) Comparison of Ground Reaction Forces between Obese and Control Young Adults during Quiet Standing on a Baropodometric Platform. Clinical Biomechanics, 18, 780-782.
https://doi.org/10.1016/S0268-0033(03)00123-2
[16]Birtane, M. and Tuna, H. (2004) The Evaluation of Plantar Pressure Distribution in Obese and Non-Obese Adults. Clinical Biomechanics, 19, 1055-1059.
https://doi.org/10.1016/j.clinbiomech.2004.07.008
[17]Deepashini, H., Omar, B., Paungmali, A., Amaramalar, N., Ohnmar, H. and Leo-nard, J. (2014) An Insight into the Plantar Pressure Distribution of the Foot in Clin-ical Practice: Narrative Review. Polish Annals of Medicine, 21, 51-56.
https://doi.org/10.1016/j.poamed.2014.03.003
DOI: 10.4236/jbm.2019.75007 47 Journal of Biosciences and Medicines [19]Hills, A.P., Hennig, E.M., Byrne, N.M. and Steele, J.R. (2002) The Biomechanics of
Adiposity-Structural and Functional Limitations of Obesity and Implications for Movement. Obesity Reviews, 3, 35-43.
https://doi.org/10.1046/j.1467-789X.2002.00054.x
[20]Yan, S.H., Zhang, K., Tan, G.Q., Yang, J. and Liu, Z.C. (2013) Effects of Obesity on Dynamic Plantar Pressure Distribution in Chinese Prepubescent Children during Walking. Gait & Posture, 37, 37-42. https://doi.org/10.1016/j.gaitpost.2012.05.018
[21]Butterworth, P.A., Urquhart, D.M., Landorf, K.B., Wluka, A.E., Cicuttini, F.M. and Menz, H.B. (2015) Foot Posture, Range of Motion and Plantar Pressure Characteris-tics in Obese and Non-Obese Individuals. Gait & Posture, 41, 465-469.
https://doi.org/10.1016/j.gaitpost.2014.11.010
[22]Filippin, N.T., Barbosa, V.L.P., Sacco, I.C.N. and Lobo da Costa, P.H. (2007) Effects of Obesity on Plantar Pressure Distribution in Children. Brazilian Journal of Physi-cal Therapy, 11, 495-501. https://doi.org/10.1590/S1413-35552007000600012
[23]Waaijman, R. and Bus, S. (2012) The Interdependency of Peak Pressure and Pres-sure-Time Integral in Pressure Studies on Diabetic Footwear: No Need to Report Both Parameters. Gait & Posture, 35, 1-5.
https://doi.org/10.1016/j.gaitpost.2011.07.006
[24]Chong, A.K., Alrikabi, R. and Milburn, P. (2017) July. Gait COP Trajectory of Left Side Hip-Dislocation and Scoliotic Patient Using Ankle-Foot Orthoses. Ninth In-ternational Conference on Digital Image Processing (ICDIP 2017), Vol. 10420, 104204S. International Society for Optics and Photonics.
https://doi.org/10.1117/12.2281547
[25]Hill Jr., J.J. and Cutting, P.J. (1989) Heel Pain and Body Weight. Foot & Ankle, 9, 254-256. https://doi.org/10.1177/107110078900900509
[26]Vela, S.A., Lavery, L.A., Armstrong, D.G. and Anaim, A.A. (1998) The Effect of In-creased Weight on Peak Pressures: Implications for Obesity and Diabetic Foot Pa-thology. The Journal of Foot and Ankle Surgery, 37, 416-420.
https://doi.org/10.1016/S1067-2516(98)80051-3
[27]Cousins, S.D., Morrison, S.C. and Drechsler, W.I. (2013) Foot Loading Patterns in Normal Weight, Overweight and Obese Children Aged 7 to 11 Years. Journal of Foot and Ankle Research, 6, 36. https://doi.org/10.1186/1757-1146-6-36
[28]Mickle, K., Steele, J. and Munro, B. (2006) The Feet of Overweight and Obese Young Children: Are They Flat or Fat? Obesity, 4, 1949-1953.
https://doi.org/10.1038/oby.2006.227
[29]Messier, S.P., Ettinger, W.H., Doyle, T.E., Morgan, T., James, M.K., O’toole, M.L., Bums, R. and Snow, J.B. (1995) Obesity: Effects on Gait in an Osteoarthritic Popula-tion. Medicine & Science in Sports & Exercise, 27, S42.
https://doi.org/10.1249/00005768-199505001-00240
[30]McGoey, B.V., Deitel, M., Saplys, R.J. and Kliman, M.E. (1990) Effect of Weight Loss on Musculoskeletal Pain in the Morbidly Obese. The Journal of Bone and Joint Sur-gery: British Volume, 72, 322-323. https://doi.org/10.1302/0301-620X.72B2.2138158
[31]Cavanagh, P.R., Hennig, E.M., Rodgers, M.M. and Sanderson, D.J. (1985) The Mea-surement of Pressure Distribution on the Plantar Surface of Diabetic Feet. In Bio-mechanical Measurement in Orthopaedic Practice, Clarendon Press Oxford, 159-166.
DOI: 10.4236/jbm.2019.75007 48 Journal of Biosciences and Medicines [33]Periyasamy, R., Mishra, A., Anand, S. and Ammini, A. (2012) Foot Pressure Distri-bution Variation in Pre-Obese and Non-Obese Adult Subject While Standing. The Foot, 22, 276-282. https://doi.org/10.1016/j.foot.2012.08.009
[34]Gopalakrishna, K.P., Mothiram, K.P. and Srinivasan, S. (2001) A New Method of Analysis of Standing Foot Pressure Images for Detection of the Plantar Ulcers in Early-Stage Diabetic Neuropathy. Frontiers of Medical and Biological Engineering: The International Journal of the Japan Society of Medical Electronics and Biological Engineering, 11, 31-43. https://doi.org/10.1163/156855701750383178
[35]Yoon, S.W., Park, W.S. and Lee, J.W. (2016) Effects of Body Mass Index on Plantar Pressure and Balance. Journal of Physical Therapy Science, 28, 3095-3098.
https://doi.org/10.1589/jpts.29.3095
[36]Putti, A.B., Arnold, G.P. and Abboud, R.J. (2010) Differences in Foot Pressures be-tween Caucasians and Indians. Foot and Ankle Surgery, 16, 195-198.
https://doi.org/10.1016/j.fas.2009.11.004
[37]Figueroa, J.L., Fuller, L.C., Abraha, A. and Hay, R.J. (1996) The Prevalence of Skin Disease among School Children in Rural Ethiopia: A Preliminary Assessment of Dermatologic Needs. Pediatric Dermatology, 13, 378-381.
https://doi.org/10.1111/j.1525-1470.1996.tb00704.x
[38]Fuller, E. (1996) Computerised Gait Evaluation. In Clinical Biomechanics of the Lower Extremities, Mosby, London, 179-205.
[39]Phethean, J. and Nester, C. (2012) The Influence of Body Weight, Body Mass Index and Gender on Plantar Pressures: Results of a Cross-Sectional Study of Healthy Children’s Feet. Gait & Posture, 36, 287-290.
https://doi.org/10.1016/j.gaitpost.2012.03.012
[40]Filippin, N.T., Bacarin, T.D.A. and Lobo da Costa, P.H. (2008) Comparison of Static Footprints and Pedobarography in Obese and Non-Obese Children. Foot & Ankle International, 29, 1141-1144. https://doi.org/10.3113/FAI.2008.1141
[41]Putti, A.B., Arnold, G.P., Cochrane, L.A. and Abboud, R.J. (2008) Normal Pressure Values and Repeatability of the Emed (R) ST4 System. Gait Posture, 27, 501-505.
https://doi.org/10.1016/j.gaitpost.2007.06.009
[42]Scott, G., Menz, H.B. and Newcombe, L. (2007) Age-Related Differences in Foot Structure and Function. Gait & Posture, 26, 68-75.37.
DOI: 10.4236/jbm.2019.75007 49 Journal of Biosciences and Medicines
[image:16.595.57.540.121.326.2]Appendix
Table A1. Summary of the dynamic force (kg) and contact area (cm2) data for the normal weight (n = 5), overweight (n = 5) and
obese (n = 5) [Mean (SD) of three trials].
Foot regions
Force (kg) Contact area (cm2)
Healthy Overweight Obese Healthy Overweight Obese
Mean SD Mean SD Mean SD Mean SD Mean SD Mean SD
3rd-5thT 0.63 0.69 1.45 1.32 1.53 1.88 0.74 0.66 1.17 1.01 1.37 1.15
2ndT 0.77 0.56 1.10 1.14 1.26 1.11 0.81 0.55 0.83 0.70 0.84 0.45
1stT 4.62 3.73 5.96 5.51 10.55 8.33 3.21 1.43 2.99 1.33 4.77 1.82
5 MH 2.66 1.62 3.17 1.85 3.85 3.01 2.57 1.44 2.87 1.37 3.16 1.38
4 MH 3.55 1.86 4.04 1.52 6.49 3.69 3.08 1.50 3.42 1.07 4.57 1.31
3 MH 4.39 2.09 5.73 2.95 8.30 2.37 3.56 1.63 4.06 0.91 5.27 1.23
2 MH 5.05 2.10 7.05 3.91 10.00 2.58 3.94 1.64 4.23 0.93 5.81 1.37
1 MH 7.18 3.58 10.47 4.09 14.54 3.59 6.15 2.80 7.20 1.78 9.41 2.54
MF 3.11 4.12 4.68 4.15 6.39 4.65 3.68 3.14 4.90 5.64 7.88 6.49
H 23.47 7.12 27.64 9.5 30.67 13.43 15.55 4.47 16.53 5.72 17.88 6.21
Table A2. Summary of the contact pressure (kPa) and pressure-time integral (kPa/s) data for the normal weight (n = 5), over-weight (n = 5) and obese (n = 5) [Mean (SD) of three trials].
Foot Region
Contact pressure (kPa) Pressure-time integrals (KPa/s)
Healthy Overweight Obese Healthy Overweight Obese
Mean SD Mean SD Mean SD Mean SD Mean SD Mean SD
3rd-5thT 26.32 19.49 37.65 38.75 34.01 28.50 28.34 25.92 37.04 31.42 58.76 84.96
2ndT 30.89 22.32 42.11 34.22 52.67 50.41 34.58 30.20 44.62 40.97 82.59 119.65
1stT 55.38 30.32 83.82 69.30 103.84 86.92 57.31 43.96 90.81 96.60 116.63 157.38
5 MH 52.80 22.86 62.97 34.58 75.91 43.70 61.14 35.33 65.97 28.04 74.10 38.73
4 MH 63.86 22.76 73.77 32.13 97.32 45.81 70.77 33.60 78.33 37.72 96.25 42.16
3 MH 68.14 21.52 80.68 27.11 111.27 34.20 77.95 30.41 83.80 41.38 100.02 41.21
2 MH 69.98 20.54 84.67 25.44 118.96 31.34 84.57 37.32 93.64 50.27 109.65 53.41
1 MH 61.53 19.52 70.90 26.04 100.81 27.33 70.82 38.14 86.56 44.56 101.12 40.76
MF 42.86 26.44 50.93 15.20 85.58 38.21 35.21 44.65 49.94 15.80 58.21 44.71
[image:16.595.55.539.369.577.2]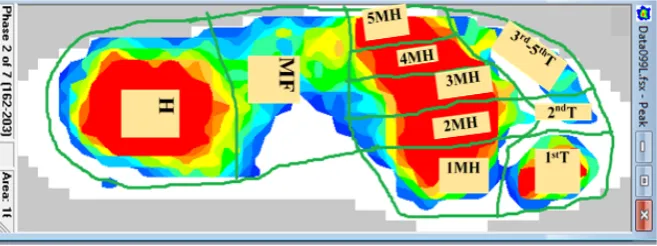
![Table A2. Summary of the contact pressure (kPa) and pressure-time integral (kPa/s) data for the normal weight (n = 5), over-weight (n = 5) and obese (n = 5) [Mean (SD) of three trials]](https://thumb-us.123doks.com/thumbv2/123dok_us/9059794.402300/16.595.57.540.121.326/table-summary-contact-pressure-pressure-integral-normal-trials.webp)
