DETERMINATION OF WEAKEST BUS AND ITS RANKING IN LARGE POWER DISTRIBUTION
SYSTEM AND OPTIMAL ALLOCATION OF FACTS DEVICE
1
Dipali Kiratsata
1
M.Tech scholar Electrical Department
2Assistant Professor Electrical Department
ARTICLE INFO ABSTRACT
The Unified Power Flow Controller (UPFC) is a typical FACTS (Flexible AC Transmission Systems) device that is the most sophisticated and complex power electronic equipment and has emerged for the control and optimization of power flow and also to regulate
transmission system. This paper propose the real, reactive power and voltage control through a transmission line by placing UPFC at the sending end using computer simulation. The L index is the parameter which is used to che
power subjected to stre
IEEE-14 bus system for power
Copyright©2017, Dipali Kiratsata and Gaurav Gangil.
unrestricted use, distribution, and reproduction in any medium, provided the original work is properly cited.
INTRODUCTION
The research work mainly dealt with performance analysis for voltage stability, computation of voltage c
enhancement of power system stability by using UPFC
14 bus system. The Unified power flow controller (UPFC) is the latest device in the FACTS family. Voltage sourced converter is used in the UPFC like it is used in the static sync compensator (STATCOM) and in static synchro
compensator (SSSC) as a basic building block. There is a huge amount of work is done in the past for the modeling of the UPFC for the analysis of power flow analysis. Normally the UPFC is used to compensate a single transmission line. T o
system voltage stability we can use many methods research is made on the basis on analytical
dynamic simulations and load-flow algorithms. The computation of the voltage stability mar
process but this is the most useful method for voltage stability. There are many computation developed for voltage stability analysis and are best suited for power system planning stability assessment is also based on these methods. In the dissertation for on-line lon stability assessment an analytical approach function to be approximated is the mapping
*Corresponding author:Dipali Kiratsata,
M.Tech Scholar Electrical Department, Sobhasaria Group of Institutions, Sikar, India
ISSN: 0975-833X
Article History: Received 17th January, 2017
Received in revised form 10th February, 2017
Accepted 22nd March, 2017
Published online 20th April,2017
Key words:
UPFC, LINE STABILITY INDEX, FAST VOLTAGE STABILITY INDEX voltage stability etc.
Citation: Dipali Kiratsata and Gaurav Gangil, 2017.
allocation of facts device”, International Journal of Current Research
RESEARCH ARTICLE
DETERMINATION OF WEAKEST BUS AND ITS RANKING IN LARGE POWER DISTRIBUTION
SYSTEM AND OPTIMAL ALLOCATION OF FACTS DEVICE
Dipali Kiratsata and
*,2Gaurav Gangil
scholar Electrical Department, Sobhasaria Group of Institutions
Assistant Professor Electrical Department, Sobhasaria Group of Institutions
ABSTRACT
The Unified Power Flow Controller (UPFC) is a typical FACTS (Flexible AC Transmission Systems) device that is the most sophisticated and complex power electronic equipment and has emerged for the control and optimization of power flow and also to regulate
transmission system. This paper propose the real, reactive power and voltage control through a transmission line by placing UPFC at the sending end using computer simulation. The L index is the parameter which is used to check the stability. Voltage stability
system to maintain acceptable voltages at all buses under subjected to a disturbance. The assessment of voltage stability has ngthening of power systems. The research work mainly 14 bus system for voltage stability, computation of voltage power system stability by using UPFC.
Dipali Kiratsata and Gaurav Gangil. This is an open access article distributed under the Creative Commons Att use, distribution, and reproduction in any medium, provided the original work is properly cited.
with performance analysis for collapse point and y by using UPFC of IEEE-The Unified power flow controller (UPFC) is the latest device in the FACTS family. Voltage sourced converter is used in the UPFC like it is used in the static synchronous compensator (STATCOM) and in static synchronous series as a basic building block. There is a huge amount of work is done in the past for the modeling of the UPFC for the analysis of power flow analysis. Normally the UPFC is used T o control power y we can use many methods. The methods such as flow algorithms. The y margin is a lengthy process but this is the most useful method for determination of computation methods sis and in principle they g. On-line voltage nt is also based on these computation line long-term voltage h is developed. The
Electrical Department, Sobhasaria Group of Institutions, Sikar,
between the operating point before disturb stability margin of the most cr
reactive line flows and bus measured in most power syst buses are the inputs for volt
congestion can affect the, unit commitment, cha power system load, production,
idea of the approach is to exp and widely used line voltage stability and to determine the uncertain operation. The line voltage stability
account the voltage stability condition in the system. curve is used to determine the power system security limits, more accurate and up-to-date s
power system security limits can be inc situations without the fear of insecuri reasons the power system cannot limit but when the security bounda relatively large reliability mar hardly a few per cent of total power to transfers close to or there should be a possibili uncertainties related to security
Moghavvemi is based on the model of power flow through a single line shown in Fig. 1 to which a power system network can be reduced, where the subindex S indicates the sending end and the subindex r denotes the receiving end.
International Journal of Current Research
Vol. 9, Issue, 04, pp.48702-48706, April, 2017
OF CURRENT RESEARCH
2017. “Determination of weakest bus and its ranking in large power distribution system and optimal
International Journal of Current Research, 9, (04), 48702-48706.
DETERMINATION OF WEAKEST BUS AND ITS RANKING IN LARGE POWER DISTRIBUTION
SYSTEM AND OPTIMAL ALLOCATION OF FACTS DEVICE
Sobhasaria Group of Institutions, Sikar, India
Sobhasaria Group of Institutions, Sikar, India
The Unified Power Flow Controller (UPFC) is a typical FACTS (Flexible AC Transmission Systems) device that is the most sophisticated and complex power electronic equipment and has emerged for the control and optimization of power flow and also to regulate the voltage in electrical power transmission system. This paper propose the real, reactive power and voltage control through a transmission line by placing UPFC at the sending end using computer simulation. The L index is the
y is concerned with the ability of a under normal conditions and after being s also become more complicated due dealt with performance analysis of e collapse point and enhancement of
is an open access article distributed under the Creative Commons Attribution License, which permits
point before disturbance and the voltage critical congestion. Active and bus voltages which are commonly
tems from almost all lines and buses are the inputs for voltage stability assessment. The
can affect the, unit commitment, changes in the ction, network topology, etc. The pand and generalize the existing stability limit “L-index” method certainty related to power system stability index is used to take into account the voltage stability condition in the system. The PV used to determine the power system security limits, if security limits are used then the limits can be increased in some situations without the fear of insecurity. Due to the previous cannot be stressed up to maximum y boundary method is applied a y margin is needed. This margin is total capacity. To allow increased or beyond the security boundary, possibility to evaluate risks and y limits. This index proposed by is based on the model of power flow through a single line shown in Fig. 1 to which a power system network can be reduced, where the subindex S indicates the sending end and the subindex r denotes the receiving end.
OF CURRENT RESEARCH
Fig.1. Two bus system
2)
sin(
4
s r mn
V
X
Q
L
This Lmn value is used to find the stability index for each line
connection between two bus bars in an interconnected network. As long as the Lmn values of all pairs are less than 1
the system is considered stable.
UNIFIED POWER FLOW CONTROLLER (UPFC)
Basic principle of UPFC
As in the figure show, UPFC consist of two back to back converters named VSC1 and VSC2, are operated from a DC link provided by a dc storage capacitor. These arrangements operate as an ideal ac to ac converter in which the real power can freely flow either in direction between the ac terminals of the two converts and each converter can independently generate or absorb reactive power as its own ac output terminal.
Fig.2. Principle of UPFC
One VSC is connected to in shunt to the transmission line via a shunt transformer and other one is connected in series through a series transformer. The DC terminal of two VSCs is coupled and this creates a path for active power exchange between the converters. VSC provide the main function of UPFC by injecting a voltage with controllable magnitude and phase angle in series with the line via an injection transformer. This injected voltage act as a synchronous ac voltage source. The transmission line current flows through this voltage source resulting in reactive and active power exchange between it and the ac system. The reactive power exchanged at the dc terminal is generated internally by the converter. The real power exchanged at the ac terminal is converted into dc power which appears at the dc link as a real power demand and VSC1 is to supply or absorb the real power demanded by converter2 at the
common dc link to support real power exchange resulting from the series voltage injection. This dc link power demand of VSC2 is converted back to ac by VSC1 and coupled to the transmission line bus via shunt connected transformer. in addition, VSC1 can also generate or absorb controllable reactive power if it is required and thereby provide independent shunt reactive compensation for the line. Thus VSC1 can be operated at a unity power factor or to be controlled to have a reactive power exchange with the line independent of the reactive power exchanged by VSC1. Obviously, there can be no reactive power flow through the UPFC dc link.
Determination of stability of buses
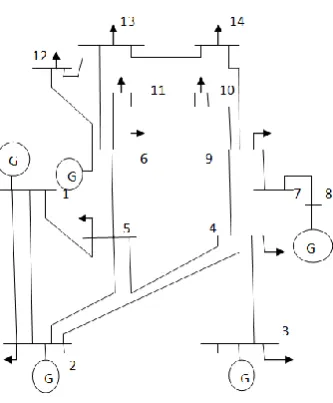
The test system for my research work is IEEE-14bus system (Fig. 3). To maintain the quality of power it is very important to maintain the quality of voltage. There are basic two causes through which voltage stability of the system is threatened;
One is contingency which arise due to scheduled outage, component switching in order to optimize power system operation, or unscheduled outage due to a fault.
Other is congestion; with increased electric power consumption causes transmission lines to be driven close to or even beyond their transfer capacities resulting in overloaded lines and congestions.
The basis of my study for voltage stability is congestion.
Algorithm
Step (1) Load flow study is carried out for ieee14 (fig 3) bus system at base loading.
Before load flow study was carried out, a better understanding of bus data , Line data, is done for understanding loading pattern, voltage magnitude, voltage angle, generation capacity, reactive power reserves, reactive power injection, line parameters, tap setting of transformer, etc.
After this load flow study was done using Newton-Rapson Load Flow using MATLAB programming Results for bus data and line flow is shown in Table 1, 2,3
At base case L-index is calculated using equation 3 for all 20 lines to predict the voltage stability condition in the system.
The load flow study helps in continuous monitoring of the present status of the system which in turn helps in tackling the following problem
1. The total amount of real and reactive power flow in the system.
2. Transmission links can carry certain amount of power and which should not be close to critical values. 3. It is necessary to keep the voltage levels of the certain
buses within close tolerance’ which is possible by proper scheduling of reactive power.
4. Load flow helps in finding out the power flow pattern through the system which is very helpful in assessing the voltage stability study.
Step (2) At the base case congestion is introduced by over loading the system in the steps of 10% and the system behaviour is studied.
In the base case the line loading are done by increasing the load at the buses and the bus data are obtained by running the program.
System behavior under these loading is studied by determining point of voltage collapse using L-index.
There are various methods of assisting voltage stability of the power system as;
By enhancing generator reactive and active power control and voltage control,
By incorporating suitable compensation device.
By rescheduling of power system which involves load shedding and ATC calculation. This also known as The focus of my study was to analyze system behaviour during pre-congestion, during congestion and post- congestion condition. To enhance system voltage study reactive power compensation technique is used in my dissertation work.
Step (3) To resolve congestion in the system using UPFC.
To enhance system voltage stability at the condition of congestion reactive power is boosted by connecting
UPFC in accordance to the critical bus ranking.
The result active and reactive power flow after the installation of UPFC Voltage profile of the system is studied when UPFC is connected.
L-index is calculated for the compensated system.
Maximum Loading Point in Power System (MLP)
The critical line is identified based on congestion ranking of IEEE-14 bus system by NR load flow method. The flowchart for the ranking of all possible congestions is as shown in figure 1. For each line outages conditions, the MLP would be calculated. The Maximum Mega Watt Margin (MMWM) and MW Margin (MWM) are calculated by using the following equations
Maximum Mega Watt Margin (MWM) = Pmax – Pbase Mega Watt Margin (MWM) = Pimax - Pbase
Where, Pbase --- Base case Mega Watt loading.
Pmax --- Maximum Mega Watt loading during without line outage condition.
Pimax --- Maximum Mega Watt loading during each line outage of line i .
λ= line load ability factor
L-Index formulation
The Voltage Stability Index abbreviated by Lij and referred to
a line is formulated in this study as the measuring unit in predicting the voltage stability condition in the system. The mathematical formulation to speed up the computation is very simple. The Lij is derived from the voltage quadratic equation at the receiving bus on a two bus system. The general two-bus representation is illustrated in the figure. From the figure above, the voltage quadratic equation at the receiving bus is written as
]
0
)
(
)
cos
sin
(
[
22
2 1 2
2
Q
X
R
X
V
V
X
R
V
(1)
Setting the discriminate of the equation to be greater than or equal to zero:
(2)
Rearranging Eq. we obtain
2 2
2
) cos sin
( 4
XR V
X Q Z L
i
j ij
(3)
Where:
Z = line impedance X = line reactance,
[image:4.595.224.550.78.670.2]Qj = reactive power at the receiving end Vi = sending end voltage
Fig.3. IEEE 14 Bus system
Solution Algorithm
The overall solution procedure for Newton-Raphson method with UPFC model can be summarized as follows.
1) Read the load flow data and UPFC data.
2) Assume flat voltage profile and set iteration count K=0 3) Compute active and reactive power mismatch. Also, the
Jacobian matrix using NR method equations.
4) Modify power mismatch using UPFC mathematical model (5.4) - (5.15).
5) If the maximal absolute mismatch is less than a given tolerance, it results in output. Otherwise, go to step 6
6) Solve the NR equations; obtain the voltage angle and Magnitude correction vector dx.
[image:4.595.50.249.237.617.2]7) Update the NR solution by x=x+ dx. 8) Set K=K+1, go to step 3
Fig. Two-bus power system model
Fig. Comparison of L index
Fig. Comparisons of voltage profile
Table 1. Reduction in Losses
S.
No. Losses
Without UPFC
With
UPFC % improvement 1 PLOSS 100.210 94.766 5.44
2 QLOSS 349.670 326.374 6.66
RESULTS
In my study IEEE-14 bus system has been analyzed for voltage stability and congestion management. All the load buses were over loaded one at a time with a multiplying factor of 10% in steps.
0
)
2
(
4
]
)
cos
sin
[(
2 21
Q
X
R
X
V
X
R
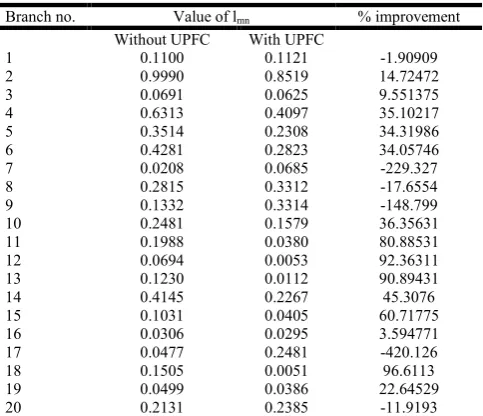
[image:4.595.82.249.410.612.2]Table 2. Improvement in L index
Branch no. Value of lmn % improvement
Without UPFC With UPFC
1 0.1100 0.1121 -1.90909
2 0.9990 0.8519 14.72472
3 0.0691 0.0625 9.551375
4 0.6313 0.4097 35.10217
5 0.3514 0.2308 34.31986
6 0.4281 0.2823 34.05746
7 0.0208 0.0685 -229.327
8 0.2815 0.3312 -17.6554
9 0.1332 0.3314 -148.799
10 0.2481 0.1579 36.35631
11 0.1988 0.0380 80.88531
12 0.0694 0.0053 92.36311
13 0.1230 0.0112 90.89431
14 0.4145 0.2267 45.3076
15 0.1031 0.0405 60.71775
16 0.0306 0.0295 3.594771
17 0.0477 0.2481 -420.126
18 0.1505 0.0051 96.6113
19 0.0499 0.0386 22.64529
20 0.2131 0.2385 -11.9193
Table 3. Improvement in voltage profile
Bus No. Voltage profile % Improvement Without UPFC With UPFC
1 1.06 1.06 0
2 0.995 0.995 0
3 0.96 0.96 0
4 0.846 0.8799 -4.00709
5 0.879 0.9013 -2.53697
6 1.02 1.02 0
7 0.9364 0.9833 -5.00854
8 1.04 1.04 0
9 0.9113 0.9942 -9.09689
10 0.9183 0.9872 -7.50299 11 0.9625 0.9977 -3.65714 12 0.9913 1.0057 -1.45264
13 0.977 1.0042 -2.78403
14 0.9111 1.0309 -13.1489
Critical bus was identified as the decrease order of maximum loadability in context to the line voltage stability index, i.e. for the bus loading when index attain unity value that loading is the maximum loading for that bus and the bus which has minimum loading is the weak bus of the system and the line which attain unity value for the Lmn index is the critical line.
For that bus the results are shown in the table 6.1, for both real power and reactive power loading 9,4,14 buses are identified as weak buses. 4-9, 1-5, 13-14 are consecutive critical line. UPFC is connected to these lines to maintain stability of the system.
Conclusion
In this dissertation work, the power system line outage analysis and contingency ranking is done based on the Maximum
loading point. Here, load flow method is used to estimate the maximum loading point for each line outage conditions. It is observed from the results, the occurrence of line outage in power system results in increasing of voltage drop in some of buses, the possibility of change in the weakest bus position and change in MLP. The line outage with lower loading point has the higher ranks in the contingency ranking and identified as critical line. So, by identifying these critical line outages, we can take immediate necessary action to avoid the system voltage collapse and unwanted power system blackouts.
REFERENCES
Ahmed A. Hossam-Eldin2006. ” Study and simulation of the unified power flow controller effect on power systems” Power Systems Conference, MEPCON, Eleventh International Middle East (Volume:2)
Althowibi F. A. 2010. ”Voltage stability calculations in power transmission lines: Indications and allocations” Power and Energy (PECon), IEEE International Conference on Belacheheb, K. 2000. ”Compensation of the electrical mains
by means of unified power flow controller (UPFC)-comparison of three control methods” Harmonics and Quality of Power, Proceedings. Ninth International Conference on (Volume:1)
Claudia Reis” 2009. Line stability indices for voltage collapse prediction” International Conference on Power Engineering, Energy and Electrical Drives
Cupelli M. 2012.”Comparison of line voltage stability indices using dynamic real time simulation” 3rd IEEE PES Innovative Smart Grid Technologies Europe (ISGT Europe)
Haque M. H. 2013.“A smart instrument for on-line monitoring of static voltage stability index using local measurements” IEEE Innovative Smart Grid Technologies-Asia (ISGT Asia)
Murugan A. 2013. ” A new approach for voltage control of IPFC and UPFC for power flow management” Energy Efficient Technologies for Sustainability (ICEETS), International Conference on
Natália M. R. Santos 2011. “Incorporating a Unified Power Flow Controller in a conventional transient stability model” Control & Automation (MED), 19th Mediterranean Conference on
Ramesh M. 2012. ”Stabilty of Power Transmission Capability of HVDC system using facts controllers” Computer Communication and Informatics (ICCCI), International Conference on
[image:5.595.41.285.310.465.2]