Volume 180 – No.24, March 2018
Power Aware Task Scheduling in Compute Cloud
Biral Modi
PG Scholar Department of ComputerEngineering
LDRP Institute of Technology and Research
Gandhinagar, India
Bela Shrimali
LecturerDepartment of Computer Engineering
LDRP Institute of Technology and Research
Gandhinagar, India
Hiren B. Patel,
PhD Professor & Head Department of ComputerEngineering
LDRP Institute of Technology and Research
Gandhinagar, India
ABSTRACT
Cloud computing has become an attractive computing paradigm in recent years to offer on demand computing resources for users worldwide. Computing resources are delivered in the form of virtual machines. In such a scenario, task scheduling algorithms play an important role to schedule the tasks effectively to achieve reduction in power consumption and makespan with improvement in resource utilization. Many task scheduling algorithms are introduced to improve energy efficiency of data center. In our work, we have proposed and discussed a power aware dependent task scheduling (PADTS) algorithm and compare it with existing ones.
Keywords
Cloud Computing, Energy Efficiency, Task Scheduling, Makespan
1.
INTRODUCTION
Cloud computing is in [1] an emerging technology enabling ubiquitous, convenient, on-demand network access to a shared pool of configurable computing resources, for instance, networks, servers, storage, applications and services. It can rapidly provision and release resources with minimal management effort or service provider interaction. It offers the service of deploying and running applications to the end users. The Cloud service providers (CSP) provide different services to end users through the internet. The CSP offers membership to the clients for different services like infrastructure as a service (IaaS), platform as a service (PaaS) and software as a service (SaaS) [1].
Scheduling or allocation is the process of allocating resources to a variety of conceivable tasks. This distribution of resources is a basic and critical job carried out by the CSP. Effectiveness and performance of the system will be enhanced through proper scheduling of Cloud resources. Scheduling is taken place with two ways either it mapping of tasks to existing finite set of virtual machines or mapping of virtual machines to finite set of physical hosts. There are various research work carried out on this scheduling problem by considering different objectives or parameters like energy consumption [2], resource utilization [3], makespan, load balancing, guaranteeing Quality of Service (QoS)[4],workload, response time, performance[5] and Service Level Agreement (SLA) completion. In this paper, we consider makespan minimization as a primary objective along with considering power consumption of the system.
The rest of the paper is structured as follows. Section 2 overviews the related work. Section 3 describes the proposed method along with problem statement, system model, task,
resource model, proposed algorithm and example scenario. Section 4 includes conclusion followed by future work.
2.
RELATED WORK
In this section, we discussed state-of-art of task scheduling algorithm.
Mishra et al.[6] addressed the issue of computational power consumption in Cloud data center. They proposed an adaptive task allocation algorithm (by presenting a system model/task model) to minimize makespan along with energy consumption. The proposed mechanism has been simulated in Cloudsim to support the claim.
For the optimization of power consumption in the Cloud, the authors in [1] proposed an energy aware task scheduling (EATS) for Cloud computing framework which is responsible to schedule users’ tasks considering the energy consumption while running those tasks. The results revealed that CPU energy consumption account for a big part of the energy consumption of servers, and therefore must be considered in any energy aware scheduling algorithm. The experiments show that the average power consumption of the startup and the shutdown procedures account for 68% and 54%respectively.
In order to reduce computational complexity for Cloud service providers, the authors in [7] proposed a fast and energy aware resource provisioning and task scheduling algorithm that effectively reduce the complexity and minimize the execution time while achieving a reasonable energy cost. The author claimed that the proposed algorithm achieve up to 79.94% runtime improvement with increase in an acceptable energy cost compared to the baseline algorithm.
Sanjeevi et al. [8] addressed the problem of trade-off between operating cost and energy consumption in data center through the task scheduling using certainty and uncertainty algorithm for non urgent and urgent tasks. Their implementation claimed to reduce energy consumption and improvement in operating cost.
3.
PROPOSED METHOD
In this section, we discussed task scheduling algorithm for dependent and urgent task.
3.1
Problem Statement
tasks to VMs efficiently to optimize makespan, along with energy consideration for the system. Makespan and energy consumption can be calculated as follows:
Makespan of the system is Execution time of Virtual machine (ETV) calculated as follow.
Makespan (M) =
(i)
Here ETVi represents the execution time of i th virtual machine. Hence, total makespan of machine is summation of execution time of all VMs allocated to it. Another important consideration is energy consumption of the Cloud system. A virtual machine is considered in either of the two state viz. active or idle. So, to calculate the energy consumption of virtual machine, both active and idle state energy consumptions are considered. It is analyzed in the literature available that the energy consumption of VM in idle state is 60% of energy consumption of VM during active state [6]. Hence, the idle state time of a VM is calculated by subtracting the active state time from the makespan of the system. Ai Joules/Million Instruction (J/MI) is the energy consumption of i th VM in an active state, and Ii is in an energy consumption of idle state. The calculation of energy consumption at different state is defined as follows:
The energy consumption of the system is calculated by adding the energy consumption of individual VMs using Eq. (iv). Energy Consumption (E) =
……..(iv)
3.2 System Model
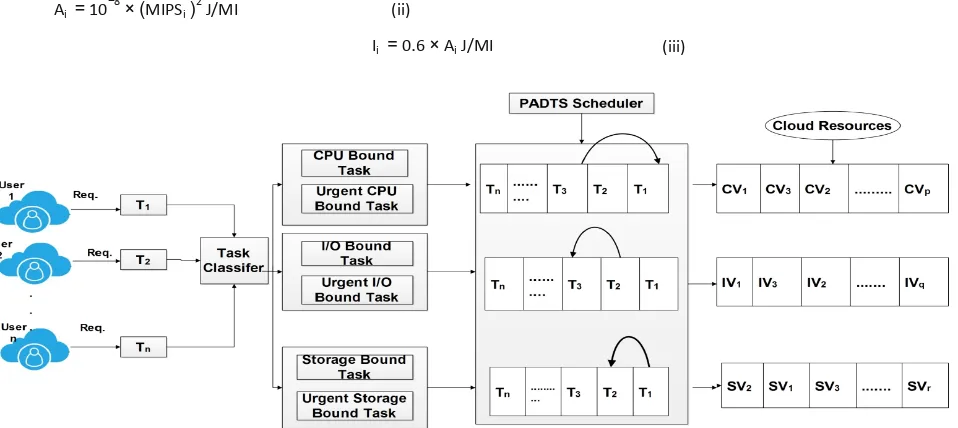
Consider a Cloud comprise of n number of recourses. Here, we assume that it has enough resources to handle end user’s service requirements. Here, the Cloud users (U1, U2,…, Un ) submit their tasks to the Cloud data centers and these tasks (T1,T2,…Tn) are arranged in sequence. The system has two components, Task Classifier and Power Aware Dependent Task Scheduling (PADTS) scheduler as shown in figure 1. The task classifier is responsible to categorize the tasks into three main categories based on the requirement of resources viz. CPU bound task, I/O bound task, storage bound task. It also consider the urgency of task and identify it as urgent CPU bound task, urgent I/O bound task, urgent Storage Bound task. Identification of task is based on the task type as described later in task model. Whereas, (PADTS) scheduler is responsible to schedule task with considering their dependency. For example, there are n number of tasks (T1,T2,…Tn) . If task T3 is dependent on task T1 then task T1 is executed before task T3 and VM will be allocated to task T1 before T3.
Also, PADTS scheduler schedules the urgent tasks first. In case if the urgent tasks queue is empty then they assign regular tasks queue to the respective VMs.
After scheduling, the tasks are arranged in a queue and allocate to resources as shown in figure 1. Here, CV(CV1, CV2,…, CVp ), IV(IV1, IV2, …, IVq), and SV(SV1, SV2, …SVr) are represent the CPU bound virtual machines, I/O bound virtual machines and storage bound virtual machines.
Ai = 10−8×(MIPSi)2 J/MI (ii)
[image:2.595.62.541.411.625.2]Ii = 0.6 × Ai J/MI (iii)
Figure 1: scheduling model with dependency consideration for Cloud system
3.3 Task and Resource Model
End users are submitting their request for the services in Cloud. These request forms different tasks. These tasks are heterogeneous in terms of length of the tasks and resource requirements. Let’s consider n (finite) number of tasks, and the set is T={T1, T2,…Tn}. Each task Ti, 1<= i<= n has five tupels.
Ti = Wi CPUi Mi ʎi Ri
Where,
Wi is the workload of service Ti in terms of MI. CPUi is the CPU time required for the service Ti. Mi is the main memory requirement for the service
Ti.
ʎi is the bandwidth requirement of service Ti. Ri represents the task type.
Volume 180 – No.24, March 2018
2 if Ti IO intensive 3 if Ti urgent IO intensive 4 if Ti Storage intensive 5 if Ti Urgent Storage intensive
Where,
Hj represents jth host.
Pj is the number of processing elements or cores of Hj.
Sj is the Processing speed of Hj interms of MIPS. Mj is the host main memory size of Hj.
SSj is the secondary memory size of Hj. ʎj is the total bandwidth provided toHj. VMMj is the VMM running on host Hj.
Each host Hj has finite number of virtual machines. Each VM has five tuples.
Where,
Vij represents jth VM running on ith host. PEij
is the number of processing elements or cores of Vij.
Sij is the processing speed of Vijin terms of MIPS. Mij is the main memory size of Vij.
SSij is the secondary memory size of Vij. ʎij is the total bandwidth provided to Vij.
3.4
Proposed Algorithm
The proposed PADTS Algorithm is derived from Adaptive Task Allocation algorithm discussed in [6] and further it carried out more functions. The proposed algorithm consider the interdependent and storage bound task which was not considered in [6]. As it consider interdependent task, it checks the dependency of task before the resource allocation. In proposed method three different parameters are considered as different cases viz. dependency, urgency and energy consumption. Task allocation will be different in each case. Their effects and evolution is carried out deeply in section 3.6.
Algorithm 1: Power Aware Dependent Task Scheduling Algorithm
Input: ETC matrix, Dependency Vector (DM), Urgency Vector(UV)
Output: Execution time of all VMs (ET) 1. Nt=Number of tasks
2. R_ETC=RowUpdate(ETC) 3. C_ETC=ColumnUpadte(R_ETC) 4. For each Row do
5. If a single Unmarked 0 is there then 6. Mark the 0 as assigned
7. Ignore the elements of the corresponding row and column of the assigned element in step 15 8. End if
9. End for
10. For each Column do
11. If a single Unmarked 0 is there then 12. Mark the 0 as assigned
13. Ignore the elements of the corresponding row and
column of the assigned element in step 21. 14. Print matrix AETC
15. End if 16. End for
17. If For each row of AETC has an assigned 0 then 18. Procedure call: Dependency for case 1
19. Procedure call: Urgency for case 2 20. Procedure call: Energy for case 3 21. Procedure call: Dependency
22. Using Dependency vector check dependency 23. For each i=0 to n
24. If dependency == true
25. Then attach dependent task with Ti 26. End if
27. Return task sequence 28. End for
29. Procedure call: Urgency
30. Using Urgency vector check urgent task 31. For each i=0 to n
32. If Urgency==1
33. Then update task sequence according to priority
34. End if 35. End for
36. Call dependency procedure 37. Procedure call: Energy 38. Call dependency procedure 39. Call urgency procedure 40. For each task i=o to n
41. Allocate all dependent of Ti on same VM 42. End for
43. Else
44. Task is allocate adaptively
45. Continue for the next (i=1)th iteration 46. End if
47. End For
Algorithm 2: Update_ETC Input: C_ETC
Output: Updated matrix C_ETC
1. Tick all unassigned rows 2. If Ticked row has 0 then
3. Tick the corresponding column 4. End if
5. If Ticked column has an assignment then 6. Tick the corresponding row
7. End if
8. Repeat step 2 to 7 till no more ticking is possible 9. Draw lines through unticked rows and ticked
columns
10. α= Smallest number that have no lines passing through
11. C_ETCij= C_ETCij-α, If no lines passing through 12. C_ETCij= C_ETCij, If one lines passing through 13. C_ETCij= C_ETCij+α, If two lines passing through 14. Return the updated ETC
3.5
Analysis of Algorithm: Time
Complexity analysis
If the total number of tasks is n and the total number of VMs is m. For the m=n the line 4 to 9 of algorithm 1 and line 2 to 14 of algorithm 2 will run for O(m2) times. For the line 17 to 21, individual procedure will execute for n time so total execution for all three procedure will be 3n and hence total execution time will be O(n2). Hence, the time complexity of Hj = PEj Sj Mj SSj ʎj VMMj
PADTS algorithm runs O((n\m)*(m2+m2+…+ k times) = O(mn) time for number(task)=number(VM) and for different number of task and VM the time complexity is O(mn2).
3.6 Evaluation of algorithm: Example
Scenario
[image:4.595.321.536.68.238.2]The explanation of the example will carry from the ETC (Expected Time to Compute) matrix as shown in Table 1. There are ten tasks and five VMs. We have considered urgency and dependency of tasks as shown in table 1.
Table 1: before updation
V1 V2 V3 V4 V5 Depend- ency Urgency
T1 11 9 3 10 5 - 0
T2 10 15 5 9 6 T5 0
T3 2 6 8 10 12 - 0
T4 8 4 13 15 6 - 1
T5 9 2 3 11 5 T4 0
T6 5 8 12 16 6 T7 1
T7 9 3 8 5 1 T9 0
T8 11 9 8 4 7 - 1
T9 3 10 8 7 6 - 0
T10 10 2 12 13 9 T8 0
[image:4.595.8.286.442.604.2]Our algorithm performs row update and column update functions as describe in [6]. This technique is useful to indentify efficient VM for task. As shown in table 2, the pair for which ETC is 0 is considered for allocation.
Table 2: After Updation
V1 V2 V3 V4 V5 Dependency Urgency
T1 8 6 0 7 2 - 0
T2 5 10 0 4 1 T5 0
T3 0 4 6 8 10 - 0
T4 4 0 9 11 2 - 1
T5 7 0 1 9 3 T4 0
T6 0 3 7 11 1 T7 1
T7 8 2 7 4 0 T9 0
T8 7 5 4 0 3 - 1
T9 0 7 5 4 3 - 0
T10 8 0 10 11 7 T8 0
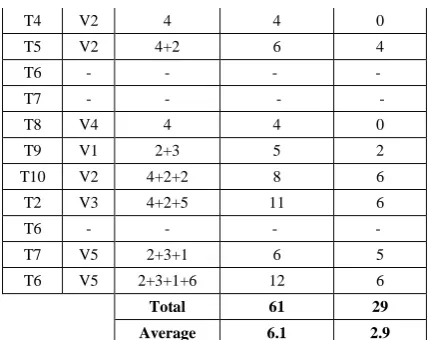
To further consider urgency and dependency of task, Here we have calculated the base method without dependency calculation and as shown in table 3. From the table we can see that the depended tasks are suspended and resumed at the end after the completion of all tasks. We have considered the calculation of average throughput and response time for the comparisons.
Table 3: existing method (without dependency consideration)
Task VM Time Throughput Response
Time
T1 V3 3 3 0
T2 - - - -
T3 V1 2 2 0
T4 V2 4 4 0
T5 V2 4+2 6 4
T6 - - - -
T7 - - - -
T8 V4 4 4 0
T9 V1 2+3 5 2
T10 V2 4+2+2 8 6
T2 V3 4+2+5 11 6
T6 - - - -
T7 V5 2+3+1 6 5
T6 V5 2+3+1+6 12 6
Total 61 29
Average 6.1 2.9
We have taken three cases to describe the effect and consideration of parameters viz. dependency and urgency in proposed method. The explanation and evaluation scenario for each of the cases are as follows:
Case 1: Proposed method (with dependency consideration)
In this case, the tasks are allocated to VM based on dependency of task. The dependency of the task is mentioned in table 1. We have calculated throughput and response time of all tasks after allocation of VMs. The average throughput and response time is 9.5 and 3.5 respectively as shown in table 4.
Table 4: Proposed Method (with dependency Consideration)
Task VM Time Through
put
Response Time
T1 V3 3 3 0
T4 V2 4 4 0
T5 V2 4+2 6 4
T2 V2 4+2+15 21 6
T3 V1 2 2 0
T9 V1 2+3 5 2
T7 V1 2+3+9 14 5
T6 V1 2+3+9+5 19 14
T8 V4 4 4 0
T10 V4 4+13 17 4
Total 95 35
Average 9.5 3.5
%
Overhead 55.74% 20.69%
After comparison of our proposal and existing method, we can analyze that the difference of average throughout is 3.4 and average response time is 1.6 respectively which is shown in figure 2.
Table 5: comparison with existing method (in time)
ATAA algorithm PADTS algorithm Average
Throughput 6.1 9.5
Average
Volume 180 – No.24, March 2018
Figure 2: comparison with existing method
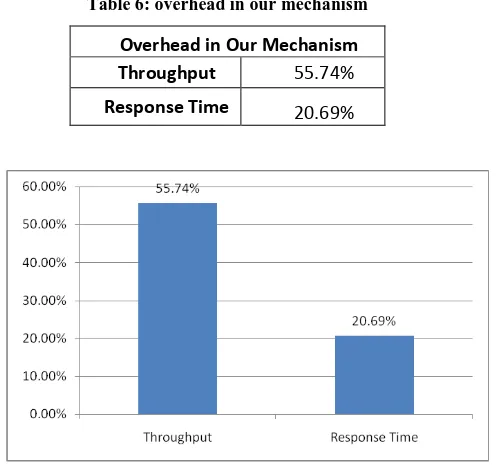
[image:5.595.314.568.98.298.2]We have also calculated the percentage overhead with existing method for throughput and response time which is 55.74% and 20.69% respectively. The comparison of percentage overhead is shown in figure 3.
Table 6: overhead in our mechanism
Overhead in Our Mechanism
Throughput 55.74%
Response Time 20.69%
Figure 3: overhead in our mechanism
Case 2: Proposed method (with dependency and urgency parameter but without energy consumption)
In this case, we considered dependency and urgency of the tasks. So, the allocation of VMs based on dependency and urgency. The urgent tasks are defined in table 1. After allocation, we calculated average throughput and response time which is 5.5 and 1.9 respectively. The calculation is shown in table 7.
Table 7: our proposal (with urgency consideration but without energy consideration)
Task VM Time Throughput Response Time
T4 V2 0+4 4 0
T8 V4 0+4 4 0
T9 V1 0+3 3 0
T7 V5 3+1 4 1
T6 V5 3+1+6 10 4
T1 V3 3 3 0
T5 V2 4+2 6 4
T2 V3 3+5 8 3
T3 V1 3+2 5 3
T10 V2 4+2+2 8 4
Total 55 19
Average 5.5 1.9 %
Improvement 9.84% 34.48%
[image:5.595.53.301.291.524.2]We compare the case with the existing method and found the percentage improvement in throughput and response time which is 9.84% and 34.48% respectively. The graph of percentage improvement is shown in figure 4.
Table 8: improvement in our mechanism
Improvement in Our Mechanism
Throughput 9.84%
Response Time 34.48%
Figure 4: improvement in our mechanism
Case 3: Proposed method (with dependency, urgency and energy consumption considerations)
[image:5.595.314.552.382.593.2]Table 9: Proposed Method (with dependency, urgency and energy consumption considerations)
Task VM Time Throughput Response Time
T4 V2 0+4 4 0
T8 V4 0+4 4 0
T9 V1 0+3 3 0
T7 V1 3+9 13 3
T6 V1 3+9+5 17 12
T1 V3 3 3 0
T5 V2 4+2 6 4
T2 V2 6+15 21 6
T3 V1 3+17+2 22 20
T10 V4 4+13 17 4
Total 110 49
Average 11 4.9 %
Overhead 80.33% 68.97%
[image:6.595.45.290.99.300.2]We have compared this result with the existing method and find the percentage overhead in throughput and response time which is 80.33%and 68.97% respectively. The graph of percentage overhead is shown in figure 5.
Table 10: overhead in our mechanism
Overhead in Our Mechanism
Throughput 80.33%
Response Time 68.97%
Figure 5: overhead in our mechanism
In this case, we have considered energy consumption so calculate the energy consumed by particular VM and compare with existing method. This comparison shows that energy is reduced, which is shown in figure 6.
Table 11: Energy Consumption (relative)
Energy usage (Relative)
ATAA algorithm PADTS algorithm
100.00% 80.00%
Figure 6: energy consumption (relative)
4. CONCLUSION
This paper focuses on task scheduling for urgent and dependent task and also discusses the problem of energy consumption. In the paper, we have proposed a novel method called PADTS algorithm in compute Cloud. We have presented a system model including task model and resource model that discuss and emphasizes on the importance of urgent CPU bound, I/O bound, and storage bound task. The task allocation process is carried out on urgent and interdependent task and discussing allocation based on different parameters of task like urgency, dependency and energy consumption. The evaluation scenario discussing the results and shows the improvement of 9.84% in throughput, 34.48 in response time and energy is saving by 20%. The future work may include the energy aware task scheduling for all types of tasks.
5. REFERENCES
[1] Ismail, L. and Fardoun, A.A., 2017, April. Towards energy- aware task scheduling (EATS) framework for divisible-load applications in Cloud computing infrastructure. In Systems Conference (SysCon), 2017
Annual IEEE International (pp. 1-6). IEEE.
[2] Beloglazov, A., Abawajy, J. and Buyya, R., 2012. Energy-aware resource allocation heuristics for efficient management of data centers for Cloud computing. Future
generation computer systems, 28(5), pp.755-768.
[3] Rimal, B.P. and Maier, M., 2017. Workflow scheduling in multi-tenant Cloud computing environments. IEEE
Transactions on Parallel and Distributed Systems, 28(1),
pp.290-304.
[4] Ali, H.G.E.D.H., Saroit, I.A. and Kotb, A.M., 2017. Grouped tasks scheduling algorithm based on QoS in Cloud computing network. Egyptian Informatics
Journal, 18(1), pp.11-19.
[5] Sampaio, A.M., Barbosa, J.G. and Prodan, R., 2015. PIASA: A power and interference aware resource management strategy for heterogeneous workloads in Cloud data centers. Simulation Modelling Practice and
Theory, 57, pp.142-160.
[image:6.595.55.293.376.587.2]Volume 180 – No.24, March 2018
technique for green Cloud computing. The Journal of
Supercomputing, pp.1-16.
[7] Li, H., Li, J., Yao, W., Nazarian, S., Lin, X. and Wang, Y., 2017, March. Fast and energy-aware resource provisioning and task scheduling for Cloud systems.
In Quality Electronic Design (ISQED), 2017 18th
International Symposium on (pp. 174-179). IEEE.
[8] Sanjeevi, P. and Viswanathan, P., 2015, December. A green energy optimized scheduling algorithm for Cloud data centers.In Computing and Network Communications
(CoCoNet), 2015 International Conference on (pp.