ISSN Online: 2152−7261 ISSN Print: 2152−7245
DOI: 10.4236/me.2018.95061 May 16, 2018 966 Modern Economy
Determinants and Consequences of Share
Repurchase Decisions
Rebecca Abraham, Judith Harris, Joel Auerbach
Nova Southeastern University, Fort Lauderdale, USA
Abstract
This paper explores the determinants of share repurchase decisions within the context of a modern conceptual framework. Empirically, it categorizes such determinants by firm size, stage of the product life cycle, membership in the technology sector, ownership of overseas cash reserves, and institutional ownership. Share repurchases were used to boost earnings per share tempora-rily. Such effects dissipated over 1 year and 5 years. Certain categories of firms used share repurchase to grow through acquisitions, while others used share repurchase to prevent takeovers. This paper is the first study to examine share repurchase through categories of determinants within the context of short and long-term post-share repurchase performance.
Keywords
Share Repurchase, Agency Theory, Earnings per Share, Firm Performance
1. Introduction
Corporate finance recognizes shareholder wealth maximization as its core goal. To maximize shareholder wealth, managers must take advantage of growth op-portunities by accepting positive net present value projects. Free cash flow gen-erated from these projects may be returned to shareholders in the form of divi-dends or share repurchase [1]. [2] observed the growth of share repurchase ex-penditures at an average annual rate of 26.1%.
The relative popularity of the share repurchase option may be attributed to its effect on earnings. Share repurchase reduces the equity base of the firm, thereby automatically increasing earnings per share (EPS). As earnings per share is net income/number of shares outstanding, by reducing the number of shares out-standing, share repurchase increases earnings per share. Every quarter,
invest-How to cite this paper: Abraham, R., Harris, J. and Auerbach, J. (2018) Deter-minants and Consequences of Share Re-purchase Decisions. Modern Economy, 9, 966-979.
https://doi.org/10.4236/me.2018.95061 Received: March 15, 2018
Accepted: May 13, 2018 Published: May 16, 2018
Copyright © 2018 by authors and Scientific Research Publishing Inc. This work is licensed under the Creative Commons Attribution International License (CC BY 4.0).
http://creativecommons.org/licenses/by/4.0/
DOI: 10.4236/me.2018.95061 967 Modern Economy ment research analysts release consensus forecasts of EPS. Stocks that outper-form the consensus forecast transmit a market-validated positive signal causing an immediate surge in stock prices [3]. Conversely, firms that fail to meet the EPS estimate (negative earnings surprises) release a negative signal depressing security returns and inviting individual and investor concern. Inadvertently, the ability of share repurchase to increase earnings per share may exacerbate the positive signal of a positive earnings surprise and lessen the severity of a negative earnings surprise. In a study of large UK firms, [4] observed that earnings per share reacted positively in the immediate aftermath of a stock repurchase. In the pre-social media era, investors scrutinized the firm’s financial decisions for sig-nals of positive or negative future performance. Investors viewed the share re-purchase as evidence that the firm had excess cash for distribution to sharehold-ers, thereby boosting stock prices. During this period, market signals from share repurchase served an informational purpose in that they signaled that the firm was cash-rich (free cash flow theory), was capable of earning positive future cash flows (signaling hypothesis), buying stock to compensate managers (option re-funding theory), or choosing to compensate shareholders with stock in lieu of dividends (dividend substitution theory). This paper addresses the current lite-rature’s alternate theoretical conceptualizations of share repurchase, addressing their limitations in describing modern market conditions. Then, it sets forth a new conceptualization of share repurchase for a world in which the Internet has rendered information a free good, so that share repurchase decisions have be-come a supplement to further increase the earnings per share of firms that un-dertake successful investment in profit-making projects. Finally, the empirical study has the unique features of 1) measuring the motivations for share repur-chase decisions in the modern era, 2) measuring the impact of share repurrepur-chase on short-term and long-term earnings per share over contemporaneous, 1-year, 3-year, and 5-year periods, and 3) using size, product life-cycle, technology, overseas cash ownership, and institutional ownership subsamples. The limita-tion of the study in that it relies on COMPUSTAT data which is confined to US firms, so that the results may not be generalizable internationally. The paper is organized as follows. Section 1 is an Introduction, Section 2 is the Literature Re-view and Hypotheses Development, Section 3 is the Methodology, Section 4 consists of Results, and Section 5 presents Conclusions and Recommendations for Future Research.
2. Literature Review and Hypotheses Development
2.1. Free Cash Flow Theory
DOI: 10.4236/me.2018.95061 968 Modern Economy after which any excess was distributed to the shareholders as dividends or used to repurchase stock. It follows that cash-rich firms with few profitable projects will spend fewer funds on these projects than their counterparts with less cash and a large number of profit-making opportunities (see [6], for a review). Ac-cordingly, cash-rich firms will distribute excess cash flows as shareholders will object to these funds being invested in unprofitable investments.
2.2. Signaling Hypothesis
The signaling hypothesis’s popularity ([7] [8], see [1], for a review) stems from its position that stock repurchases are undertaken by firms that are undervalued, signaling superior future cash flows. Surveys by [9] and [10] found that manag-ers were keen to signal successful future performance. [11] posited that share repurchases occur when shares are undervalued so that the repurchase transfers stock from selling shareholders to non selling insiders. The market is unaware of the identities of buyers and sellers and continues to undervalue the stock in the post-repurchase period. [12] observed a significant correlation between positive abnormal stock returns and the private information motivating the purchase of stock by insiders.
2.3. Option Refunding
Yet another early theory pertains to the need for firms to maintain an inventory of stock through share repurchase to fund executive stock option programs and fund stock mergers. For stock mergers, acquirers offer holders of target stock shares in the consolidated, post-acquisition firm at premium stock prices. This stimulates them to repurchase their own stock for such sales to be undertaken. Given the small volume of stock mergers in relation to all mergers ([13]), it is possible that such option refunding may also not be a significant source of shares repurchased. Further, stock mergers release a strong negative signal that the firm lacks cash, stimulating managers to avoid this form of merger. This contention is borne out by surveys of executives which show option refunding as a less important impetus for share repurchase, particularly over time, with [10]
and [14] finding diminishing importance for option refunding compared to ear-lier surveys of managers [9].
2.4. Dividend Substitution
DOI: 10.4236/me.2018.95061 969 Modern Economy products that generate considerable amounts of cash. In contrast, share repur-chase does not offer the perception of permanent financial stability. It is under-taken by firms with more volatile cash flows, who do not have the stream of cash flows to permanently pay a steady level of dividends. The favorable tax treatment of share repurchase over dividends further encourages repurchase.
2.5. Rationale for a New Framework
With the advent of the Internet, hitherto private information has become public, so that information asymmetry has lessened. Managers formerly had sole access to information about the firm’s investments in new products, the fate of existing products, the deployment of human capital and the pursuit of new markets. The dissemination of news instantaneously through social media has revealed this information to the investment community. Individual investors may make pro-jections of firm decision-making ability and, in turn, performance, based on the news, without having to rely on signals from dividend payouts or share repur-chases. Therefore, the signaling theory’s dominance is compromised.
The dividend substitution theory has diminished in value as well. In the pre-Internet world, high dividend payout ratios signaled a stable level of earn-ings to prevail at a steadily growing rate into the future. Yet, in the decade after the advent of the Internet, [15] observed in surveys of managers that there was extreme reluctance to cut dividends. Managers preferred to forego certain prof-it-making projects to preserve dividends at the existing level. Sixty-five percent of survey respondents preferred to raise external funds before reducing divi-dends. What is the adverse consequence of dividend reduction that management wishes to prevent so steadfastly? A reduction in dividends signals financial dis-tress and bankruptcy. Since it is the norm to pay out some level of dividends, the only incremental information conveyed by dividends is that their reduction in-dicates the firm’s inability to achieve a minimum level of earnings. The informa-tional role of share repurchase is limited. Share repurchase, by definition, in-creases earnings per share by reducing the number of shares outstanding. This outcome could generate positive earnings surprises and boost stock returns for the forthcoming quarter. [16] found that the reduction in stock returns from the conversion of convertible bonds to stock was 2.5% less when this conversion was combined with share repurchase as the increase in earnings per share from share repurchase partially offsets the reduction in stock returns from the convertible bond conversion. As neither dividends nor share repurchase convey information about future performance, and since they have different informational roles, i.e. dividends as signals of financial distress and share repurchase as a source of higher earnings per share, share repurchase is not a substitute for dividend payout.
af-DOI: 10.4236/me.2018.95061 970 Modern Economy ter they are deployed in the payment of dividends and investment in positive (NPV) projects, they are directed to the repurchase of shares. Current practice challenges this hierarchy. Dividend payout is the norm, so that they are no long-er part of a decision-making hilong-erarchy. Thlong-erefore, they view investment in prof-it-making opportunities is indicative of new products and new markets leading to future growth and profitability. Firms that engage in these actions are valued at a higher level, outperform earnings estimates and have higher sustained stock returns. Share repurchase provides a short-term benefit to investors in boosting EPS and stock returns. Investment in profit-making opportunities is the primary measure of management’s ability to achieve future long-term growth with share repurchase complementing this effort with a positive impact on short-term earnings. Eighty percent of managers surveyed in the [15] study considered in-vesting in positive NPV projects as taking precedence over share repurchase.
2.6. The New Paradigm
The assumptions of a [17] market consist of 1) all investors having equal and costless access to information about stock prices, 2) indifference to the form of this wealth, whether cash or stock, 3) and perfect certainty of the profitability of each investment opportunity. Social media access assures ready access to corpo-rate information so that investors may have much information about the firm’s products, markets, image, and future prospects. The payment of a regular divi-dend renders dividivi-dend payments to be less informative about the firm’s future performance. The individual investor directs attention to the firm’s ability to ca-pitalize on future growth opportunities. Is the firm producing new products? Is it seeking new markets if its existing products have reached market saturation? Is it growing through acquisition of product innovators if it does not wish to vest in house research and development? Annual reports, Form 10Ks, in-vestment analyst reports, 24-hour electronic and social media can supplement technical reports with news items, anecdotes, personal opinion, tweets, and blogs to respond to these queries. Firm value is viewed in terms of the earning power of assets, not the signaling power of market imperfections, such as dividends and shares repurchased. [17] proposed the investment opportunities approach to the market valuation of assets. Real assets may be tangible, such as manufactured products, or intangible such as inventions, patents, copyrights, brand loyalty, or market access. They posit that the value of the firm is the present value of a per-petuity of profits composed of some proportion of profit attributable to these real assets together with profits generated by existing investments in real assets.
DOI: 10.4236/me.2018.95061 971 Modern Economy In this environment of open access to information, share repurchase, by re-ducing the equity base of the firm, and in turn, boosting earnings per share fails to provide information about future performance. Retained earnings perform the signaling function, depending upon whether the investment in real assets is profitable, so that investors do not need to surmise from share repurchase that the firm has excess cash.
H1: For all firms, retained earnings will significantly predict the decision to repurchase shares.
H2: For large firms, investment in target firms with high levels of research and development expenditure, will significantly predict the decision to repurchase shares.
Given that this model assumes that a level of dividend payout is set by man-agement, and is maintained into the future for fear of adverse signaling, followed by investment in positive NPV projects, followed by share repurchase, a firm would have to be cash-rich in order to meet all of the dividend, profit-making, and share repurchase objectives. It follows that large, mature or declining “cash cow” industries will continue to generate a stream of cash into the for seeable future. They may be in a position to increase dividends.
H3: For large, mature, and declining firms, dividends will significantly predict shares repurchased.
Non-technology firms, are large service firms which are cash-constrained after paying for acquisitions. Their cash flow becomes negative, given that they have to fund acquisitions or invest in the research and development of acquisitions partly with cash. The balance of the acquisition will be funded through share repurchase. In other words, option refunding is the basis for stock repurchase in non-technology firms.
H4: For non-technology firms, decreases in cash flow, along with increases in investment in acquisitions, or the research and development of target firms will significantly predict shares repurchased.
Some of the large, mature manufacturers may be too cash constrained to fund share repurchase after dividend payouts and investment in positive NPV projects. Such firms may employ cash flow from depreciation tax shields to fund repurchase.
H5: For large mature firms, increases in depreciation may predict the decision to repurchase shares.
DOI: 10.4236/me.2018.95061 972 Modern Economy H6: For introductory firms, decreases in cash flow, depreciation and research and development of acquisitions may predict the decision to repurchase shares.
Growth firms have progressed beyond the introductory stage, but wish to ex-pand market share by risky acquisitions. Risk is likely to be market risk, affecting the broad market, which is less uncertain than the firm-specific risk of the star-tup. Market risk increases returns, fulfilling the growth objectives of these firms. Any excess cash remaining after funding the purchase of acquisitions may be used to repurchase shares.
H7: At growth firms, increases in market risk and investment in acquisitions are determinants of the share repurchase decision.
The technology sector consists of both large and small firms engaged in chip manufacturing, app development, smartphones and accessories, etc. Such prod-ucts require significant investment in research and development either in-house or through acquisitions. The stream of technology-intensive product or service innovations is likely to generate sales at high margin, so that operating income grows rapidly boosting stock prices. Management may wish to be compensated in cash or future acquisitions may be funded through stock mergers, suggesting that option refunding may be the underlying motivator to repurchase shares.
H8: In the technology-sector, research and development, acquisitions, re-search and development of acquisitions, revenue and operating income are de-terminants of the share repurchase decision.
US firms had stockpiled $1.2 trillion in cash as of 2017, in overseas accounts to avoid paying a 33% corporate tax rate ([18]). This cash hoard stimulated re-search and development for new product development to create innovative products would stimulate future profitability and revenue growth. This positive signal of increased investment in research and development leading to increases in future net income and revenue growth may be complemented by share re-purchase to increase earnings per share during the following quarter.
H9: Research and development expense explains the share repurchase deci-sion in firms with large amounts of overseas cash.
indi-DOI: 10.4236/me.2018.95061 973 Modern Economy vidual investor, being unaware of this volatility, may include this risky security. Institutional portfolios may thus outperform the market. After these portfolios have been created, shares of such profitable firms may be repurchased to further boost earnings per share and short-term security returns. [20] observed that in-stitutional investor portfolios outperformed their control group counterparts by 2% - 4% prior to the repurchase announcement.
H10: Institutional ownership results in earnings before interest and taxes, and dividends significantly influencing the share repurchase decision.
There is a consideration of the time horizon over which outcomes are meas-ured. If the time horizon is the forthcoming quarter, share repurchases may be successful in increasing EPS. If the time horizon is 1-5 years in the future, merely reducing the equity base may not be sufficient to increase earnings, i.e. the firm must provide evidence of profitability through growth in sales, the development of new products, or the exploration of new markets. Empirically, studies have found some evidence that the market price of common stock reacts positively to stock repurchases in the short-term, but not the long-term ([21]).
H11: Share repurchase increases earnings per share contemporaneously, with net income predicting earnings per share 1 year after share buyback, and reve-nue predicting earnings per share 5 years after share buyback.
3. Methodology
3.1. Sample and Data Collection
The income statements and balance sheets of firms contained in the entire data-base of Standard and Poor’s COMPUSTAT were extracted for the 2004-2015 pe-riod, during which share repurchase accelerated and data completeness was as-sured. Firms with incomplete information were filtered out of the sample. The remaining firms were split into subsamples of 67 - 10,773 firms. A full listing of subsamples by size may be found in Table 2. Subsamples were created on the basis of 1) size (total assets > the median were termed “large,” while total assets < the median were designated as “small,” 2) product life-cycle, (firm missions and descriptions categorized them as “introductory,” “growth,” “maturity,” and “de-cline”), 3) technology intensity (firms with SIC codes in the technology sector, designated as “technology-intensive,” and those with non-technology SIC codes designated as “non-technology-intensive”), 4) the firms with an overseas cash hoard identified by [18] designated as “overseas cash,” and 5) firms with “insti-tutional ownership” designated as such.
3.2. Hypotheses Testing
Variables were extracted from both income statements and balance sheets (see
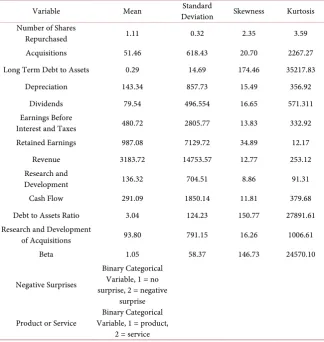
Table 1 for descriptive statistics of variables).
3.3. Equations
DOI: 10.4236/me.2018.95061 974 Modern Economy Table 1. Descriptive statistics of determinants of share repurchase decisions (in $ bil-lions).
Variable Mean Deviation Standard Skewness Kurtosis Number of Shares
Repurchased 1.11 0.32 2.35 3.59 Acquisitions 51.46 618.43 20.70 2267.27 Long Term Debt to Assets 0.29 14.69 174.46 35217.83
Depreciation 143.34 857.73 15.49 356.92 Dividends 79.54 496.554 16.65 571.311 Earnings Before
Interest and Taxes 480.72 2805.77 13.83 332.92 Retained Earnings 987.08 7129.72 34.89 12.17
Revenue 3183.72 14753.57 12.77 253.12 Research and
Development 136.32 704.51 8.86 91.31 Cash Flow 291.09 1850.14 11.81 379.68 Debt to Assets Ratio 3.04 124.23 150.77 27891.61 Research and Development
of Acquisitions 93.80 791.15 16.26 1006.61 Beta 1.05 58.37 146.73 24570.10
Negative Surprises
Binary Categorical Variable, 1 = no surprise, 2 = negative
surprise
Product or Service Variable, 1 = product, Binary Categorical 2 = service
1 2 3 4
5 6 7 8 9
10 11 12 13
14 15
SHBYt ACQt DEPt DIVt EBITDAt
RETt REVt RDt CFt RDACQt
BETAt LTDAt DAt NGt
PSt INSTOWNt
α β β β β
β β β β β
β β β β
β β
= + + + +
+ + + + +
+ + + +
+ +
(1)
SHBYt = Binary coded dichotomous variable with value = 1 for firms that re-purchased shares and value = 9 for firms that did not repurchase shares; ACQt= Value of acquisitions; DEPt = Depreciation expense; DIVt = Dividends; EBITDAt = Earnings before interest and taxes; RETt = Retained Earnings; REVt = Reve-nue; RDt = Research and development expense; CFt = Cash flow; RDACQt = Re-search and development expense of acquisitions; BETAt = Beta coefficient; LTDAt = Long-term debt to assets; DAt = Debt to assets; NGt = Negative sur-prises, 1 = no surprise, 2 = negative surprise; PSt = Product or service, 1 = prod-uct, 2 = service; INSTOWNt = percentage of institutional ownership.
All variables were logarithmically transformed. Variables with coefficients β1
to β10 were employed to test the hypotheses. Control variables such as long term
[image:9.595.211.536.102.445.2]DOI: 10.4236/me.2018.95061 975 Modern Economy of negative surprises may repurchase shares to achieve a positive surprise to boost stock returns as may mature service firms who wish to be taken over. Hy-pothesis 11 was tested by an ordinary least squares (OLS) regression of contem-porary EPS or 1-year EPS, or 5-year EPS on the number of shares repurchased, contemporaneous net income and contemporaneous revenue (see below). Ro-bustness checks were performed by repeating the regressions for the entire pop-ulation, with comparable results to those of subsamples.
1 2 3
EPSCONTt= +α β SHBUYt+β NETINCt+β REVt (2)
1 1 1 2 3
EPS t+ = +α β SHBUYt+β NETINCt+β REVt (3)
5 5 1 2 3
EPS t+ = +α β SHBUYt+β NETINCt+β REVt (4)
EPSCONTt= EPS at time of repurchase; EPS1t+1 = EPS, 1 year after
repur-chase; EPS5t+5 = EPS, 5 years after repurchase; SHBUYt = Number of shares re-purchased; NETINCt = Net income at time of repurchase; REVt = Revenue at time of repurchase.
4. Results
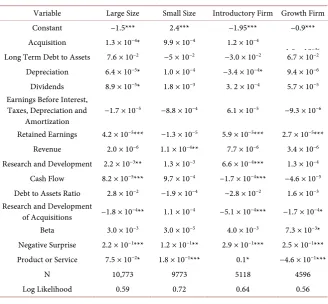
[image:10.595.210.539.424.728.2]As shown in Table 2, hypotheses 1, 2, and 4 - 11 were fully supported. Hypothe-sis 3 was partly supported for large and declining firms, though not for mature firms.
Table 2. Determinants of share repurchase decisions: logistic regressions of predictors. On the decision to repurchase or forego share buy backs.
(a)
Variable Large Size Small Size Introductory Firm Growth Firm Constant −1.5*** 2.4*** −1.95*** −0.9*** Acquisition 1.3 × 10−4* 9.9 × 10−4 1.2 × 10⁻⁴
1 8 10−4* Long Term Debt to Assets 7.6 × 10⁻² −5 × 10⁻² −3.0 × 10⁻² 6.7 × 10⁻² Depreciation 6.4 × 10−5* 1.0 × 10−4 −3.4 × 10−4* 9.4 × 10−6 Dividends 8.9 × 10−5* 1.8 × 10−3 3. 2 × 10⁻⁴ 5.7 × 10⁻⁵ Earnings Before Interest,
Taxes, Depreciation and
Amortization −1.7 × 10
−5 −8.8 × 10⁻⁴ 6.1 × 10⁻⁵ −9.3 × 10⁻⁶
Retained Earnings 4.2 × 10⁻⁵*** −1.3 × 10⁻⁵ 5.9 × 10⁻⁵*** 2.7 × 10⁻⁵*** Revenue 2.0 × 10⁻⁶ 1.1 × 10⁻⁴** 7.7 × 10⁻⁶ 3.4 × 10⁻⁶ Research and Development 2.2 × 10⁻³** 1.3 × 10⁻³ 6.6 × 10⁻⁴*** 1.3 × 10⁻⁴ Cash Flow 8.2 × 10⁻⁵*** 9.7 × 10⁻⁴ −1.7 × 10⁻⁴*** −4.6 × 10⁻⁵ Debt to Assets Ratio 2.8 × 10⁻² −1.9 × 10⁻⁴ −2.8 × 10⁻² 1.6 × 10⁻³ Research and Development
of Acquisitions −1.8 × 10⁻⁴** 1.1 × 10⁻⁴ −5.1 × 10⁻⁴*** −1.7 × 10⁻⁴* Beta 3.0 × 10⁻³ 3.0 × 10⁻⁵ 4.0 × 10⁻³ 7.3 × 10⁻³* Negative Surprise 2.2 × 10⁻¹*** 1.2 × 10⁻¹** 2.9 × 10⁻¹*** 2.5 × 10⁻¹*** Product or Service 7.5 × 10−2* 1.8 × 10−1*** 0.1* −4.6 × 10⁻¹***
N 10,773 9773 5118 4596
DOI: 10.4236/me.2018.95061 976 Modern Economy (b)
Variable Maturity Decline Technology-Intensive Non-Technology-Intensive Overseas Cash Institutional Ownership
Constant −1.6*** −3.5*** −1.7*** −2.1*** −0.52 −2.0*** Acquisition 1.1 × 10⁻⁴ 1.3 × 10−3* 3.2 × 10−4** 1.9 × 10⁻⁴*** −4.0 × 10⁻⁶ 1.5 × 10⁻³ Long Term Debt to Assets −7.3 × 10⁻² 3.4 × 10⁻² −1.5 × 10⁻¹ −3.3 × 10⁻³ −5.2 × 10⁻² −9.3 × 10⁻³
Depreciation 1.8 × 10−4* 2.8 × 10−3 9.1 × 10⁻⁵ −6.5 × 10⁻⁶ −3.8 × 10⁻⁵ 2.6 × 10⁻⁵ Dividends 2.0 × 10⁻⁴ 4.4 × 10⁻³*** 1.4 × 10⁻⁴ 1.0 × 10⁻⁴ 6.1 × 10⁻⁶ 2.1 × 10⁻⁴* Earnings Before Interest,
Taxes, Depreciation and
Amortization −8.0 × 10
−6 −1.0 × 10⁻³ −2.4 × 10⁻⁴*** 1.6 × 10⁻⁵ 1.3 × 10⁻⁶ −1.1 × 10⁻⁴*
Retained Earnings 5.0 × 10⁻⁵*** 1.8 × 10⁻⁴** 7.3 × 10⁻⁵*** 3.5 × 10⁻⁵*** 1.0 × 10⁻⁵*** 7.5 × 10⁻⁵*** Revenue 1.1 × 10⁻⁵** 2.2 × 10⁻⁴** 2.2 × 10⁻⁵** 5.0 × 10⁻⁶* −1.9 × 10⁻⁶ 4.4 × 10⁻⁵ Research and
Development 1.0 × 10⁻⁴ 1.3 × 10−3* 3.4 × 10−4** 3.2 × 10⁻⁴*** 4.7 × 10⁻⁵** 1.7 × 10⁻³ Cash Flow −2.0 × 10⁻⁴*** −1.0 × 10⁻³ −3.7 × 10⁻⁵ −7.7 × 10⁻⁵*** −1.5 × 10⁻⁵ −8.02 × 10⁻⁵ Debt to Assets −1.3 × 10⁻² −0.29* −4.9 × 10⁻² −9.0 × 10⁻⁴ 0.6* −6.9 × 10⁻⁴
Research and Development of
Acquisitions −1.0 × 10
−4 1.1 × 10−3* 03.8
× 10−4*** −2.2 × 10⁻⁴*** −7.6 × 10⁻⁶ −1.6 × 10⁻³
Beta 3.2 × 10⁻³* −1.2 × 10⁻³ 3.4 × 10−3* 8.1 × 10−4 0.10 −4.8 × 10⁻³ Negative Surprise 2.4 × 10⁻¹*** 3.5 × 10⁻¹*** 1.7 × 10⁻¹*** 3.4 × 10−1* 0.02 8.3 × 10⁻²* Product or Service −0.1 7.9 × 10⁻¹*** 7.6 × 10⁻² 1.1 × 10−1* 0.10 1.8 × 10⁻²
Institutional Ownership 9.2 × 10⁻³***
N 9018 1609 5420 16,802 67 8369
Average Likelihood 0.63 0.72 0.63 0.65 likelihood)23.2 (log a 0.63
*p < 0.05, **p < 0.01, ***p < 0.001.
DOI: 10.4236/me.2018.95061 977 Modern Economy Table 3. Results of OLS regressions of performance measured by contemporaneous, 1-year, and 5-year earnings per share (EPS) on the number of shares repurchased.
Variable Large Size Small Size Introductory Firm Growth Firm Constant −1.0***, −0.7***, −0.7*** −1.9***, −2.0***, −1.7*** −0.8***, −1.1***,−1.3*** −0.4***, −0.5***,−0.7*** Number of Shares
Repurchased 1.4 x 10⁻¹***, 0.1, 0.3, 0.3***, −0.9, −1.6 0.1**. 1.2, −0.1 0.2**, 0.5, 0.5 Net Income 3.3 x 10⁻¹***, 0.2***, 0.1*** 0.7***, 0.4***, 0.1* 0.4***, 0.1***, −0.0 0.5***, 0.2***,, 0.0
Revenue −7.8 x 10⁻²***, 0.1***,0.08*** −0.07***, 0.1, 0.1* −0.1***, 0.0, 0.2*** −0.1***, −0.0, 0.1** Maturity Decline Technology Sector Non−Technology Sector Constant −0.6***, −0.9***,−0.9*** −1.5***, −1.7***,−2.8*** −1.2***, −1.3***,−1.7*** −0.3***, −0.8***,−0.5*** Number of Shares
Repurchased 0.2***, −1.4*, 0.4 0.2, 1.5, 0.0 0.2***, −2.6*, −1.4 0.1***, 0.6, 0.8 Net Income 0.5***, 0.2***, 3.7 x 10⁻⁴ 0.4, 0.3*, 0.3 0.4***, 0.2***, 0.0 0.5***, 0.2***, 0.1*
Revenue −0.2***, 5.6 x 10⁻³, 0.1 −0.1***, −0.0, 0.2 −0.0, 0.0, 0.2*** −0.2***, −0.03, −0.05 Overseas Cash Institutional Ownership
Constant −4.2, −126.7***, 6.9 −0.2, −0.5***, −0.3* Number of Shares
Repurchased 0.05, 0.0, 0.0 0.1***, 0.5, 0.7 Net Income 0.9*, 19.5***, 0.9 0.5***, 0.2***, 0.1
Revenue 0.2, 26.1***, −0.5 −0.2***, −0.1, −0.1
firms are cash-constrained, using scarce cash to repurchase shares in an effort to appear cash-poor and unattractive in a takeover. In the technology sector, the impetus is on using research and development expenditure to drive the produc-tion of a stream of innovative products with growing revenue and operating in-come. Option refunding through the repurchase of shares provides share-based compensation to the managers of these firms. Certain technology-intensive firms with large overseas cash hoards may use these amounts as collateral to fund research and development spending. Excess cash may be used to repur-chase shares. Institutional investors use superior judgment to create portfolios with higher market return than those of retail investors. Share repurchase may increase EPS to provide further elevation of such portfolio returns. Share repur-chase had a fleeting, contemporaneous impact on EPS, which quickly dissipated over a 1-year and 5-year period (see Table 3).
References
[1] Raghavan, K.R. (2004) The Effects of Stock Repurchases on Long-Term Operating Performance in Banking Firms: An Empirical Study. Unpublished Doctoral Disser-tation. Cleveland State University, Cleveland.
[2] Grullon, G. and Michaely, R. (2004) The Information Content of Share Repurchase Programs. Journal of Finance, 59, 651-680.
https://doi.org/10.1111/j.1540-6261.2004.00645.x
DOI: 10.4236/me.2018.95061 978 Modern Economy [4] Benhamouda, Z. and Watson, R. (2010) A Research Note on the Determinants of
UK Corporate Share Repurchase Decisions. Applied Financial Economics, 20, 529-541. https://doi.org/10.1080/09603100903459857
[5] Jensen, M.C. (1986) Agency Costs of Free Cash Flow, Corporate Finance, and Ta-keovers. American Economic Review, 76, 323-329.
[6] Lang, L.H.P. and Litzenberger, R.H. (1989) Dividend Announcements, Cash Flow Signaling vs. Free Cash Flow Hypothesis? Journal of Financial Economics, 24, 181-191. https://doi.org/10.1016/0304-405X(89)90077-9
[7] Asquith, P. and Mullins, D. (1986) Equity Issues and Offering Dilution. Journal of Financial Economics, 15, 61-90. https://doi.org/10.1017/CBO9780511628610.007
[8] Comment, R. and Jarrell, G.A. (1991) The Relative Signaling Power of Dutch-Auc- tion and Fixed-Price Self-Tender Offers and Market Share Repurchases. Journal of Finance, 4, 1243-1271. https://doi.org/10.1111/j.1540-6261.1991.tb04617.x
[9] Baker, H., Gallagher, P. and Morgan, K. (1981) Management View of Stock Repur-chase Programs. Journal of Financial Research, 4, 233-247.
https://doi.org/10.1111/j.1475-6803.1981.tb00606.x
[10] Tsetsekos, G.P., Liu, F. and Flores, N. (1996) An Examination of Open Market Re-purchases: Cash Flow Signaling, Investments, and Tobin’s Q. Applied Financial Economics, 6, 9-17. https://doi.org/10.1080/096031096334420
[11] Barclay, M.J. and Smith, C.W. (1988) Corporate Payout Policy: Cash Dividends versus Open Market Purchases. Journal of Financial Economics, 22, 61-82.
https://doi.org/10.1016/0304-405X(88)90022-0
[12] Li, K. and McNally, W. (2007) The Information Content of Canadian Open Market Share Repurchase Announcements. Managerial Finance, 33, 65-80.
https://doi.org/10.1108/03074350710715818
[13] Abraham, R., Harrington, C.W. and Williams, A.A. (2011) Multimarket Trading at Merger Announcement and Completion. Journal of Derivatives and Hedge Funds, 17, 186-197. https://doi.org/10.1057/jdhf.2011.13
[14] Baker, H., Powell, P. and Veit, K. (2003) Why Companies Use Open Market Re-purchases: A Managerial Perspective. The Quarterly Review of Economics and Finance, 43, 483-504. https://doi.org/10.1016/S1062-9769(02)00151-5
[15] Brav, A., Graham, J., Harvey, C.R. and Michaely, R. (2005) Payout Policy in the 21st Century. Journal of Financial Economics, 77, 483-527.
https://doi.org/10.1016/j.jfineco.2004.07.004
[16] Henderson, B.J. and Zhao, B. (2014) More than Meets the Eye: Convertible Bond Issuers’ Concurrent Transactions. Journal of Corporate Finance, 24, 57-59.
https://doi.org/10.1016/j.jcorpfin.2013.10.001
[17] Miller, M.H. and Modigliani, F. (1961) Dividend Policy, Growth, and the Valuation of Shares. Journal of Business, 34, 411-433. https://doi.org/10.1086/294442
[18] Krantz, M. (2017) A Third of Cash is Held by 5 U.S. Companies. USA Today.
https://www,usatoday.com/story/money/markets/2016/05/20/third-cash-owned-5-u s-companies/84640704
[19] Jain, R. (1999) Essays on Agency Costs, Dividend Policy, and Corporate Ownership Structure. Unpublished Doctoral Dissertation, University of California at Los An-geles.
DOI: 10.4236/me.2018.95061 979 Modern Economy
https://doi.org/10.2307/3666337