Abstract—Current auto-focusing techniques are mostly active auto focus and passive auto focus. Active auto focus is common among digital cameras, which relies on the camera to use distance detection such as infrared or ultrasonic waves to measure the object distance for focusing adjustment. Passive auto focus, on the other hand, does not require extra distance detection device. After the received digital image is being analyzed and clarity scale is being calculated, the in-focus image is found with maximum clarity value. This study mainly focuses on auto-focusing algorithm. When the user chooses the interested area, discrete cosine transform and discrete wavelet transform are used to analyze and determine the image with the most clarity. Experimental results showed a better performance with discrete wavelet transform.
Index Terms—Discrete cosine transform (DCT), Dscrete wavelet transform (DWT), Standard deviation (STD), Auto-focusing.
I. INTRODUCTION
s technology progresses, digital camera became common and wide used among mobile devices such as cellphones, driving recorder, notebook. Attentions are being drawn to image quality. Compared with traditional camera, digital camera has advantages such as look-as-you-shoot, auto focus while choosing your own focus, and post production of images, etc.
Current auto-focusing have two kinds: active and passive [1], active auto focus mainly depends on distance detection such as infrared and ultrasonic to measure reflected signal from objects, and to adjust the lens with accurate parameters;
Passive auto focus directly analyzes digital image received by camera followed by calculating clarity scale.
In passive auto focus, focus measurement algorithm takes on an important part. In frequency domain, Discrete Cosine Transform (DCT) [7] and Discrete Wavelet Transformation (DWT) [8] are used in focus measurement frequently. Baina et al. believe that the best focus and aperture can be determined by DCT [1]. Lee et al. proposed that the new calculation method of focus value is based on high frequency value of DCT, which is a robust measurement [2]. Widjaja et al. proposed that by enhancing image edge features with DWT, the focus position can be estimated according to
Chu-Hui Lee is with the Department of Information Management, Chaoyang University of Technology, Wufong Township Taichung County, 41349 Taiwan (R.O.C.). Phone: 886-4-23323000 ext 4388;
fax:886-4-23742337; e-mail: chlee@ cyut.edu.tw.
Tsung-Ping Huang is with the Department of Information Management, Chaoyang University of Technology, Wufong Township Taichung County, 41349 Taiwan (R.O.C.). E-mail: [email protected].
spectral intensity [3]. Ardizzoni et al. dissect the image into several sub-bands after DWT transformation, and then important information will be extracted with brightness and saturation from wavelet coefficients, which can be used as basis for recognition [4]. From the above literatures, DCT and DWT are both closely related to focusing technique in camera.
This study focuses on comparison passive auto-focusing algorithm based on DCT and DWT. Images are first transformed through DCT and DWT, and then the image with the best clarity is found by standard deviation formula. This paper is organized as follows: Section 2 introduces the basic concepts of DCT, DWT, and standard deviation; Section 3 shows process chart of this study; Section 4 gives experimental results; conclusion are finally made in Section 5.
II. RELATEDWORK
This study focuses on comparison passive auto-focusing algorithm based on DCT and DWT. Images are first transformed through DCT and DWT, and then the image with the best clarity is found by standard deviation formula.
A. Discrete Cosine Transform
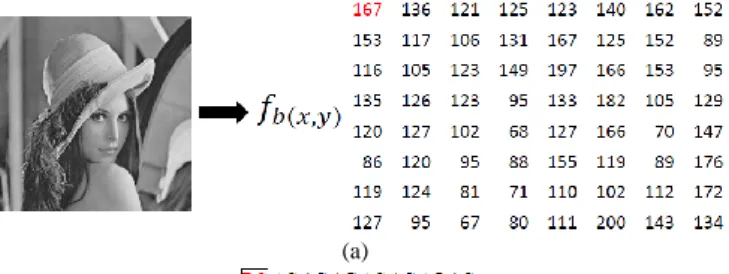
DCT transforms spatial domain into frequency domain, and frequency domain includes low and high frequencies as shown in Figure 1. The low frequency formed on upper left corner is Direct Current (DC) coefficient and the rest is alternate current coefficient. Human eyes are more sensitive to low frequencies in frequency domain, so low frequency area is considered important. DCT input format is a spatial matrix of 8 by 8, where output is a frequency coefficient matrix of 8 by 8.
(a)
(b)
Fig. 1.The DCT transforms; (a) The spectrum matrix of example; and (b) the coefficients of the DCT blocks of 8 x 8.
Comparison of Two Auto Focus Measurements DCT-STD and DWT-STD
Chu-Hui Lee and Tsung-Ping Huang
A
B. Discrete Wavelet Transformation
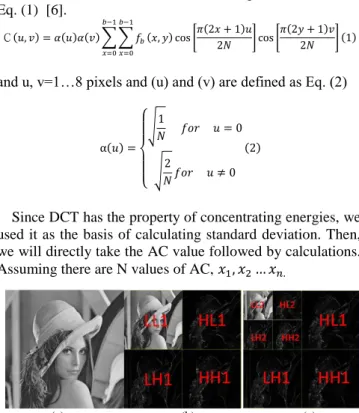
DWT is similar to DCT since they both are transformation technique to convert spatial domain into frequency domain [5]. When an image is treated with DWT, the generated information consisted of four sub-bands: low low frequency (LL), low high frequency (LH), high low frequency (HL), and high high frequency (HH) showed as Figure 2. LL belongs to low frequency, and low frequency coefficient is where the important information is embedded since human eyes are sensitive towards low frequency.
To images, low frequency provides similar image information. LH, HL, and HH are high frequencies; as high frequency coefficient increases, the image becomes rougher, which is the edge of image content. Since human eyes are less sensitive to high frequency, we cannot distinguish the change in coefficients. However to the image itself, high frequency contains a lot of detail information.
C. Standard Deviation
Standard deviation (STD) is implemented by Karl Pearson, mainly used for calculating dispersion degree of values based on statistic concepts. When standard deviation value is larger, it means that the difference between most values and their average values are larger; when standard deviation is smaller, then it means the values are closer to the average values. For example, two sets of values {0,3,5,7,10} and {5,5,5,5,5} with an average value of 5, but the first set has a clearly larger standard deviation. In general, standard deviation is mostly used for measuring fluctuations in fund. When the standard deviation increases, the investor’s profit will be more uncertain; when standard deviation is smaller, the profit will be stable.
III. FOCUS MEASUREMENT OF DCT AND DWT Lee found that images with more detail come with higher standard deviation in AC coefficients, so this standard deviation difference is used to design measurement for focusing [2]. Lee used only DCT to build the auto-focusing measurement. This study uses DCT and DWT to analyze the image with the best clarity. The image is performed with both DCT and DWT separately followed by finding the clearest image with standard deviation. Then, according to clarity value of each image, the image with the best clarity will be chosen.
A. Pre-processing
First, we capture each image with the same background anddifferent focusing distance form near to far, a total of k images are taken. We will then select the images with clear focus.
B. Region of Interest
The desired block in an image is called region of interest (ROI), in Figure 3, assuming its size is
C. Discrete Cosine Transform
DCT converts image from spatial domain into frequency domain. Through 2-dimensional DCT, the image can be divided into low frequency as DC coefficient and high frequency as AC coefficient. When users chose their ROI, gray scale conversion is performed on images with different
into frequency domain image, and k b DCT coefficient matrix will be obtained. DCT definition equation is shown as Eq. (1) [6].
C( ) ( ) ( ) ∑ ∑
( ) [ ( )
] [ ( ) ] ( )
and u, v=1…8 pixels and (u) and (v) are defined as Eq. (2)
( ) {
√
√ ( )
Since DCT has the property of concentrating energies, we used it as the basis of calculating standard deviation. Then, we will directly take the AC value followed by calculations.
Assuming there are N values of AC,
D. Discrete Wavelet Transformation
DWT methods have many types, which mainly convert image from spatial domain into frequency domain. This study uses Haar transform, Haar is one of the easiest method in DWT [9][10]. Haar converts pixel values into independent values, and then calculate each value by addition and subtraction to obtain the wavelet coefficient in frequency domain of images. Since the added values are increase gradually, and human vision has a high sensitivity to this part, the added part will be seen as low frequency while subtracted part will be seen as high frequency.
After first-order 2-D Haar conversion we get the four sub bands in Figure 4. LL consists of data similar to the original, and LH, HL, and HH consist of data with high variability from the original such as edges and contours. This paper uses LH, HL, and HH sub-bands as both the output of Haar wavelet transformation and the input of the next step.
(a) (b) (c)
Fig. 2. DWT transforms: (a) Original image; (b) One-level 2-D DWT; and (c) Two-level 2-D DWT.
Fig. 3.The ROI of user.
A B C D E F G H I J K L M N O P
(a)
(A+B)+(E+F) (C+D)+(G+H) (A-B)+(E-F) (C-D)+(G-H) (I+J)+(M+N) (K+L)+(O+P) (I-J)+(M-N) (K-L)+(O-P) (A+B)-(E+F) (C+D)-(G+H) (A-B)-(E-F) (C-D)-(G-H) (I+J)-(M+N) (K+L)-(O+P) (I-J)-(M-N) (K-L)-(O-P)
(b)
Fig. 4. 2-D Haar DWT: (a) The 4 4 Original image data; and (b) The result of 2-DWT Haar DWT.
E. Standard Deviation
In general images with more detail will cluster on some base frequency. Values of high frequency after DCT and DWT will concentrate on some basic frequencies. Therefore, we will use standard deviation to observe the distribution of high frequency value of images. The difference in standard deviation between clear and blurry images is shown in Table I.
The high frequency AC value in DCT and LH, HL, and HH in DWT each contains data with details. Larger AC value and these three sub-band values means more detail are contained. We filtered out the DC values and LL, the remaining AC value and LH, HL, HH are calculated with standard deviation, respectively. When the standard deviation is larger, it means some basic frequency has larger values, which also means the image is clearer. After DCT and DWT, amount of details are determined with standard deviation features. We directly take LH, HL, HH values to calculation, assuming there are m values as data input, then under DCT the n AC values are followed by substitution into Eq. (3) and (4), presenting in DCT as example.
∑
( )
√
∑( )
( )
F. Finding the clearest image
When we picked ROI, a total of k images went through DCT and DWT followed by STD calculation, respectively.
The k values of standard deviation are observed. The image with the largest STD is the one we want with the clearest focus shown as Figure 5. We denoted the proposed method as DCT-STD and DWT-STD respectively.
(a) (b) (c)
Fig. 5. (b)Best image.
TABLE I STD Comparison.
Method DWT DWT
Image
STD 0.0088
Blurred
0.0646 Clear
Method DCT DCT
Image
STD 0.0134
Blurred
0.1404 Clear
(a)
(b)
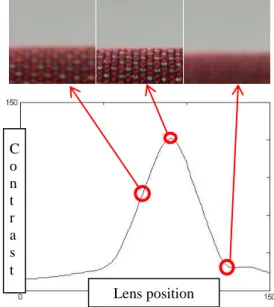
Fig. 6. Experimental image Lens position C
o n t r a s t
TABLE II
Clearest image numbered for different ROI
IV. EXPERIMENTAL RESULTS
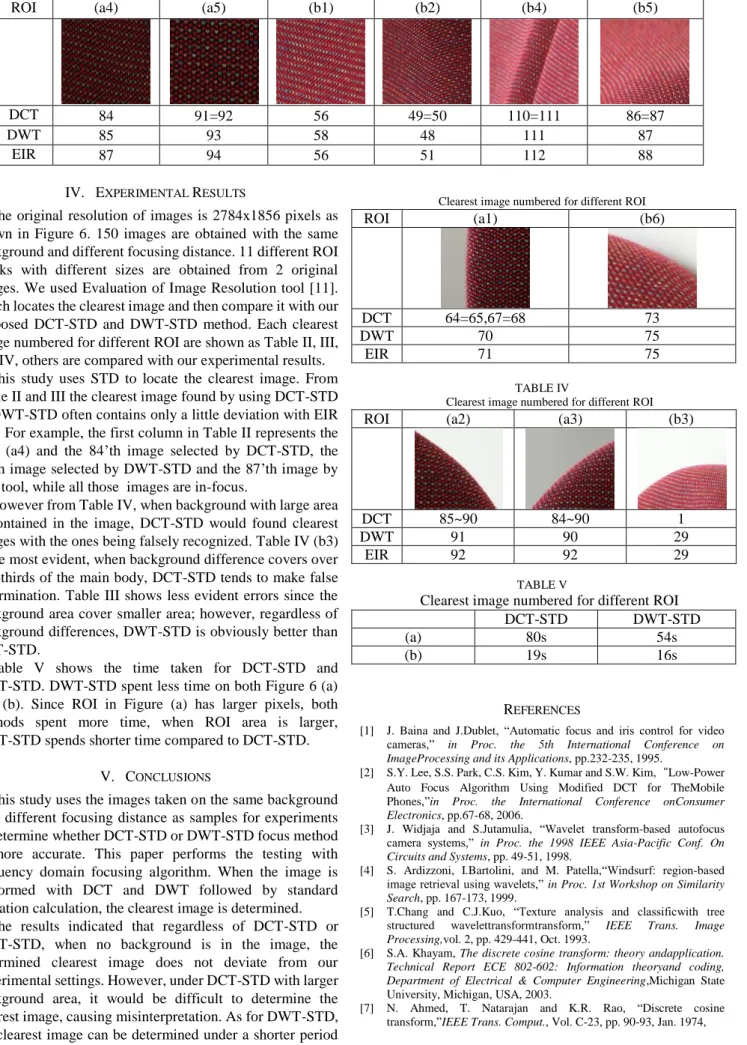
The original resolution of images is 2784x1856 pixels as shown in Figure 6. 150 images are obtained with the same background and different focusing distance. 11 different ROI blocks with different sizes are obtained from 2 original images. We used Evaluation of Image Resolution tool [11].
which locates the clearest image and then compare it with our proposed DCT-STD and DWT-STD method. Each clearest image numbered for different ROI are shown as Table II, III, and IV, others are compared with our experimental results.
This study uses STD to locate the clearest image. From Table II and III the clearest image found by using DCT-STD or DWT-STD often contains only a little deviation with EIR tool. For example, the first column in Table II represents the ROI (a4) and the 84’th image selected by DCT-STD, the 85’th image selected by DWT-STD and the 87’th image by EIR tool, while all those images are in-focus.
However from Table IV, when background with large area is contained in the image, DCT-STD would found clearest images with the ones being falsely recognized. Table IV (b3) is the most evident, when background difference covers over two-thirds of the main body, DCT-STD tends to make false determination. Table III shows less evident errors since the background area cover smaller area; however, regardless of background differences, DWT-STD is obviously better than DCT-STD.
Table V shows the time taken for DCT-STD and DWT-STD. DWT-STD spent less time on both Figure 6 (a) and (b). Since ROI in Figure (a) has larger pixels, both methods spent more time, when ROI area is larger, DWT-STD spends shorter time compared to DCT-STD.
V. CONCLUSIONS
This study uses the images taken on the same background with different focusing distance as samples for experiments to determine whether DCT-STD or DWT-STD focus method is more accurate. This paper performs the testing with frequency domain focusing algorithm. When the image is performed with DCT and DWT followed by standard deviation calculation, the clearest image is determined.
The results indicated that regardless of DCT-STD or DWT-STD, when no background is in the image, the determined clearest image does not deviate from our experimental settings. However, under DCT-STD with larger background area, it would be difficult to determine the clearest image, causing misinterpretation. As for DWT-STD,
TABLE III
Clearest image numbered for different ROI
ROI (a1) (b6)
DCT 64=65,67=68 73
DWT 70 75
EIR 71 75
TABLE IV
Clearest image numbered for different ROI
ROI (a2) (a3) (b3)
DCT 85~90 84~90 1
DWT 91 90 29
EIR 92 92 29
TABLE V
Clearest image numbered for different ROI
DCT-STD DWT-STD
(a) 80s 54s
(b) 19s 16s
REFERENCES
[1] J. Baina and J.Dublet, “Automatic focus and iris control for video cameras,” in Proc. the 5th International Conference on ImageProcessing and its Applications, pp.232-235, 1995.
[2] S.Y. Lee, S.S. Park, C.S. Kim, Y. Kumar and S.W. Kim,“Low-Power Auto Focus Algorithm Using Modified DCT for TheMobile Phones,”in Proc. the International Conference onConsumer Electronics, pp.67-68, 2006.
[3] J. Widjaja and S.Jutamulia, “Wavelet transform-based autofocus camera systems,” in Proc. the 1998 IEEE Asia-Pacific Conf. On Circuits and Systems, pp. 49-51, 1998.
[4] S. Ardizzoni, I.Bartolini, and M. Patella,“Windsurf: region-based image retrieval using wavelets,” in Proc. 1st Workshop on Similarity Search, pp. 167-173, 1999.
[5] T.Chang and C.J.Kuo, “Texture analysis and classificwith tree structured wavelettransformtransform,” IEEE Trans. Image Processing,vol. 2, pp. 429-441, Oct. 1993.
[6] S.A. Khayam, The discrete cosine transform: theory andapplication.
Technical Report ECE 802-602: Information theoryand coding, Department of Electrical & Computer Engineering,Michigan State University, Michigan, USA, 2003.
[7] N. Ahmed, T. Natarajan and K.R. Rao, “Discrete cosine transform,”IEEE Trans. Comput., Vol. C-23, pp. 90-93, Jan. 1974,
ROI (a4) (a5) (b1) (b2) (b4) (b5)
DCT 84 91=92 56 49=50 110=111 86=87
DWT 85 93 58 48 111 87
EIR 87 94 56 51 112 88
[8] M.Antonini,M.Barlaud,P.Mathieu, andI.Daubechies,“Image coding using wavelet transform,”IEEE Trans. Image Processing, vol. 1, pp.
205-220, Apr. 1992.
[9] K. Grochenig, and W. R. Madych, “Multiresoultion Analysis, Haar Bases, and Self-Similar Tilings of Rn,” IEEE Trans.Information Theory, vol. 38, pp. 556-558, Mar. 1992.
[10] M. Fujii, and W. J. R. Hoefer,“Field singularity correction in 2-D time domain Haar wavelet modeling of waveguide components,”IEEE Trans.Microwave Theory and Techniques, vol. 49, pp.685-691, Apr.
2001.
[11] WJ-DAVY, “Evaluation of Image Resolution 0.4 by WJW-Davy,”
[Online] Available:http://hi.baidu.com/wjwdavy/home.