The effect of data compression
on packet sizes in data communication systems
T. Bell and K. Pawlikowski University of Canterbury Christchurch, New Zealand
Abstract.
??????????
1 . INTRODUCTION
Measurements of real data traffic have been widely recognized as an important aid in performance modeling, design and development of
telecommunication networks. Newly emerging services and new applications of data communications demand more exhaustive measurement studies of data traffic to provide foundations for the development of
telecommunication networks of the next century. A survey of publications on data traffic measurements before 1988 was presented at the 12th ITC Congress [PAW88]. Most of the reported research activity in this area is user- or system-oriented and emphasises the dependence of data traffic on network architecture and/or communication protocols. Little attention has been paid to studying the influence of various data transformations on the statistical properties of data traffic.
In this paper we investigate the changes in length of data packets caused by data compression. A specific feature of this data transformation lies in its inherently random output rate. Even a regular stream of bytes is compressed into a bursty stream of bits. The output rate of a compressor will be lower than the input rate on average, but is unpredictable for each byte. Several input characters may cause only one bit to be added to the output, while the next character could generate several bits. At the packet level the sporadic output from the character level is moderated, but does not dissappear. The resulting burstiness in streams of compressed packets can be observed regardless of whether packets are of equal size before compression (as in the OSI architecture, where compression is applied to packets after they enter a packet switching network, that is, below the transport layer) or of random size (as in many local data communication systems) [BELL89]. In both cases some packets are compressed well, while others do not, and some of them may even be expanded. In this paper we are concerned with the changes caused by compression in streams of packets of random length in local interactive data communication systems. The measurement
It is generally known that data compression is able to save both storage space on computers and to increase the efficiency of data transmission. The latter application has a double benefit: not only is the cost of transmission reduced, but the effective transmission rate improves. Modern compression methods have the potential to achieve a two- to three-fold improvement in the bandwidth utilization. Sophisticated compression techniques are not as widely used as they might be because they are barely fast enough to keep up with the speed of transmission in modern data communication systems, and also because of the extra level of complexity that they introduce. Both of these problems are becoming less serious, although improvements in
communication technology are sufficiently rapid that bandwidth may not be a bottleneck in the future. Nevertheless, there are several good reasons for using compression. First, it offers a headstart on the current state of transmission technology; no matter how fast a system is, compression has the potential to increase the speed by a factor of two, or more. Availability of massive transmission capacities will lead to new services emerging. Parkinson’s law seems to apply; no matter what capacity is available, there will always be a need for more!
Compression is already used in a variety of data communications
applications. A relatively simple compression system makes facsimile services feasible [HURO80]. The Usenet electronic news system compresses news items to decrease transmission time. News data is passed from site to site, so it need only be compressed once, making for a very economical
system. The PCTERM system [AUHA85] compresses the data transmitted over a slow line between a computer and a remote terminal. This increases the apparent transmission rate of the line.
A significant advance in compression methodology has been the development of adaptive compression methods, which adjust themselves to changing characteristics of data currently being compressed. Such compression can be implemented at the system level where it is transparent to the user. This frees the end user from being concerned about representing the data
efficiently. In this paper we are consider exact compression methods, that is, methods where the decompressed data is identical to the data that was compressed. This is an obvious requirement in cases such as the text of a document or the balance of a bank account. Inexact compression methods are appropriate for data that originate from analogue sources, such as speech and pictures, but are not considered here.
memory for storing a code tree, even though the probability distribution may be changed at each step. The final level of compression depends on data modeling, i.e. on the method used to determine the probabilities of
compressed characters. The better the model, the better the compression that can be achieved.
One of the best modelling techniques is “prediction by partial matching” (PPM) [CLWI84]. The PPM compressor operates adaptively,assigning
probabilities to the input symbols on the basis of a context of the last few characters. For example, if the last character was a “q” then the probability of a “u” occuring next is very high. In other contexts a “u” might be assigned a significantly lower probability. These probabilities are fed to an
arithmetic coder which codes the symbols nearly optimally, that is, a
symbol assigned probability p is encoded in -logp bits, [WINE87]. The first prize for a 1988 Australian compression competition was shared by two programs based on PPM (the competition was run by Australian Personal Computer magazine). They differ only in some programming details. One of them them, called PPMc (distinguishing it from versions a and b) [MOFF88], is the version applied in the research project reported in this paper.
For a more detailed description and comparison of the compression methods mentioned above, readers are referred to [LEHI87], [BEWI89], [BECL89]. Our measurement experiments are described in Section 2 and the collected data and their analysis are presented in Section 3.
2. DESCRIPTION OF MEASUREMENT EXPERIMENTS
As already mentioned, in this paper we discuss the changes in packet sizes caused by data compression in a local interactive data communication network, with random data traffic before compression, i.e. assuming that packets are random sizes before compression. This is a typical situation, for example, for traffic between a computer and remote terminals, and in local database query systems. When the computer is echoing keystrokes, only one or two characters will be sent , while a menu selection or a response to a query might result in a burst of hundreds of characters. The measurement experiments reported here were a part of a research project on statistical properties of data compression carried out at the University of Canterbury in Christchurch, New Zealand. We have considered three types of traffic which were recorded in their uncompressed forms in two different interactive computer communication systems:
terminals (Visual 200) linked via an Annex Terminal Server and Ethernet (TCP/IP and Telnet protocol) to a local network of Sun computers.
Case B. Data traffic was measured for an interactive library database. The traffic was generated by and addressed to library users (borrowers) making queries to locate books. The terminals (Wyse 60, modified by General
Automation) were dispersed around university campus and linked to a
GA8830 computer located in the Computer Services Centre, via DEC 200 and 500 Terminal Servers and Ethernet (LAT protocol).
Case C. Data traffic was measured again for the interactive library system with the same equipment as in Case B. The traffic was generated by library staff, mainly for entering new books in the library database. The terminals were located in the university library.
In all three cases the data traffic was monitored for two days. During those time intervals we recorded 29993 packets in Case A, 84403 packets in Case B and 15454 packets in Case C. The traffic was monitored passively. Users were not aware that data traffic was under observation, and the monitor had no effect on the performance of the system being monitored. A gap in
transmission of 1/60 second was used to detect the end of a burst of bytes, and any such event was interpreted as the end of a packet. Relative
frequencies of recorded packet lengths are represented by the points in Figures 1a, 2a and 3a (on a log-log scale). One can see that by far the most packets contain just a few characters, although very long packets also occur (packets of over 1000 characters correspond to transmissions of full
screens of data).
The compressed size of a packet was evaluated from the recorded data
stream. The recorded packets were later compressed using the PPMc method. The resulted relative frequencies of (compressed) packet sizes are shown in Figure 1b, 2b and 3b.
One can observe that the size of large packets after compression is different in different applications. For example, in Case B large packets tend to compress better than average, while in Case A they are worse than average. This is because the library had standard menus that was frequently generated and resulted in large bursts, while in the Unix environment (Case A) large bursts were mainly caused by displaying a new piece of text on the terminal.
3. DATA ANALYSIS
Data compression is usually characterized by a compression ratio defined, for example, as the ratio of the mean packet sizes before and after
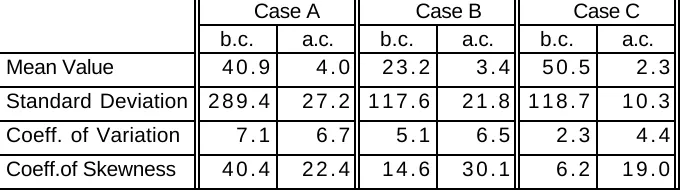
first moments of empirical distributions of packet lengths: the mean value, variance (or, equivalently, its square root, i.e. standard deviation), and third central moment. These results were used to determine the coefficient of variation (the ratio of the standard deviation and the mean) and the
coefficient of skewness (the ratio of the third central moment and the cube of the standard deviation).
The estimates of the mean packet size, standard deviation, coefficient of variation and coefficient of skewness, both for packet sizes before
compression (b.c.) and after compression (a.c.) are given in Table 1.
Coefficients of variation much greater than one, and even larger, positive coefficients of skewness characterizing packet sizes both before and after compression are typical of data traffic , see for example [PAWL81],
[MAMO85]. This indicates that both before and after compression we are within the same, hyperexponential class of probability distribution functions. Thus, the tails of the distributions of packet sizes are much "longer" than in the case of geometric distributions, as can be seen in
Figures 1, 2 and 3, where the geometric density functions are shown by the broken lines.
To analyse the influence of data compression on the distribution of packet sizes, we have calculated the ratios of the parameters, by dividing the value of a parameter before compression by the value of the same parameter after compression. The results are presented in Table 2. One can notice that the compression reduces the first two moments of packet size distributions regardless of the traffic model. The final effect of it is that the changes of coefficients of variations are much smaller than the changes on the first two moments. On the other hand, the changes of the third moments appear to be application-related, thus they can be either reduced or increased. In effect the ratio of the coefficients of skewness are also application-related, and can assume values either greater or smaller than one. These regularities can be summarized by the folowing conclusion:
Conclusion. Data compression reduces the mean value and variances of the packet size distribution, but the resulted distribution remains in the family of hyperexponential distributions, although the final skewness can be
increased or decreased .
Some of these techniques have been implemented in a software package, see for example [WHIT83], [JOHN90].
4.SUMMARY.
In this paper we have considered the nature of changes in packets' sizes when data compression is applied in local, interactive communication
systems. The compression was done using the most efficient from currently known data compressing algorithms. The authors plan to extend their
experiments to studying the statistical properties of data compression in an OSI environment.
ACKNOWLEDGEMENT
The authors are grateful to Craig Nevill for helpful discussions, and to the library staff of the University of Canterbury for
cooperation with monitoring their computer system. Much of the programming was carried out by Craig Nevill. Data collection was performed by David Jaggar.
REFERENCES
AUHA85 Auslander, M., Harrison, W., Miller, V., and M. Wegman. "PCTERM: a Terminal Emulator Using Compression". Proc. IEEE Globcom '85, IEEE Press, New York, 1985, pp. 860-862.
BELL89 Bell, T.C. " Bit Rate Fluctuation Caused by Data Compression in Data Communication Systems ". Proceedings of the 4th Australian Teletraffic Research Seminar, Bond University, Gold Coast, Australia, Dec.1989. BECL89 Bell, T.C. , Cleary, J.G. and I.H. Witten. "Text Compression". Prentice Hall, Englewood Cliffs, 1985.
BEWI89 Bell, T.C. , Witten, I.H. and J.G. Cleary. "Modelling for Text Compression". ACM Computing Surveys , 1989, pp. 557-591
CLWI84 Cleary, J.G. and I.H. Witten. "Data Compression Using Adaptive Coding and Partial String Matching". IEEE Trans. Communications, vol. 32, 4, 1984, pp. 396-402
FUJA71 Fuchs, E., and P.E. Johnson. "Estimates of distributions of Random Variables for Certain Computer Communications Models". Comms. of the ACM, vol.13, 1970, pp. 752-757
HUFF52 Huffman, D.A. “A Method for the Construction of
Minimum-Redundancy Codes”. Proc. of the I ERE, vol. 40 , 9,1952, pp.1098-1101 HURO80 Hunter, R. and A.H. Robinson. "International Digital Facsimile Coding Standards". Proc. of the IEEE, vol. 68, 7, 1990, pp. 854-867
JOTA90a Johnson, M.A., and M.R.Taaffe. "Matching Moments to Phase Distributions: Nonlinear Programming Approaches". Stochastic Models, vol. 6, 1990, pp. 259-281
JOTA90b Johnson, M.A., and M.R.Taaffe. "Matching Moments to Phase
Distributions: Density Function Shapes". Stochastic Models, vol. 6, 1990, pp.283-306
JOTA90b Johnson, M.A., and M.R.Taaffe. "Matching Moments to Phase
Distributions: Density Function Shapes". Stochastic Models, vol. 6, 1990, pp.283-306
LEHI87 Lelewer, D.A. and D.S. Hirschberg. "Data Compression". ACM Computing Surveys , vol. 19, 3, 1987, pp. 261-296
MAMO85 Marshall, W.T., and S.P.Morgan. "Statistics of Mixed Traffic on a Local Area Network". Computer Networks and ISDN Systems, vol. 10, 1985, pp. 185-194
MOFF88 Moffat, A. "A Note on the PPM Data Compression Algorithm".
Research Report 88/7, Department of Computer Science, University of Melbourne, Parkville, Victoria, Australia, 1988.
PAWL81 Pawlita, P.F. "Traffic Measurements in Data Networks: Recent Measurements Results and Some Implications". IEEE Trans. Comm., vol. 29, 1981, pp. 525-535
PAWL88 Pawlita, P.F. "Two Decades of Data Traffic Measurements: A
Survey of Published Results, Experiences and Applicability". Proc. of the 12th Int.Teletraffic Congress ITC'12, Torino, Italy, 1988, pp. 5.2A.5.1-5.2A.59
WELC84 Welch, T.A. "A Technique for High-Performance Data Compression". IEEE Computer, vol.17 , 6, 1984, pp. 8-19
WHIT83 Whitt, W. "The Queueing Network Analyzer". BSTJ, vol. 62, 1983, pp. 2 7 7 9 - 2 8 1 5
WINE87 Witten, I.H., Neal, R., and J.G. Cleary. "Arithmetic Coding for Data Compression". Comms. of the ACM, vol. 30, 6, 1987, pp. 520-540
ZILE77 Ziv, J. and A. Lempel. "A Universal Algorithm for Sequential Data Compression". IEEE Trans. Information Theory, vol. 23, 3, 1977, pp. 337-3 4 337-3
ZILE78 Ziv, J. and A. Lempel. "Compression of Individual Sequences via Variable-Rate Coding". IEEE Trans. Information Theory, vol. 24 , 5, 1978, pp. 530-536.
List of figures and tables
Table 1 Estimates of Packet Size Statistics Table 2 Ratios of estimates in Table 1
Figure 1 Relative frequencies of packet sizes, Case A (Unix environment) (a) before compression (b) after compression. Points show
observed frequencies, the dotted line shows a geometric
Figure 2 Relative frequencies of packet sizes, Case B (library borrowers). Figure 3 Relative frequencies of packet sizes, Case C (library staff). TABLE 1. Estimates of Packet Size Statistics
Case A Case B Case C b.c. a.c. b.c. a.c. b.c. a.c. Mean Value 4 0 . 9 4 . 0 2 3 . 2 3 . 4 5 0 . 5 2 . 3
Standard Deviation 2 8 9 . 4 2 7 . 2 1 1 7 . 6 2 1 . 8 1 1 8 . 7 1 0 . 3
Coeff. of Variation 7 . 1 6 . 7 5 . 1 6 . 5 2 . 3 4 . 4
[image:8.595.53.407.270.351.2]Coeff.of Skewness 4 0 . 4 2 2 . 4 1 4 . 6 3 0 . 1 6 . 2 1 9 . 0
TABLE 2. Ratios of estimates in Table 1
Case A Case B Case C
Means 1 0 . 1 6 . 9 2 1 . 7
Standard Deviations 1 0 . 6 5 . 4 1 1 . 5
Coefficients of Variation 1 . 1 0 . 8 0 . 5
Coefficients of Skewness 1 . 8 0 . 5 0 . 3