CULLINEY, Martin <http://orcid.org/0000-0002-7329-8675>, MOORE, Nicolas
<http://orcid.org/0000-0002-0829-5523>, COLDWELL, Michael
<http://orcid.org/0000-0002-7385-3077> and DEMACK, Sean
<http://orcid.org/0000-0002-2953-1337>
Available from Sheffield Hallam University Research Archive (SHURA) at:
http://shura.shu.ac.uk/25220/
This document is the author deposited version. You are advised to consult the
publisher's version if you wish to cite from it.
Published version
CULLINEY, Martin, MOORE, Nicolas, COLDWELL, Michael and DEMACK, Sean
(2019). Integrating English: Evaluation Report. Project Report. Education
Endowment Foundation.
Copyright and re-use policy
See
http://shura.shu.ac.uk/information.html
Evaluation Report
Integrating English
September 2019
The Education Endowment Foundation (EEF) is an independent grant-making charity dedicated to breaking the link between family income and educational achievement, ensuring that children from all backgrounds can fulfil their potential and make the most of their talents.
The EEF aims to raise the attainment of children facing disadvantage by:
• identifying promising educational innovations that address the needs of disadvantaged children in primary and secondary schools in England;
• evaluating these innovations to extend and secure the evidence on what works and can be made to work at scale; and
• encouraging schools, government, charities, and others to apply evidence and adopt innovations found to be effective.
The EEF was established in 2011 by the Sutton Trust as lead charity in partnership with Impetus (formerly Impetus Trust) and received a founding £125m grant from the Department for Education.
Together, the EEF and Sutton Trust are the government-designated What Works Centre for improving education outcomes for school-aged children.
The project was co-funded by The Bell Foundation and Unbound Philanthropy, as part of a funding round focusing on children with English as an additional language.
For more information about the EEF or this report please contact:
Jonathan Kay
Education Endowment Foundation 5th Floor, Millbank Tower
21–24 Millbank SW1P 4QP 0207 802 1653
[email protected]
Contents
About the evaluator ... 4
Executive summary ... 5
Introduction ... 7
Methods ... 14
Impact evaluation ... 22
Implementation and process evaluation ... 31
Conclusion ... 51
References ... 54
Appendix A: EEF cost rating ... 57
Appendix B: Security classification of trial findings ... 58
Appendix C: Logic model ... 60
Appendix D: Distribution of baseline and outcome measures ... 61
Appendix E: Primary analyses and calculation of effect size ... 64
Appendix F: IPE survey ... 66
Appendix G: Observation schedule for training visits ... 71
Appendix H: Interview schedule for school visits ... 73
Appendix I: Memorandum of Understanding ... 76
Appendix J: Fair Processing Notice ... 80
Appendix K: Fidelity measures ... 85
Appendix I: Baseline survey responses ... 86
About the evaluator
The evaluation team at Sheffield Institute of Education includes experts in trial design, analysis, implementation/process evaluation and linguistics/ESOL. The team has many years’ experience of conducting evaluation studies as part of the Education Endowment Evaluation evaluator panel, and for organisations including government departments, charities, and other policymakers.
As well as the report authors, the project team included Helen Donaghue, Ester Ehiyazaryan-White, Diana Ridley, and Roberta Taylor who undertook fieldwork as part of the Implementation and Process Evaluation, and Linda Bray who was the project administrator. The report authors would also like to acknowledge the involvement of our team of test invigilators.
Executive summary
The project
The Integrating English programme aimed to improve the writing ability of Year 5 and 6 pupils through a structured CPD programme that provided teachers with linguistic and pedagogical strategies. All students were expected to benefit, but the greatest impact was expected on EAL pupils. The programme was centred on LiLAC, a training course that is widely used in Australia, which emphasises the importance of recognising differences between genres of text, using a ‘teaching and learning cycle’ to scaffold language, the ‘register continuum’ (thinking about the ‘what’, ‘who’, and ‘how’ of communication), and the relationship between spoken and written language.
The intervention spanned two years. In the first year, Year 5 teachers were trained for five days in the spring term before producing schemes of work which incorporated the training. These were delivered to pupils in the summer term of Year 5. During this summer term and the following autumn term, Year 6 teachers were then trained for five days before designing and delivering schemes of work to the same students, now in Year 6.
This was a randomised controlled trial involving 91 schools. Schools were randomly allocated to either receive the Integrating English programme, or to be in a ‘business as usual’ control. The process evaluation included observations of teacher training, case study visits to schools, and analyses of schemes of work. The trial took place between October 2016 and July 2018. The programme was developed and delivered by Enfield LA School Improvement Team, and was funded by the EEF, Unbound Philanthropy, and The Bell Foundation.
EEF security rating
This trial was an efficacy trial, which tested whether the intervention worked under developer-led conditions in a number of schools. It was a well-designed, two-armed randomised controlled trial, which was well powered. Twenty-four percent of the pupils who started the trial were not included in the final analysis because ten schools did not do the primary outcome test, and of the 80 schools remaining, 15% of their pupils did not sit the outcome test.
Additional findings
Children in the Integrating English schools made the equivalent of one months’ less progress in KS2 writing, on average, compared to the control schools. The same finding was also identified for EAL pupils. In addition, the trial found that Integrating English had a small negative impact on KS2 Reading, and KS2 Grammar, Spelling and Punctuation. However, none of these findings were statistically significant.
Only a minority of schools completed the full demands of the programme (including training, creating action plans and schemes of work). Case study interviews as part of the process evaluation did indicate that training was positively received by the vast majority of interviewees; most interviewees felt that training was comprehensive and efficient and reported that they had shared strategies with other teachers. Interviewees also described how easily the aims of the
Key conclusions
1. There is no evidence that Integrating English improved pupils’ KS2 writing outcomes. This result has a moderate to high security rating.
2. There is no evidence that Integrating English had an impact on the KS2 writing outcomes of pupils receiving free school meals. These results have lower security than the overall findings because of the smaller number of pupils.
3. There is no evidence that Integrating English improved EAL pupils’ KS2 writing outcomes. Although this was measured through a large subgroup analysis, these results have lower security than the overall findings because of the smaller number of pupils.
However, although most interviewees mentioned the key programme principles when asked, the process evaluation indicated that key principles were addressed variably; some key processes and principles may not have been fully understood or delivered in the classroom. Exploratory analysis did not find additional benefit for pupils in schools that completed the full demands of the programme. The small numbers of pupils and non-random nature of the schools that were compliant mean that this finding should be treated with caution.
The process evaluation identified that schemes of work may be a useful mechanism for enacting professional development. While they were variably produced in this intervention, they may have the potential to act as a bridge between training and practice.
Cost
If delivered in geographical hubs, as in this trial, the average cost of the intervention is around £3 per pupil, per year when averaged over three years. Initial costs include training and buying the LiLAC manual, both of which are one off costs in the first year. Schools also need to meet the cost of staff cover for six days per participating teacher (12 days in total), for a Year 5 and Year 6 teacher. There are no ongoing costs associated with delivery. If an individual school wished to deliver the programme in a non-hub based model, due to higher training costs, the programme would cost around £21 per pupil, per year.
Impact
Summary of impact on primary outcome
Outcome/ Group
Effect size (95% confidence
Interval)
Estimated months’ progress
EEF security rating
No. of
pupils P value
EEF cost rating
KS2 Writing -0.05 (-0.21; +0.12) -1 month 3,607 0.577
£
£ £ £ £
KS2 WritingEAL pupils -0.06 (-0.25; +0.12) -1 month N/A 1,978 0.517
£
£ £ £ £
KS2 WritingIntroduction
Background evidence
Accurate and appropriate communication in English is recognised as a key performance indicator in education at primary and secondary level, and, of course, is the language of instruction in the English education system. Recognition of this has led to the introduction of policies creating targets for spelling and grammar tests at KS2 and GCSE English at KS4. Over the last ten years, debate on the role of grammar in the curriculum in U.K. schools has shifted from whether it should be taught to how it should be taught (Locke, 2010; Myhill and Watson, 2014). Students with English as an Additional Language (EAL) who demonstrate proficiency in English can close the attainment gap typically associated with students from minority backgrounds and exceed average attainment at school-leaving age (Strand, Malmberg and Hall, 2015; Demie and Strand, 2006). Similar discussions in Australia on minority students and grammar have prompted changes to the national curriculum, linking the teaching of grammar explicitly to social context and appropriateness (Derewianka, 2012). The resulting innovations in primary and secondary school grammar teaching have aimed to close the attainment gap for minority groups and significantly improve communication for all students (Rose and Martin, 2012; Macken-Horarik et al., 2015).
The intervention that is the subject of this report draws on curricular innovations in the Australian context. These innovations build on decades of pedagogic interventions and research in the use of language to improve literacy, particularly for disadvantaged students, combining the social realist sociology of Basil Bernstein (for example, 1990), a genre pedagogy approach to teaching and learning, and a systemic functional linguistic (SFL) perspective (Rose and Martin, 2012). From social realist sociology, the concept of ‘recontextualisation’ (Bernstein, 1975, 1981) is central to uncovering the strategies used by teachers and textbooks to ‘translate’ knowledge from disciplines into the primary and secondary classroom. Bernstein (1975) stressed the need to make pedagogies visible in order to reduce the advantages that students who share the dominant culture and linguistic habits of the school have over others. Genre pedagogy (Rose and Martin, 2012 and see below)—using the teaching-learning cycle of deconstruction–joint construction– independent construction—is one strategy that can make the recontextualisation of knowledge visible to all students in the class. Identifying patterns of variation of language with social context, or register, is a primary research goal of SFL (Halliday, 1978; Halliday and Matthiessen, 2004). General textual patterns (Martin, 1985), linguistic development in disciplines across primary and secondary subjects (Christie and Derewianka, 2008), and discipline-specific textual patterns and lexico-grammatical structures (Coffin, 2006; O’Halloran, 2004) have been identified as supporting genre pedagogy. It is these strands of research that have directly informed the LiLAC training programme.
The development of genre pedagogy in the Australian context has taken place since the late 1970s. Various reviews (Nebauer and Sungaila, 1980) have often focused on the responses of teachers to the programme, leading to the development of a ‘good enough grammatics’—a toolbox that teachers can work with in the classroom without demanding a high level of linguistic knowledge (Macken-Horarik et al., 2018). However, evaluations of genre pedagogy, particularly the LiLAC (Language in Learning Across the Curriculum) programme (Custance, Dare and Polias, 2012) at the centre of the current evaluation, have thus far typically been case-based (Pomagalska, 2019), have focused on either writing or reading (Rose and Acevedo, 2006), or have used measures that limit reliable evaluation (Coffin, Acevedo and Lövstedt, 2013). The current project, Integrating English, is consequently the first large-scale (multi-site, multi-region) evaluation of a general implementation of genre pedagogy outside of Australia.
was negotiated to offer what was considered a fair chance for the programme to have an effect in a comparable context to control schools. Primary schools were chosen because they appear to provide greater comparability across contexts. This efficacy trial addresses the need for more robust evidence on how Integrating English works within the mainstream school system.
Intervention
The Integrating English programme is designed to improve the subject literacy and language pedagogy of teachers, and in turn improve the linguistic proficiency and communicative ability for all students. In this case, the programme was implemented with primary school teachers for the whole year group in treatment schools at Year 5 (summer term), in the first year of the intervention, and in Year 6 of the second year. The programme was expected to have greatest impact on EAL students, in turn leading to better learning across all school subjects for all pupils. The intervention is at school level so all children in the relevant year groups are taught using the Integrating English approach. All pupils were involved in testing except those whose parents indicated that they wished to withdraw.
The intervention is centred on LiLAC (Custance, Dare and Polias, 2012), a training course developed by Australian pedagogy and linguistics experts, widely used in Australia and owned by the Government of South Australia. The LiLAC course aims to enable teachers of any subject to adopt a functional approach to linguistics and grammar, aiming to break down the process of teaching the language of a subject to all pupils. It treats communication in academic subjects as a matter of ‘learning how to mean’ using the semiotic resources available to that subject; students learn through language, thus language learning is central to learning in all subjects(Halliday, 1993). A language has the potential to mean in all the social contexts that are (re)produced in a culture. One person’s use of language will reflect the cultural contexts where they are able to use linguistic resources to make meaning, whether this may be considered a first, second, or additional language, and so all learning is the expansion of a person’s potential to mean (Matthiessen, 2006). Central to this language-based approach to learning is the insight that language varies according to social context in conventional ways to create socially-recognisable ‘genres’ that achieve an established social purpose. Within a social semiotic theory of language, it is possible to identify these genres, including academic and pedagogic genres, and correlate the features of different social purposes with linguistic features (Martin, 1985). Social semiotic language programmes such as Integrating English encourage teachers to focus on language features and meanings that are made in each school subject. For example, teachers may focus on the generic and grammatical features of verbal art and everyday rhetoric (English); classification, experimentation, and reporting (science); recounts and causation (history); or problems, explanations, and proofs (mathematics), and so on (Coffin, 2006; O’Halloran, 2004).
Key to determining the literacy demands of school subjects is the register expected from students—or the variation in the Field (the ‘what’), the Tenor (the ‘who’), and the Mode (the ‘how’) of any communication (Halliday and Hasan, 1989). To respond appropriately within a social context, it is useful for students to think about where on a continuum the language of a text should be positioned—between the technical or abstract and the everyday or concrete; between the informal or personal and the formal or impersonal; and between the spoken or here-and-now and the written or decontextualized—to produce the text’s Field, Tenor and Mode, respectively (Custance, Dare and Polias, 2012). One pedagogic outcome of this perspective on language is the critical variations in language between spoken and written modes which enable the vernacular of pupils in any classroom to be valued in its own right but to be available for comparison with formal varieties. In suitably-designed pedagogic tasks, this distinction encourages students to speak in order to write (talk-as-process) or write in order to speak (talk-as-performance). As a consequence of this rich theory of the role of language as a social semiotic, the Integrating English programme highlights four key principles that successful participants are expected to understand and implement: the varieties of genre in texts in school subjects, the teaching-learning cycle, the register continuum, and structured talk (‘talk-as-performance’ or ‘talk-as-process’). In addition, the Integrating English programme provides strategies for understanding and responding to the needs of EAL students in mainstream classes in the U.K. context, offering teachers a range of ready-to-use tips and techniques. During the intervention, teachers and trainers regularly referred to LiLAC techniques and strategies, whether they were part of the original LiLAC programme or variations introduced by the Integrating English programme. Through explorations of what it feels like to be surrounded by an unfamiliar language and discussions around the use of the child’s first language in the mainstream classroom, teachers were made aware of different responses to EAL students in class. Classroom activities that are introduced and often experienced include dictogloss, where a text is dictated at normal reading speed enough times for students to write down key words and ideas, but not enough to replicate the original text (Prince, 2013). Students then build these notes into a complete text of their own before finally comparing to the original to notice any differences in structure.
[image:10.595.160.430.99.378.2]The Integrating English course was delivered by qualified teacher trainers recruited by the Enfield programme team. Five one-day accredited modules were attended by teachers in person, with readings and practical homework tasks between each session. Training was delivered through five regional ‘hubs’ using non-school venues, with teachers
North East, (4) Leicester and Peterborough, and (5) Cambridgeshire and Norfolk. The hub areas were not decided in advance but arranged once recruitment was complete to account for the location of schools signed up to the trial. LiLAC training is an integral part of the Integrating English programme, but it is adapted to the U.K. context and supplemented by ongoing contact and support from trainers via email and FRONTER,1 the online virtual learning
environment (VLE) chosen by the delivery team specifically for this project (following successful implementation during the pilot programme), which is also used as a file-sharing resource for all teachers and trainers on the project. In addition, during the latter stages of training (on day five of the training), schemes of work (SoWs) are developed by trainees and trainers, based on learning from the Integrating English programme. Teachers are required by the programme to develop further SoWs back at their schools. Teaching based on these schemes of work then takes place in normal classroom time.
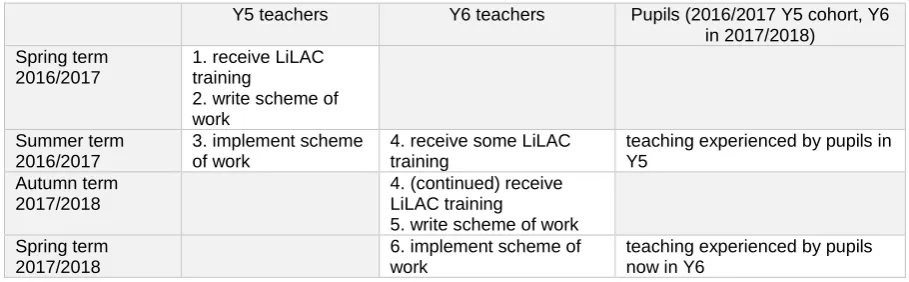
The intervention spanned two school years, as detailed below in Table 1. Phases one to three were aimed at Y5 teachers and classes. Phases four to six repeated these phases but were aimed at Y6 teachers and classes.
Phase 1 started for cohort 1 in January 2017 and involved two or more teachers (in Y5 in the first instance) from each school undertaking Integrating English training. The entire Integrating English course including training, readings, and tasks equated to approximately 50 hours of professional development for the teachers over the school term. Phase 2 followed the training, and again took place over half a term. Y5 teachers produced schemes of work informed by the Integrating English course, again supported by trainers. Phase 3 began, for cohort 1, after Easter. During the summer term, Y5 pupils in the two classes taught by the participating teachers were taught using methods based on the scheme of work developed in the previous phase.
Phase 4, starting while Phase 3 was running, comprised Integrating English training for the teachers with Y6 classes (the same cohort of pupils, but in the next academic year) in 2017/2018. This started in June 2017 and was completed at the start of the 2017/2018 Autumn term (see Table 1, below). Phase 5 saw schemes of work for Y6 classes developed over the remainder of the first half term of the 2017/2018 academic year. In Phase 6, Y6 pupils received teaching based on the Integrating English training and subsequent scheme of work for the Spring term 2017/2018. While teachers were not told to avoid using ideas from Integrating English in the Summer term 2017/2018, they were not required to plan at least 3 ‘LiLAC’ lessons per week and it was assumed the that term would largely be devoted to preparing pupils for standardised tests. The teaching differs from normal practice in that the scheme of work and related teaching is shaped by the genre pedagogy approach underpinning this intervention.
[image:11.595.70.525.599.740.2]In both Y5 and Y6, the intervention took place over two school terms. In term 1, teachers took Integrating English training and developed schemes of work. In term 2, teaching based on these schemes of work was delivered, although it is likely that some lessons using principles, techniques, or knowledge from Integrating English took place outside of term 2. The phasing of this programme across Y5 and Y6 as described above was adapted to fit the school calendar with the project timeline. This schedule also allowed for more teaching to be delivered using the schemes of work during the intervention period.
Table 1: Schedule of intervention delivery
Y5 teachers Y6 teachers Pupils (2016/2017 Y5 cohort, Y6 in 2017/2018)
Spring term 2016/2017
1. receive LiLAC training
2. write scheme of work
Summer term 2016/2017
3. implement scheme of work
4. receive some LiLAC training
teaching experienced by pupils in Y5
Autumn term 2017/2018
4. (continued) receive LiLAC training
5. write scheme of work Spring term
2017/2018
6. implement scheme of work
teaching experienced by pupils now in Y6
In total, pupils in the treatment schools experienced lessons (intended to be three or more lessons per week) designed on Integrating English principles for at least two terms—one in the summer term of Y5 and one in the spring term of Y6—with different teachers in nearly all cases and often in different subjects from Y5 to Y6. For example, a pupil may have experienced Integrating English lessons in science for one term with their Year 5 teacher and Integrating English lessons in history for one term with their Year 6 teacher. The programme logic model (Appendix 3), developed with the delivery team, lays out the implementation logic of the programme and the causal mechanisms behind it. There were two linked processes:
• the implementation of a structured training programme was designed to change teacher practices in the classroom via the development of a new scheme of work (causal process 1); and
• the changes in teacher practices were expected to lead to improved pupil literacy outcomes and an embedded change in school practices (causal process 2).
KS2 Writing was the original choice as primary outcome. However, changes to the marking scheme in 2016 meant that results would only be available in categorical format, with pupils graded at one of three levels. This rendered it unsuitable for this evaluation, which required a scale variable as a primary outcome. The decision was therefore taken to administer an additional writing test in the summer of 2018 to assess the impact of the intervention. However, the test was only completed in 80 of the 90 schools participating in the trial. Full details on the outcome measures are supplied later in this report. The original recruitment target of 100 schools was not met, and the trial commenced with 91 schools including control and treatment groups (one school withdrew from the project immediately after randomisation, leaving 90). Key characteristics of the trial include the levels of withdrawal and attrition of schools and the low rate of full compliance with the programme team’s requirements for completion of the treatment. These are discussed further below.
Evaluation objectives
This evaluation was led by the Sheffield Institute for Education and funded by the EEF, the Bell Foundation, and Unbound Philanthropy. A clustered randomised controlled trial design (CRCT) was adopted to determine whether the intervention improves attainment in schools, building on the findings of the pilot study into this intervention, using a robust CRCT approach to strengthen the existing evidence base. Another important part of the evaluation was to verify that the programme was properly implemented by teachers with sufficient understanding of the model of language. The impact evaluation assessed the effect of Integrating English on the writing ability of all pupils, with subgroup analysis on EAL pupils and pupils entitled to free school meals (FSM). Writing ability was measured through a writing test administered by the evaluators using KS2 Writing past papers. The process evaluation sought to establish how the Integrating English programme was implemented in schools and to elicit the views of teachers on the efficacy of the intervention.
The Impact Evaluation addressed the following questions:
1. What is the impact of the intervention on the language ability of Y6 pupils, as measured by a writing test (KS2 past paper) as primary outcome, with KS2 Reading and KS2 English Grammar, Punctuation and Spelling (GPS) as secondary outcomes.
2. What is the impact of the intervention on EAL students, as measured by a writing test (KS2 past paper), with KS2 Reading and KS2 GPS as secondary outcomes.
3. What is the impact of the intervention on FSM students, as measured by a writing test (KS2 past paper), with KS2 Reading and KS2 GPS as secondary outcomes.
The research questions for the Implementation and Process Evaluation (IPE) were:
1. How effective is the Integrating English programme in developing teachers’ knowledge and understanding of language, based on systemic functional linguistics, in different subjects? 2. What evidence is there that this knowledge and understanding leads to improved classroom
practice?
3. What evidence is there that this knowledge and understanding leads to improved pupils’ language performance in the classroom?
4. What issues of fidelity occur during the trial? 5. What does the trial indicate about scalability? 6. What are the intervention costs?
Protocol:
https://educationendowmentfoundation.org.uk/public/files/Projects/Evaluation_Protocols/Integrating_E nglish_Protocol_Amended_2017.11.07.pdf
SAP:
https://educationendowmentfoundation.org.uk/public/files/Projects/Integrating_English_SAP_2017.11. 07___FINAL.pdf
Ethics and trial registration
The study design was approved by the SHU ethics committee in 2016.
Recruitment for this trial was overseen by the developers, Enfield LA School Improvement Team, and took place at the school level. The developers were responsible for promoting the project and discussing it with schools during the recruitment period. Schools signalled their commitment to take part in the trial by returning signed copies of the Memorandum of Understanding (Appendix I) to the Enfield team who compiled a master spreadsheet with the details of each participating school. The file was updated and shared with the evaluators at regular intervals. The next step in the recruitment process was the collection of pupil data. Again this task was undertaken by the developers, who received the data directly from schools and forwarded the individual files to the evaluators for merging into a single dataset. In instances where the data was incomplete or contained errors, both the evaluators and developers liaised with schools in order to ensure that the necessary data was obtained. Cooperating to share the workload in this manner was crucial for successfully concluding the recruitment phase ahead of randomisation.
The trial is publicly registered under International Standard Randomised Controlled Trial Number (ISRCTN) ISRCTN44415239: http://www.isrctn.com/ISRCTN44415239
Data protection
data shared between the evaluation team and the organisation contracted to provide marking services consisted of pupil names and their schools. No other identifying information was shared, and no special category data was shared. The legal basis for processing personal data was research as a ‘Public Task’ in accordance with GDPR Article 6 (1e).
Project team
Evaluation team (all Sheffield Hallam University)
• Lead Director (Principal Investigator): Professor Mike Coldwell, Director of the Centre for Development and Research in Education
• Project manager and quantitative data analyst (Co-investigator):Dr Martin Culliney, Research Fellow
• Systemic functional linguistic expert and process evaluation lead (Co-investigator):Dr Nick Moore, Senior Lecturer
• Statistical consultant (Co-investigator):Sean Demack, Principal Research Fellow
• Process evaluation fieldworkers:Dr Helen Donaghue, Senior Lecturer; Dr Diana Ridley, Senior Lecturer; Dr Roberta Taylor, Senior Lecturer; Dr Ester Ehiyazaryan-White, Lecturer
Delivery team
• Project manager:Sharon Davies, Community Learning and Schools Programme Leader, Skills for Work Service, Enfield Council
Methods
Trial design
The impact evaluation design was a two-arm, school-level clustered randomised controlled trial (CRCT). School level randomisation was used as it is more practical for recruitment and implementation. It also eliminates the risk of overspill, which is crucial for ensuring robustness. The control condition was ‘business as usual’. Control schools were given £200 for taking part.
[image:15.595.64.527.319.531.2]The original plan to use KS2 Writing as the primary outcome was abandoned in Autumn 2016 due to changes in the way it is recorded in the National Pupil Database, as described above. It was decided between SHU, Enfield, and the EEF that a bespoke writing assessment should be conducted, with the scores collected in scale format. The agreement was to use a KS2 Writing past paper and use pupil scores on this assessment as the primary outcome measure. At this stage, it was also agreed that KS2 Reading would be used as an additional secondary outcome. This report presents results from the primary outcome and both secondary outcomes for each analysis model.
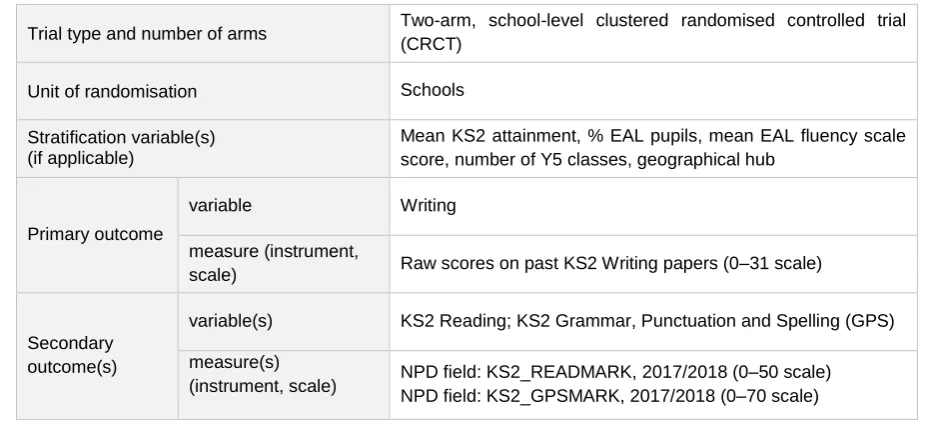
Table 2: Trial design summary
Trial type and number of arms Two-arm, school-level clustered randomised controlled trial (CRCT)
Unit of randomisation Schools
Stratification variable(s) (if applicable)
Mean KS2 attainment, % EAL pupils, mean EAL fluency scale score, number of Y5 classes, geographical hub
Primary outcome
variable Writing
measure (instrument,
scale) Raw scores on past KS2 Writing papers (0–31 scale)
Secondary outcome(s)
variable(s) KS2 Reading; KS2 Grammar, Punctuation and Spelling (GPS)
measure(s)
(instrument, scale) NPD field: KS2_READMARK, 2017/2018 (0–50 scale) NPD field: KS2_GPSMARK, 2017/2018 (0–70 scale)
Participant selection
from the training but agreed to continue participating in the trial, and their pupils were included in the analysis sample. Further detail on this is provided below.
Outcome measures
The baseline measure was the GL Assessment Progress Test in English (PTE), a standardised assessment of technical English skills.2 The Level 9 test was used, as appropriate for Y6 pupils. This
was preferred to KS1 test scores as EAL pupils are known to have relatively high levels of missing KS1 data (Strand et al., 2015:8). Among our analysis sample, a higher proportion of EAL pupils (15%) are missing KS1 data compared to 4% of non-EAL pupils, suggesting that reliance on KS1 scores for baseline measures would have reduced the sample size and potentially biased the results.
Baseline tests were taken between 31 October and 25 November 2016 and administered by the evaluation team. Pupils sat the test paper in schools and completed papers were returned to the evaluators by courier service before being sent to GL for marking. Results were sent to the evaluation team from GL in electronic format, with test papers destroyed after six months. The timeframe of the set-up period of the evaluation meant that it was not feasible to use the baseline scores in randomisation. Baseline scores were used only in analysis.
The primary outcome measure was writing, assessed through a test administered by the evaluators (using KS2 past papers from 2012) for all pupils in the target year group (starting in Y5, ending in Y6). A writing test to measure subject-based literacy was sought but no suitable age-appropriate standardised test could be identified. Of the available national tests, KS2 Writing was deemed most closely aligned to the intervention aims as described in the logic model; however, changes to the marking scheme in 20163 rendered it unsuitable for this evaluation as a more finely-graded measure
(continuous rather than categorical) was needed for the power calculations to hold true. Therefore, the decision was made to administer an additional writing test in the summer of 2018. After considering the options, it was agreed to use KS2 Writing past papers from 2012, marked by an organisation contracted by the evaluation team. This was judged by evaluator, developer, and funder to provide the best solution in terms of using an outcome measure to capture pupil progress over the intervention period. As discussed in the Limitations section (page 52), the Integrating English programme meant that teachers focused in their schemes of work on writing in specific subject contexts which varied by school and sometimes by year group meaning a stronger outcome measure would focus on the specific subject context(s) covered in each particular school. Since creating a set of bespoke measures would be both prohibitively expensive and would lack comparability across the sample, it was decided to use a general test.
The test papers were marked according to four different criteria, each of which had a maximum number of marks available. These were Sentence Structure and Punctuation (0–8 marks), Text Structure and Organisation (0–8 marks), Composition and Effect (0–12 marks), and Handwriting (0–3 marks), giving a total out of 31 marks. The combined raw scores were used as the primary outcome measure. The markers were all blind to study allocation.
The primary outcome assessment was only completed in 80 of the 90 schools participating in the trial. This test was not part of the original trial design and was only added once it became clear that the NPD would not provide a measure of writing attainment in adequate detail. It is likely that some schools did not appreciate the additional burden during the summer term and did not take part for this reason, although there is no evidence for this. The evaluators made repeated attempts to contact all schools in the lead-up to the testing period. Prior to that, several notifications were sent to schools to explain the testing requirements, with the developers also informing teachers from the intervention group at training
2 https://www.gl-assessment.co.uk/products/progress-test-in-english-pte/
sessions. Tests were carried out at a time agreed between the school and the evaluator so that invigilators could attend in each case. Some invigilators were supplied by an external contractor, others were recruited as temporary employees of the evaluator. The evaluation project manager personally visited five schools for this purpose. No invigilators reported any doubts over the integrity of the testing process.
The secondary outcomes were attainment in KS2 Grammar, Punctuation and Spelling (GPS) and KS2 Reading. Raw scores, as available from the National Pupil Database (NPD), were used for the impact analyses. These secondary outcome tests were marked externally as part of compulsory national KS2 testing and may therefore be seen as more methodologically robust, but are less theoretically aligned to capturing the pupil-level impact of the Integrating English intervention. All analyses are conducted using both secondary outcomes (see Analysis section for details).
Sample size
The original intention was to recruit 100 schools to the trial, with a minimum of ten EAL pupils per school. This recruitment target was calculated to support a MDES of 0.20 standard deviations for the EAL subgroup analysis, once a baseline covariate was included. This was also consistent with a MDES of 0.18 for all pupils (estimated 40 per school). However, the delivery team was only able to recruit 91 schools to the project, despite lowering the minimum number of EAL pupils from ten to eight. One school, which was randomised into the intervention group and informed of its allocation, withdrew from the trial after baseline testing and stated that it wanted no further involvement in any aspect of the project, leaving a total of 90. As a result, no outcome data was obtained for this school. Assuming the same details shown below in Table 4, this resulted in MDES estimates of 0.19 (all pupils) and 0.21 (EAL pupils).
Separate sample size calculations were not conducted for FSM pupils as this data was not available to the evaluators until after the intervention delivery was finished. Given the topic of the intervention, the priority for subgroup analysis was EAL pupils, so sample size calculations were only conducted to account for this group. Whilst an FSM subgroup analysis was undertaken, this was not determined by the Integrating English theory of change but is a standard requirement across all EEF evaluation trials as part of the EEF’s specified aim of severing the link between family background and educational attainment.
Randomisation
The MinimPy programme4 was used to allocate schools into the intervention and control groups using
minimisation with a random start. Five school-level variables were used to ensure a good baseline balance between the two groups. These were mean KS2 attainment, number of Y5 classes, percentage of EAL pupils, the number of EAL pupils in each of the categories on the fluency scale (introduced in 2016 comprising five categories of English proficiency, ranging from A, ‘New to English’, to E, ‘Fluent’),5
and geographical hub area. At the school level, a good baseline balance was achieved across all five minimisation variables and two additional variables—KS1 attainment and %FSM (see SAP and Table 7 below).
Analysis was not conducted blinded to randomisation. Due to the role of the main data analyst as a project manager for the trial, it would not have been feasible for allocation to remain hidden.
Baseline data collection entailed all pupils taking the Progress Test in English Level 9. This was completed between 31 October and 25 November 2016. Allocation using minimisation took place in the
week commencing 28 November and schools were informed of allocation on 30 November. Only pupils that completed the pre-test were considered for the randomisation.
Statistical analysis
A multilevel approach was taken to the analysis, with pupils clustered into schools as per the clustered trial design. Multilevel linear regression models were constructed for the primary and secondary outcome measures. The first model (Stage 1.1 as reported in the SAP) includes the GL PTE (Level 9) baseline (school centred) as a covariate at the pupil level. The GL PTE Level 9 was used as the baseline rather than using pupil-level KS1 data given the higher level of missing KS1 data for EAL pupils (Strand et al., 2015:8). The second model (Stage 1.2) includes both the pupil-level, school-centred GL PTE measure and school-level mean GL PTE scores as covariates. Including baseline covariates at both school and pupil levels results in lower MDES estimates than would be obtained with a single covariate at one of these levels. The model that includes prior attainment at just the pupil level is more reflective of approaches taken in other EEF evaluations and therefore the trial findings will be more directly comparable. The model that includes prior attainment at both pupil and school levels is included to reflect the original research design and power analyses for this trial.
The five school-level minimisation variables—school-level KS2 attainment, N classes, percentage EAL pupils, percentage pupils in each fluency category, and hub area—were included in Stage 2 of the analysis. The purpose of this analysis was to acknowledge the use of these variables in minimisation and to examine if and how their inclusion changed the estimated effect size for the impact of Integrating English. Including minimisation variables was intended to increase the precision of the estimates. While Stage 1.2 most closely follows the design decisions included in the power calculation, Stage 2 adds the minimisation variables to Stage 1.2. Results from Stage 2 are considered the headline results and are reported in the tables below for each analysis. In Appendix E, we report a full table containing results from all three models for the primary outcome measure to demonstrate fully the approach taken for all analyses. Additionally, this example model output is used to illustrate the steps taken to calculate the Hedges g effect size statistics from model coefficients.
Compliance with the intervention was defined by four criteria: • attendance at training events;
• attainment of certificate for completing the coursework—awarded only to individuals that attended at least 80% of training sessions (both of these first two items based on data provided by the delivery team);
• the quality of Schemes of Work; and
• Project Action Plans (these two items rated on a 0–3 scale by the evaluators, where a minimum score of two was required for an individual to be classed as compliant).
to investigate patterns in missing data on the primary outcome measure, a logistic regression model with not/missing as the outcome variable was estimated to examine variation according to the key pupil-level covariates used in the headline and exploratory analyses specified in the SAP. The missing data analysis also includes the secondary outcome scores as predictors to ascertain any relationship between attainment on KS2 Reading and GPS (combined to avoid multicollinearity) and missing data on the primary writing assessment.
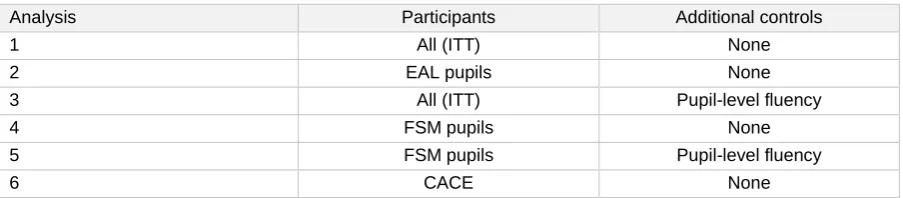
[image:19.595.73.525.241.340.2]Each set of analysis comprised the three models described above for the primary outcome and both secondary outcome measures. The tables presented below contain only results from the full headline models. There were six sets of analyses conducted; these are summarised in Table 3. Calculation of effect size is detailed in Appendix E.
Table 3: Summary of analysis stages as reported
Analysis Participants Additional controls
1 All (ITT) None
2 EAL pupils None
3 All (ITT) Pupil-level fluency
4 FSM pupils None
5 FSM pupils Pupil-level fluency
6 CACE None
Implementation and process evaluation
The IPE data collection was framed by an evidence-informed logic model (Coldwell and Maxwell, 2018) detailing the programme theory and indicating the intermediate outcomes, processes, and influencing factors underlying the intervention. The logic model, agreed with the delivery team in the early stages of the evaluation, is included in Appendix C. A set of methods were devised to address the IPE Research Questions (RQ) listed on page 12 of this report, as summarised in Table 4:
Table 4: Methods used for addressing each research question
RQ
Method (a) Survey (b) Training
observation
(c) Case Studies
(d) Monitoring data analysis
1 ✓ ✓ ✓
2 ✓ ✓
3 ✓ ✓
4 ✓ ✓ ✓ ✓
5 ✓ ✓ ✓ ✓
6 ✓
In more detail, the methods included:
[image:19.595.72.525.471.590.2]surveys. Topics included the teaching of grammar, the role of language across the curriculum, and the behaviour of EAL students in class. The post-intervention survey included questions on current teacher practice and changes over the previous months. A school-level response rate of 74% was achieved in the pre-intervention survey. However, the post-intervention survey obtained only ten responses from the 117 teachers who had also completed the pre-intervention survey. It was therefore decided that the data could not be used in the evaluation as there was no prospect of conducting meaningful comparisons.
(b) Observation of six training/CPD (Continuing Professional Development) events in total by evaluation team to examine the programme delivery in practice, and analysis of schemes of work. Implementation of the training programme was observed across the five hub areas, and all CPD sessions were observed in the training for either Y5 or Y6. The observers were all part of the process evaluation team and were experienced teachers and trainers. All observers had access to the LiLAC training manual and to the resources on the VLE. Observers used a prepared observation schedule (see Appendix G) aimed at finding evidence for the following key indicators of effective CPD (Maxwell et al., 2018):
• content focus of training;
• active learning in the training sessions;
• relevance to teachers; and
• claims made, and evidence provided, for the programme.
As part of the programme team’s delivery model, attendance was recorded for all participants, as well as completion of inter-session tasks. Only participants with 80% attendance and task completion were awarded CPD certification. This data was used by the evaluation team as part of the measures of fidelity to the training programme.
(c) To evaluate the process of the training and its implementation in schools, the team of experienced primary, EAL ,and ESL teachers and researchers that had observed the LiLAC training sessions visited schools in Y5 and Y6 to observe lessons, interview teachers and school leaders, and collect documentary evidence of implementation. Each researcher was allocated to one region.
Schools were invited to volunteer as case studies by email, and so self-selected for case study visits. A small proportion of schools in each region failed to respond to requests to take part in case studies, although there was not a consistent correspondence between the schools that responded and those that did well on measures of fidelity for the training programme. The research team visited a total of 14 schools: one school from each of the five regions following the Y5 training and two from all but one region in Y6. One region, Cambridgeshire and Norfolk, was under-represented by one school due to travel disruption for the planned school visit. At each school, researchers observed at least one lesson and interviewed the teacher of the lesson, often interviewed other teachers involved in the Integrating English project, and interviewed at least one school leader involved in the project.
where they understood that interviewees felt strongly about a particular issue. The interviews were transcribed, incorporated into NVivo Pro 11, and coded deductively (Saldana, 2011) using categories from the project logic model and from the primary objectives of the Integrating English training programme utilising a Framework Analysis approach (Smith and Davies, 2010) which involves an initial overall examination of the data, developing a framework of categories (in this case deriving from the logic model), and then coding to categories and finally interpreting the data. The categories focused on the four main principles identified by the programme team as the core objectives of the training programme: the content of the training programme, resulting changes in pupils, resulting changes in teachers, resulting changes in the school, support from training programme, support from school leadership, and interaction with other training and school objectives. All interviews were coded for the four main principles of training and this data included in analysis. In addition, interviews from Y6 teachers were coded using an open frame on broader issues of relevance to the study to ensure that the wider views of participants in the trial who were the most knowledgeable and experienced with regard to the intervention and the underlying principles were included. While some interview questions directed teachers and school leaders to discuss these issues, among others, interviews were coded so that mention of any of the categories could be coded at any time of the interview, and the topic as a whole or any part of the topic could be mentioned in order to be coded. Codings were then quantified and trends were identified across schools and regions.
(d) Analysis of monitoring data on attendance at events, completion of the training, and creation and implementation of action plans, schemes of work, and shared teaching materials were also undertaken. These were combined to develop an indication of fidelity to the training programme. Attendance at training sessions and completion of training tasks constituted completion of the LiLAC training programme. This measure was recognised by the programme team by the awarding of certificates of CPD to all qualifying teachers and leaders. Action plans and schemes of work (SoWs) represented an initial measure of compliance with the implementation of the training programme that could then be corroborated through case study visits to schools. Action plans and SoWs were rated against scales of quality, designed in consultation with the programme team. The scores provided a threshold of compliance with the expectations of the training providers. The VLE for the project was monitored during and after the programme to contextualise interview comments, but as the sharing of materials was not a requirement of the training, the data was not included in the evaluation.
Costs
Cost data was provided to the evaluation team by the developers. No cost data was collected directly from schools. Costs are calculated for two delivery models. Per pupil costs are based on 60 pupils per school. This assumption is made as schools were required to be two-form entry in order to join the trial. In calculating the costs of delivering the intervention, we present two scenarios: the school-based model where individual schools pay for external trainers, and the hub-based model where schools pool resources for teachers to be trained in group sessions. While schools choosing to use Integrating English may be unable to pool resources with others, the hub-based approach is more similar to that employed in this trial. Full details can be found in the costs section of this report.
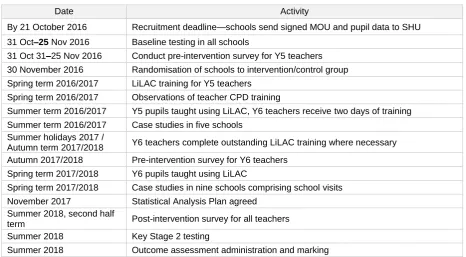
Timeline
Table 5: Timeline
Date Activity
By 21 October 2016 Recruitment deadline—schools send signed MOU and pupil data to SHU 31 Oct–25 Nov 2016 Baseline testing in all schools
31 Oct 31–25 Nov 2016 Conduct pre-intervention survey for Y5 teachers 30 November 2016 Randomisation of schools to intervention/control group Spring term 2016/2017 LiLAC training for Y5 teachers
Spring term 2016/2017 Observations of teacher CPD training
Summer term 2016/2017 Y5 pupils taught using LiLAC, Y6 teachers receive two days of training Summer term 2016/2017 Case studies in five schools
Summer holidays 2017 /
Autumn term 2017/2018 Y6 teachers complete outstanding LiLAC training where necessary Autumn 2017/2018 Pre-intervention survey for Y6 teachers
Spring term 2017/2018 Y6 pupils taught using LiLAC
Spring term 2017/2018 Case studies in nine schools comprising school visits November 2017 Statistical Analysis Plan agreed
Summer 2018, second half
term Post-intervention survey for all teachers Summer 2018 Key Stage 2 testing
Impact evaluation
Participant flow including losses and exclusions
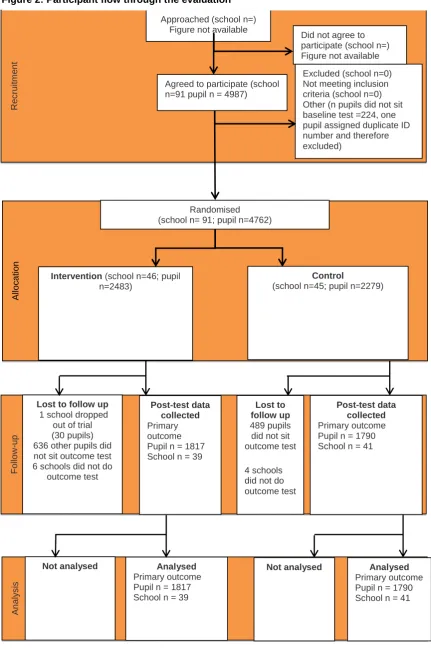
Figure 2 below shows the number of schools and pupils recruited to the trial for the randomisation stage. Before baseline testing, 91 schools agreed to take part in the trial. Data on 4,987 pupils was sent to the evaluation team. Test papers with pupil names were sent to schools, and 4,763 took the test.6 One
school later indicated that it wished to play no further part in the trial, so its 30 pupils were dropped. It became clear that a test sheet populated with incorrect pupil codes (used by the evaluation team to identify pupils anonymously) was sent by error to one school resulting in duplicate data for one pupil. The total number of pupils in the analysis sample was 4,732. However, only 3,607 pupils from 80 schools took part in the primary outcome assessment. Further detail on attrition is provided below. Eight schools from the intervention group indicated that they wished to withdraw from the training. Reasons included burden on staff time to attend training and changes to school management. Two of these schools later agreed to take part in the primary outcome testing. Secondary outcome data was obtained and analysed for all 90 schools.
6 We have calculated attrition using the number of pupils that sat the baseline test and were randomised (N =
Rec ru it m e n t An a ly s is Fo llo w -up Al lo c a ti o n
Agreed to participate (school n=91 pupil n = 4987)
Randomised (school n= 91; pupil n=4762)
Excluded (school n=0) Not meeting inclusion criteria (school n=0) Other (n pupils did not sit baseline test =224, one pupil assigned duplicate ID number and therefore excluded)
Intervention (school n=46; pupil n=2483)
Control
(school n=45; pupil n=2279) Approached (school n=)
Figure not available
Did not agree to participate (school n=) Figure not available
Lost to follow up 1 school dropped
out of trial (30 pupils) 636 other pupils did not sit outcome test 6 schools did not do
outcome test
Post-test data collected Primary outcome Pupil n = 1790 School n = 41
Not analysed Analysed
Primary outcome Pupil n = 1817 School n = 39
Not analysed Analysed Primary outcome Pupil n = 1790 School n = 41 Post-test data
collected Primary outcome Pupil n = 1817 School n = 39
Lost to follow up 489 pupils
[image:24.595.68.500.101.750.2]Table 6: Minimum detectable effect sizes at different stages
Protocol Randomisation Analysis
Overall EAL Overall EAL Overall EAL
MDES 0.18 0.20 0.19 0.21 0.23 0.27
Pre-test/post-test
correlations
level 1 (pupil) 0.74 0.74 0.74 0.74 0.57 0.42
level 2
(school) 0.60 0.60 0.60 0.60 0.60 0.60
Intracluster correlations (ICCs)
level 2
(school) 0.14 0.14 0.14 0.14 0.18 0.19
Alpha 0.05 0.05 0.05 0.05 0.05 0.05
Power 0.8 0.8 0.8 0.8 0.8 0.8
One-sided or two-sided? 2 2 2 2 2 2
Average cluster size 40 10 40 23 45 25
Number of schools
intervention 50 50 46 46 39 39
control 50 50 45 45 41 41
total 100 100 91 91 80 80
Number of pupils
intervention 2000 500 2483 1298 1817 995
control 2000 500 2279 1257 1790 983
total 4000 1000 4762 2555 3607 1978
Attrition
From the 80 schools that did the outcome test, a total of 3,607 pupils took part out of 4,762 that completed the pre-test and were randomised. The overall rate of attrition for the primary outcome is 24%. However, among only those schools that took part in the primary outcome assessment (80 schools), the attrition rate was 15%. As might be expected, for the NPD secondary outcomes attrition was far lower. NPD data provided KS2 Reading marks for 4,531 pupils and KS2 GPS marks for 4,533 pupils. On these measures, the attrition rate is 4.85%.
Pupil and school characteristics
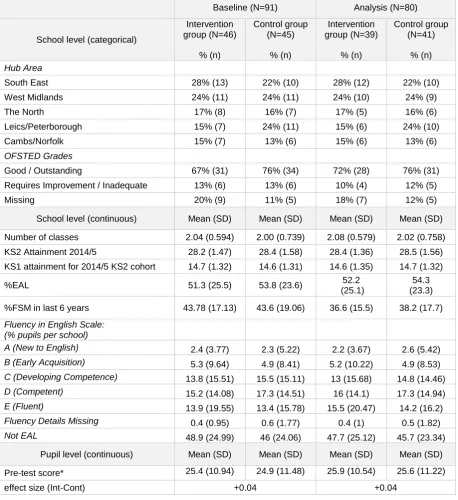
Table 7: Comparing intervention and control samples at baseline and analysis
Baseline (N=91) Analysis (N=80)
School level (categorical)
Intervention group (N=46) % (n) Control group (N=45) % (n) Intervention group (N=39) % (n) Control group (N=41) % (n) Hub Area
South East 28% (13) 22% (10) 28% (12) 22% (10)
West Midlands 24% (11) 24% (11) 24% (10) 24% (9)
The North 17% (8) 16% (7) 17% (5) 16% (6)
Leics/Peterborough 15% (7) 24% (11) 15% (6) 24% (10)
Cambs/Norfolk 15% (7) 13% (6) 15% (6) 13% (6)
OFSTED Grades
Good / Outstanding 67% (31) 76% (34) 72% (28) 76% (31) Requires Improvement / Inadequate 13% (6) 13% (6) 10% (4) 12% (5)
Missing 20% (9) 11% (5) 18% (7) 12% (5)
School level (continuous) Mean (SD) Mean (SD) Mean (SD) Mean (SD)
Number of classes 2.04 (0.594) 2.00 (0.739) 2.08 (0.579) 2.02 (0.758) KS2 Attainment 2014/5 28.2 (1.47) 28.4 (1.58) 28.4 (1.36) 28.5 (1.56) KS1 attainment for 2014/5 KS2 cohort 14.7 (1.32) 14.6 (1.31) 14.6 (1.35) 14.7 (1.32)
%EAL 51.3 (25.5) 53.8 (23.6) 52.2
(25.1)
54.3 (23.3)
%FSM in last 6 years 43.78 (17.13) 43.6 (19.06) 36.6 (15.5) 38.2 (17.7)
Fluency in English Scale: (% pupils per school)
A (New to English) 2.4 (3.77) 2.3 (5.22) 2.2 (3.67) 2.6 (5.42) B (Early Acquisition) 5.3 (9.64) 4.9 (8.41) 5.2 (10.22) 4.9 (8.53) C (Developing Competence) 13.8 (15.51) 15.5 (15.11) 13 (15.68) 14.8 (14.46) D (Competent) 15.2 (14.08) 17.3 (14.51) 16 (14.1) 17.3 (14.94) E (Fluent) 13.9 (19.55) 13.4 (15.78) 15.5 (20.47) 14.2 (16.2) Fluency Details Missing 0.4 (0.95) 0.6 (1.77) 0.4 (1) 0.5 (1.82) Not EAL 48.9 (24.99) 46 (24.06) 47.7 (25.12) 45.7 (23.34)
Pupil level (continuous) Mean (SD) Mean (SD) Mean (SD) Mean (SD)
Pre-test score* 25.4 (10.94) 24.9 (11.48) 25.9 (10.54) 25.6 (11.22)
effect size (Int-Cont) +0.04 +0.04
Outcomes and analysis
As discussed above, the original plan to use KS2 Writing as the primary outcome was abandoned when the marking scheme changed in 2016. It was agreed that the best solution was to use KS2 past papers as the primary outcome. The secondary outcomes were KS2 Reading and KS2 Grammar, Punctuation and Spelling. Both secondary outcomes are still marked using continuous scales and this data was obtained from the National Pupil Database. Histograms for the outcome and baseline measures can be found in Appendix D.
that contain the full set of covariates as specified in the SAP: hub area, number of classes per school, school-level KS2 attainment, and school-level percentage of pupils classified as EAL and in each fluency category. These figures represent the headline findings for the impact evaluation. As an example of the analysis process, all models for the ITT analysis are presented in Appendix E.
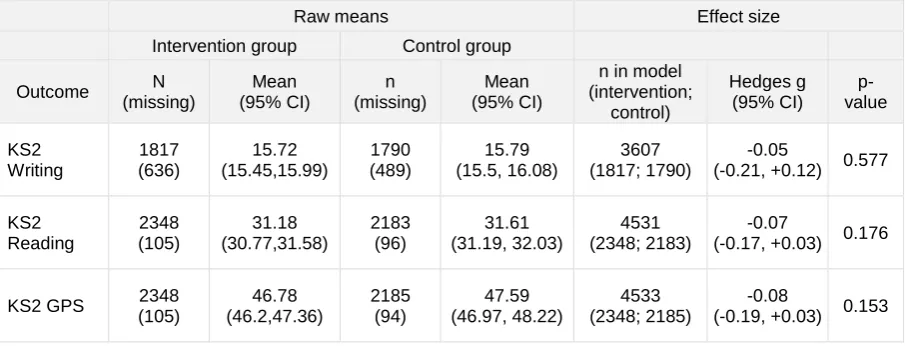
[image:27.595.74.527.264.437.2]The first set of analysis conducted used the full intention-to-treat (ITT) sample. Table 9 shows that for all three outcome measures, no statistically significant difference between the intervention and control groups has been observed. All mean scores are very similar. The point estimates for all three outcomes are negative, but include wide confidence intervals that are consistent with negative effects and small positive effects (in the case of writing) and meaningless positive effects (for reading and GPS). Therefore, we conclude that this trial found no evidence that the Integrating English intervention resulted in pupil-level gains in KS2 Writing, Reading, or GPS attainment compared to ‘business as usual’.
Table 8: ITT analysis
Raw means Effect size
Intervention group Control group
Outcome N (missing) Mean (95% CI) n (missing) Mean (95% CI)
n in model (intervention; control) Hedges g (95% CI) p-value KS2 Writing 1817 (636) 15.72 (15.45,15.99) 1790 (489) 15.79 (15.5, 16.08) 3607 (1817; 1790) -0.05
(-0.21, +0.12) 0.577
KS2 Reading 2348 (105) 31.18 (30.77,31.58) 2183 (96) 31.61 (31.19, 32.03) 4531 (2348; 2183) -0.07
(-0.17, +0.03) 0.176
KS2 GPS 2348 (105) 46.78 (46.2,47.36) 2185 (94) 47.59 (46.97, 48.22) 4533 (2348; 2185) -0.08
(-0.19, +0.03) 0.153
The intervention was intended to improve language ability among all pupils but was aimed principally at EAL pupils. It was therefore agreed at protocol stage to carry out subgroup analyses for these pupils. Results from these models are displayed in Table 9. On the primary outcome measure, the mean difference between intervention and control pupils is near non-existent. On both secondary measures, slightly higher scores are observed among the control group, yet these effect sizes are very small (below 0.10 SDs) and not statistically significant at the p < 0.05 level. Again, the point estimates for all three outcomes are negative; the wide confidence intervals are consistent with negative effects and small positive effects (for writing) and very small positive effects (for reading and GPS).
Table 9: EAL subgroup analysis
Raw means Effect size
Intervention group Control group
Outcome n (missing) Mean (95% CI) n (missing)
Mean (95% CI)
n in model (intervention; control) Hedges g (95% CI) p-value KS2
Writing 995(298) 15.87(15.51,16.23) 983(274) 15.99(15.6,16.37) 1978(995;983)
-0.06
(-0.25,+0.12) 0.517
KS2
Reading 1231(62) 29.89(29.32,30.45) 1197(60) 31.4(30.83,31.97) 2428(1231;1197)
-0.08
(-0.18,+0.02) 0.134
KS2 GPS 1231(62) 46.41(45.58,47.24) 1200(57) 48.92(48.07,49.76) 2431(1231;1200) -0.09
(-0.2,+0.02) 0.120
categories from A (new to English) to E (fluent in English). There was missing data for 27 pupils on this variable, although ten of these did not sit the primary outcome test. Results from these models are displayed in Table 10. Variation between the intervention and control groups is negligible across all three measures. Effect sizes are all negative, smaller than ± 0.1 standard deviations and not statistically significant at the p < 0.05 level, as is the case for the ITT and EAL subgroup analyses discussed above. Table 10: Exploratory analysis (including pupil-level fluency as additional control)
Raw means Effect size
Intervention group Control group
Outcome n (missing) Mean (95% CI) n (missing)
Mean (95% CI)
n in model (intervention; control) Hedges g (95% CI) p-value KS2
Writing 1811(631) 15.81(15.54,16.08) 1779(484) 15.79(15.5,16.08) 3590(1811;1779)
-0.05
(-0.22,+0.12) 0.561
KS2
Reading 2339(103) 31.65(31.25,32.06) 2169(94) 31.61(31.19,32.03) 4508(2339;2169)
-0.07
(-0.17,+0.03) 0.154
KS2 GPS 2339(103) 47.63(47.05,48.22) 2171(92) 47.59(46.97,48.22) 4510(2339;2171) -0.08
(-0.19,+0.03) 0.136
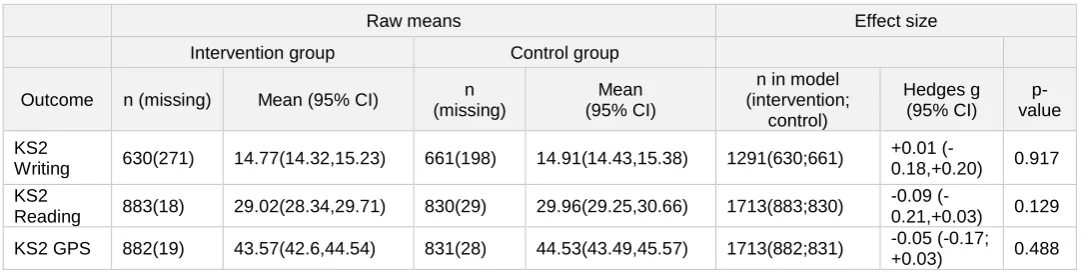
Exploratory analysis was conducted on the subsample of pupils recorded in the National Pupil Database as having been eligible for free school meals at any point in the past six years. The greatest variation discovered was for the secondary measure, KS2 Reading, but again, all effect sizes are all smaller than ± 0.1 standard deviations and not statistically significant at the p < 0.05 level. There is no evidence for any impact of the intervention on this group of pupils. Results from these models are displayed in Table 11.
Further exploratory analysis was conducted on the FSM subsample, with models incorporating pupil-level English proficiency as described above. Again, the greatest variation discovered was for the secondary measure, KS2 Reading, but effect sizes are all smaller than ± 0.1 standard deviations and not statistically significant at the p < 0.05 level. These figures are available from the authors upon request.
Table 11: Exploratory analysis (FSM subgroup)
Raw means Effect size
Intervention group Control group
Outcome n (missing) Mean (95% CI) n (missing)
Mean (95% CI)
n in model (intervention; control) Hedges g (95% CI) p-value KS2
Writing 630(271) 14.77(14.32,15.23) 661(198) 14.91(14.43,15.38) 1291(630;661)
+0.01
(-0.18,+0.20) 0.917 KS2
Reading 883(18) 29.02(28.34,29.71) 830(29) 29.96(29.25,30.66) 1713(883;830)
-0.09
(-0.21,+0.03) 0.129
KS2 GPS 882(19) 43.57(42.6,44.54) 831(28) 44.53(43.49,45.57) 1713(882;831) -0.05 (-0.17; +0.03) 0.488
[image:28.595.30.573.494.630.2]Only 12 schools from the intervention group met the criteria agreed between the evaluation and delivery teams to be classed as compliant. This represents just over a quarter of the 45 intervention schools present at baseline and just under a third of the 39 intervention schools that completed the primary outcome (KS2 writing) testing. In terms of pupils, the proportion of intervention pupils located in the 12 compliant intervention schools was 29.6% for the primary outcome.7
To estimate the Compliers Average Causal Effect (CACE) for the primary outcome, the ITT effect size and confidence intervals were divided by the proportion of intervention pupils located in the 12 compliant schools as specified by Jo et al. (2008) and Schochet and Chang (2011). This is shown below as an equation and the effect size for the primary outcome is used to illustrate how the CACE estimate is calculated.
𝐶𝐴𝐶𝐸 𝑒𝑠𝑡𝑖𝑚𝑎𝑡𝑒 = 𝐼𝑇𝑇 𝑒𝑠𝑡𝑖𝑚𝑎𝑡𝑒
𝑝𝑟𝑜𝑝𝑜𝑟𝑡𝑖𝑜𝑛 𝑜𝑓 𝑝𝑢𝑝𝑖𝑙𝑠 𝑖𝑛 𝑐𝑜𝑚𝑝𝑙𝑖𝑎𝑛𝑡 𝑠𝑐ℎ𝑜𝑜𝑙𝑠 = −0.05
0.296 = −0.17 𝑠𝑑𝑠
[image:29.595.71.500.303.390.2]Table 12 summarises the CACE estimates for the primary and secondary outcomes. Table 12: CACE analyses
Outcome ITT Effect Size (Confidence Intervals)
Proportion of pupils in compliant schools
CACE Effect Size (Confidence Intervals)
KS2 Writing -0.05 (-0.21; +0.12) 538/1817 = 0.296 -0.17 (-0.71; +0.41)
KS2 Reading -0.07 (-0.17; +0.03) 606/2349 = 0.258 -0.27 (-0.66; +0.12)
KS2 GPS -0.08 (-0.19; +0.03) 606/2349 = 0.258 -0.31 (-0.74; +0.12)
The CACE estimate focuses solely on compliance within the intervention group. We have no evidence to suggest that pupils in control schools received the intervention and therefore assume the control (business as usual) condition was maintained across the control schools. However, the pupil-level rate of compliance within the intervention group was less than 30%. This results in considerably weighting up the negative ITT effect size for the primary outcome from -0.05 to -0.17 SDs. The low rate of compliance also results in sizably increasing the width of the effect size confidence interval from 0.33 SDs in the ITT estimate (-0.21; +0.12) to 1.11 SDs for the CACE estimate (-0.71; +0.41).
Missing data
As discussed above, the main source of attrition in this trial was schools not taking part in the additional assessment which provided primary outcome data. Of the ten schools that did not participate in the primary outcome test, six were from the intervention group and four from the control group. This school-level attrition for the primary outcome did not cause substantial imbalance in the analysis sample as can be seen in Table 7.
Table 13 shows that once all pupils at schools that did not sit the primary outcome test are removed from the sample, pupils in intervention schools are no more likely to have missing data for the primary outcome measure (odds ratio = 1.03; CI 0.86, 1.24). Pupil scores on the baseline test scores did not determine the likelihood of missing the primary outcome assessment (odds ratio = 0.99; CI 0.97, 1.00; non-significant). The secondary outcome measures, combined into a total score here to circumvent multicollinearity, are negatively associated with a missing value for the writing test, but the relationship is very weak (odds ratio = 0.99; CI 0.99, 1.00; p < 0.001). Looking at pupil-level fluency, all fluency categories are more likely to have not taken the primary outcome assessment compared to the reference group (A: New to English, the weakest level of proficiency), with the exception of the second lowest level (B: Early Acquisition; odds ratio 0.94; CI 0.41, 2.16; not significant), although the confidence
7 For the primary outcome (KS2 Writing, past papers) 538 pupils were located in the 12 compliant schools out of a
intervals are very wide for each category. Of these estimates, non-EAL pupils are also more likely to have missed the outcome assessment compared to those in the reference category (odds ratio 1.73; CI 0.84, 3.55; not significant), but again the confidence intervals