A computer simulation study of liquid crystal phase
coexistence.
MILLS, Stuart.
Available from Sheffield Hallam University Research Archive (SHURA) at:
http://shura.shu.ac.uk/20065/
This document is the author deposited version. You are advised to consult the
publisher's version if you wish to cite from it.
Published version
MILLS, Stuart. (1999). A computer simulation study of liquid crystal phase
coexistence. Doctoral, Sheffield Hallam University (United Kingdom)..
Copyright and re-use policy
See http://shura.shu.ac.uk/information.html
ProQuest Number: 10697372
All rights reserved INFORMATION TO ALL USERS
The qu ality of this repro d u ctio n is d e p e n d e n t upon the q u ality of the copy subm itted. In the unlikely e v e n t that the a u th o r did not send a c o m p le te m anuscript and there are missing pages, these will be note d . Also, if m aterial had to be rem oved,
a n o te will in d ica te the deletion.
uest
ProQuest 10697372
Published by ProQuest LLC(2017). C op yrig ht of the Dissertation is held by the Author.
All rights reserved.
This work is protected against unauthorized copying under Title 17, United States C o d e M icroform Edition © ProQuest LLC.
ProQuest LLC.
789 East Eisenhower Parkway P.O. Box 1346
A COMPUTER SIMULATION
STUDY OF LIQUID CRYSTAL
PHASE COEXISTENCE
STUART JAMES MILLS, BSc(H ons.), Grad. Inst. P., LRSC
A thesis submitted in partial fulfilment of the requirements
of Sheffield Hallam University for the degree of
Doctor of Philosophy
7 September, 1999
Materials Research Institute, Sheffield Hallam University
A bstract
Results are presented from a variety of molecular simulations of phase coexistence
using the well established Gay-Berne (GB) liquid crystal model.
Firstly, the simulation of bulk phase coexistence using the Gibbs ensemble Monte
Carlo technique is presented, both for one and two-component GB systems. The
one-component results, using a novel param eterisation of the GB, show a rich phase
behaviour, displaying both isotropic and nematic-vapour coexistence, in good com
parison with previous studies. A method for arriving at the two-component parame
terisation is then discussed, followed by a novel application of the Gibbs ensemble to
the isotropic-nematic transition in two-component systems. Results in broad agree
ment with theoretical predictions, subject to a large finite size effect, are obtained.
Secondly, upon the basis of the one-component Gibbs results, results are presented
from a series of molecular dynamics simulations of a free standing GB film in equi
librium with its own saturated vapour. The introduction of inhomogeneity is shown
to induce a preferred molecular alignment in the nematic film perpendicular to the
liquid-vapour interface. At slightly higher tem peratures the nematic film is wet by
the isotropic phase, displaying an intermediate ordering regime where the formation
of short-lived nematic domains within the film is observed. This effect has been
analysed using orientational correlation functions, and shown to result from a de
coupling of the planar and perpendicular nematic ordering caused by the system
inhomogeneity. A system-size analysis of this effect has also been undertaken, show
ing a definite increase in the range of decay of these orientational correlations with
To m y fam ily.
“In the context of eternity, all of this is meaningless.”
A cknow ledgm ents
I would like to thank my supervisors, Dr D.J. Cleaver, Prof C.M. Care and Dr
M.P. Neal, for their constant support and guidance during this project. I also wish
to acknowledge the support of the Defence Evaluation and Research Agency at
Malvern, and the Materials Research Institute at Sheffield Hallam University for
providing a student bursary.
It also gives me pleasure to thank all of my friends and colleagues whom I have
worked with over the past three or so years. So cheers to Ste T, Tom, Daz, Ade,
Bemmy, Ian, Kev, Richie L and all the new guys, as well as all the staff at Sheffield
Hallam who have made it such an enjoyable place to study in. Thanks must also go
to all the poor souls who have had to live with me at some stage during my period
of research, especially the guys at Tylney Rd Thanks to Daz C, Ste M and Ste T
-who has the distiction of being the only one in both the two groups mentioned, and
thus has probably had to put up with the most. Thanks also due to Ste (again!)
and Lynn for putting me up, as to Dave, and all my other friends who have helped
me forget about work once in a while.
Finally I would like to say a big thank you to my family, especially my parents, for
their constant encouragement and understanding, without which I would not have
A dvanced Studies
As part of the course of study a number of postgraduate courses within the MRI
at Sheffield Hallam University were attended. These included the topics Simulation
and Phase Diagrams, as well as Polymers and Liquid Crystals, and Electronic and
X-Ray Microscopy. A teaching course for postgraduate students was also attended.
A number of relevant external courses and conferences were participated in. These
were, along with any work presented at them, in chronological order:
• CCP5 Spring School, Imperial College, London (March 1996)
• BLCS Annual Meeting, University of Central Lancashire, Preston (April 1996)
• CCP5 Annual Meeting, University of Bristol (September 1996)
• BLCS Annual Meeting, Southampton University (April 1997) - Poster Presen
tation - ’Computer Simulation of Fractionation in Bidisperse Liquid Crystals’
• Parallel Programming (MPI) Workshop, Edinburgh Parallel Computing Cen
tre (August 1997)
• Structured Fluids Conference, Durham University (Sept 1997) - Poster Pre
sentation - ’Computer Simulation of a Free Standing Liquid Crystal Film ’
• Modelling of liquid crystals at interfaces - one day workshop, Sheffield Hallam
University (Nov 1997)
• BLCS Annual Meeting, Leeds University (April 1998) Oral Presentation
• International Liquid Crystal Conference 98, Strasbourg, France (July 1998)
Poster Presentation - ’Computer Simulation of Fractionation in Bidisperse
Liquid Crystals’
The following publication has also arisen as part of this work
• S. J. Mills, C. M. Care, M. P. Neal and D. J. Cleaver 'Computer Simulation
Contents
1
Introduction
1
1.1 A i m s ... 2
1.2 Summary of T h e s i s ... 4
2 Experim ental Liquid C rystal Behaviour
5
2.1 Bulk Liquid C r y s t a ls ... 52.2 Liquid Crystal M ix t u r e s ... 11
2.3 Confined Liquid C r y sta ls... 14
2.4 Unconfined Liquid Crystals ... 19
3 M odelling Liquid Crystals
24
3.1 Theoretical M o d e ls ...243.1.1 Bulk S y s t e m s ...25
3.1.2 Interfacial S y s t e m s ...27
3.2 Simulation T e c h n iq u e s... 30
3.2.1 Monte Carlo T h e o r y ... 31
3.2.2 The Gibbs E n s e m b le ... 38
3.2.3 Molecular D y n a m i c s ... 44
3.2.4 Periodic Boundary C o n d itio n s... 51
3.2.6 A n a ly s is ...53
3.2.7 Reduced Units ...57
3.3 Liquid Crystal S im u lation s...58
3.3.1 Hard Particle M o d e ls ... 58
3.3.2 Soft Particle M o d e l s ...63
3.3.3 Interfacial S im u la tio n s ... 80
4 Bulk C oexistence
88
4.1 Single Component Gay-Berne R e s u lts ... 884.1.1 Simulation D e t a i l s ...90
4.2 Generalised Gay-Berne Results ...97
4.2.1 Parameter F ittin g ... 97
4.2.2 Simulation D e t a i l s ...103
4.3 C o n c lu sio n s... 120
5 Thin Film Sim ulations
123
5.1 In trod u ction ... 1235.2 Small S y s t e m ... 126
5.2.1 S u m m a r y ...130
5.3 Medium S y s te m ...131
5.3.1 Orientational O rder... 134
5.3.2 Orientational C o r re la tio n s... 144
5.3.3 S u m m a r y ...156
5.4 Large S y s t e m ...157
5.4.1 Orientational C o rrela tio n s... 165
5.4.2 S u m m a r y ...171
5.6 C o n c lu sio n s...178
6 Conclusions and Future Work
183
6.1 Bulk C o e x is te n c e ...184
6.2 Thin Film S y ste m ...186
6.3 C o n c lu sio n s ... 188
Bibliography
192
A Chem ical P oten tial C alculations
201
Chapter 1
Introduction
Liquid crystalline phenomena are highly significant in a range of areas in the physical
and biological sciences. Ranging from such obvious technological applications as
the twisted nematic display, and the wide-spread use of surfactants in the cleaning
industry, through to the importance of self-assembly in a large number of biological
processes, mesogenic behaviour is clearly a worthy topic of investigation.
However, despite having been under investigation since their discovery more than
100 years ago [1], there is still much which is not known about the underlying
physics [2,3] behind many liquid crystalline effects. In the last 30 years or so there
has been considerable experimental characterisation of various liquid crystals. This
has been relatively successful in determining the underlying structures of the various
liquid crystalline phases, and in locating the transitions and phase diagrams which
characterise such systems [4]. It is by systematic investigation of these th at the via
bility of new liquid crystals for various applications is tested, and also, occasionally,
That said, it is important to realise that in the complicated statistical mechanical
domain of phase transitions, experimental techniques can sometimes be of limited
success in revealing the driving forces behind various phenomena. Also, the assump
tions needed for theoretical treatments of these effects can mean that they are too
far removed from the real situation to provide useful information. It is here that
computer simulation [5,6] can come into its own - essentially lying in between the
realms of theory and experiment, simulation can be of great use in predicting trends
which are difficult to access using the aforementioned techniques.
1.1
A im s
To date, the major application of thermotropic liquid crystals has been in the liquid
crystal display (LCD), which takes advantage of the anisotropic optical and electrical
properties of these molecules in low powered switching devices. In these, the use
of mixtures of different liquid crystal compounds greatly improves the operational
temperature range. Also of major importance is the pinning of the molecules at the
device walls, since this affects the stable states available to the device and, to an
extent, its power consumption.
The work described in this thesis relates to computer simulations performed with the
aim of promoting greater understanding of these two aspects, namely polydispersity
and interfacial symmetry breaking, and their effects upon phase behaviour. Specifi
cally, attention has been focussed on the phase coexistence of a much studied liquid
shape anisotropy. Initial simulations of the bulk monodisperse system indicated a
potentially rich behaviour, and two different perturbations from this were therefore
considered. Firstly, a relatively similar but different particle was introduced, mak
ing a bidisperse system whose behaviour around the isotropic-nematic transition
was examined. Secondly, the effect of symmetry breaking upon the monodisperse
coexistence was looked at, by direct simulation of an interfacial system.
The study of the isotropic-nematic transition for the bidisperse system was con
ducted mainly with a theoretical aim, that of observing fractionation, ie. preferen
tial existence of one species in the ordered phase in the coexistence region, since this
provides a useful check of the mean-field theories which have predicted this effect [8].
Its successful observation would also mean a significant step forward in applying the
Gibbs ensemble method to dense anisotropic systems. To date this effect has only
been seen in markedly more bidisperse simulations [9], where the difference between
the species types is much greater.
Although the interfacial system considered did not include any interacting walls,
only liquid vapour interfaces, it was considered that this would provide an insight
into the effect of the interparticle interactions upon interfacial alignment, being a
reference system for the more complicated confined system. Explicitly, the aim was
to see qualitatively realistic behaviour, with perpendicular (homeotropic) alignment
at the interfaces and nematic wetting (surface ordering). This was also considered
to be of theoretical as well as technological interest, being an example of complex
behaviour observed with a relatively simple model, and exhibiting effects on many
1.2
Sum m ary o f T hesis
Aside from this introduction, the thesis is organised as follows.
In Chapter Two, an introduction to liquid crystals is given, concentrating on the
types of molecules which display this intriguing phenomenon and the structures of
the phases formed. Chapter Three considers previous attem pts to model liquid crys
talline behaviour, using a variety of theoretical and simulation techniques, together
with a brief description of the simulation methods used both in the previous studies
and later on in this body of work. Attention is focussed on work which is relevant
to the results presented here, although some effort has been made to give a wider
consideration of experimental liquid crystals.
Chapter Four consists of the results of a series of Gibbs ensemble simulations of
bulk liquid crystal coexistence, both for mono- and bi-disperse systems, together
with descriptions o f the parameterisations and the regions of the phase diagram in
vestigated. Based upon some of these coexistence results, simulations of a variety of
different sized interfacial systems are presented in Chapter Five, using both standard
Monte Carlo and molecular dynamics methods. As well as the usual considerations
of the phase diagram, in depth analysis of the orientational correlations and their
dependence upon system size is carried out, and comparisons are made with the
bulk behaviour presented in Chapter Four.
Finally the implications of this work are considered in Chapter Six, from theoretical,
experimental and simulation angles. The success of the program of work is assessed
Chapter 2
Experimental Liquid Crystal
Behaviour
In this chapter a brief introduction to the physical properties of liquid crystals
is given. Firstly the bulk phase behaviour is described, including details of the
microscopic structure of the main liquid crystalline phases. This is followed by
a short discussion of the effect of bidispersity upon this phase behaviour (ie the
properties and importance of liquid crystal mixtures) and finally the implications of
interfaces are considered, both for confined and unconfined materials.
2.1
Bulk Liquid C rystals
Materials which exhibit intermediate phases between the isotropic liquid and crys
talline solid states are termed mesogens. Mesogenic materials have been reported
properties have been exploited in many devices, notably in condensed matter sys
tems such as liquid crystal displays (LCDs), as well as applications in data storage.
However, many of their properties and the underlying physics which gives rise to
them are still not fully understood, and there remains scope for improvement in
their utilisation.
Mesogenic materials can be classified into two distinct categories [3]; disordered
crystal mesophases and ordered fluid mesophases. The former have their constituent
molecules fixed at lattice sites but with orientational freedom, and are termed plastic
crystals because they deform easily under stress. The latter exhibit long range ori
entational order with or without some long range translational order and are termed
liquid crystals (LCs). They are generally classified in two categories; thermotropic
and lyotropic. Thermotropic LCs form different mesophases solely upon variation
in temperature, whereas lyotropic LCs do so by changes in concentration as well.
Like other states of matter, thermotropic mesophases are indefinitely stable at de
fined temperatures and pressures. They are split into two groups as follows. One
in which the molecules have rod-like shapes - called calamitic liquid crystals - the
first type discovered, and the other where they have disk-like shapes - called discotic
liquid crystals - which were discovered relatively recently [10]. The familiar phases
of liquid and solid are represented below (Fig 2.1) for calamitic liquid crystals.
As can be seen, in the isotropic liquid the molecules are completely disordered,
whereas in the crystalline solid their long axes are all parallel and they are confined
to a regular lattice structure. The intermediate mesogenic phases are characterised
mini
I V- i
1 *
1V
jiiiiiii
/ P V
mini
Isotropic
Crystalline
Liquid
Solid
Figure 2.1: Liquid and solid schematics
Since this work is primarily concerned with thermotropic calamities, a brief descrip
tion of only these phases will be given. They can be split into two main types;
nematic phases where the molecules are orientationally ordered so th a t their long
axes are preferentially aligned along some direction; this being called the director,
and the more ordered smectic phases in which the molecules in addition display
some sort of layered structure. Brief schematics of these phases are given (Fig 2.2).
If the liquid crystalline molecules are chiral then the nematic director will adopt a
twist throughout the system, in what is called the chiral nematic phase. The length
scale of the twist is often comparable to the wavelength of visible light, and it is these
substances th a t are used in liquid crystal thermometers; the twist length changes
with tem perature and thus causes a different optical colouring to be observed when
light is reflected by it. However, chiral systems are not of importance in this thesis.
Various sorts of smectic phases exist; their classification being dependent upon the
/A / / .
|V\
\
i W /
IIW
I I
m m /
IlflUl
///////
///////
///////
N em atic S m e c tic -A S m e c tic -CFigure 2.2: Liquid crystal schematics
layer normal. The simplest smectic phase, where each layer is a two dimensional
liquid and there are no correlations between the layers is known as the smectic-A
phase. The tilted analogue of this is the smectic-C phase, the nematic director
being tilted with respect to the smectic layer normal. Both of these phases are
shown above (Fig 2.2).
In the hexatic smectic-B phase there is long range order within the layers, the
molecules being distributed locally on a triangular lattice; however the number of
defects is such th at the positional order does not extend over distances larger than
a few 100A, but the bond order extends over macroscopic distances [2]. However
there are no inter-layer correlations, and hence the phase keeps its liquid character.
A number of different molecules have been shown to display calamitic LC phases.
All of these share a geometrical anisotropy in shape. A schematic showing the key
constituents for a mesogenic compound is presented below (Fig 2.3).
From the vast amount of experimental d ata available, the main parts seem to be
Figure 2.3: A generic mesogenic template
linked by a group Y which maintains the linear nature of the core. The end groups,
R and R ’, are usually straight alkyl or alkyloxy chains and serve to introduce some
degree of flexibility into the molecule; however one terminal unit is often a small
polar substituent. The presence of lateral substituents, M and N, has been found
to subtly alter the phase behaviour of many mesogenic materials, and can be of
great use in optimising material performance. Two classic mesogenic compounds
are p-azoxyanisole (PAA) and M-(p-methoxybenylidene)- p-butylaniline (M BBA),
having the formulae shown (Figs 2.4,2.5).
O
Figure 2.4: PAA
Figure 2.5: MBBA
R K Sa N I
CbHu • 24.0 - • 35.0 •
c6h13 • 14.5 - • 29.0 •
c7h15 • 30.0 - • 43.0 •
c8h17 • 21.5 • 33.5 • 40.5 •
c9h19 • 42.0 • 48.0 • 49.5 •
Ci0H21 • 44.0 • 50.5 •
Table 2.1: Cyanobiphenyl transition temperatures (°C)
variety of information in the literature detailing the different aspects of liquid crys
talline behaviour they display. Just to give a rough idea of mesogenic dimensions,
PAA is approximately
20A
long by 5A wide, although obviously other mesogeniccompounds can vary significantly from this. Unfortunately, PAA only displays a
nematic phase at high temperatures and MBBA is not chemically stable, making
them both rather unsuitable for modern day applications. It was the search for star
ble room temperature mesogens that led to the discovery of the cyanobiphenyls, a
ubiquitous group of liquid crystals that were first synthesised in 1972. Consisting of
a biphenyl core with a cyano substituent, and an aliphatic chain of variable length
as the two end groups (Fig 2.6), these molecules were the first commercially viable
nematic liquid crystals for use in display devices, combining low melting points with
relatively high isotropic-nematic transition temperatures, T in (Tab 2.1).
Figure 2.6: Generic structure for the cyanobiphenyls
temper-atures tend to increase, as the additional anisotropy leads to more order at a given
temperature. The noticeable two step behaviour, with transition temperatures go
ing alternatively down slightly and then up significantly, up to R^CgHig, is due to
the well known odd-even effect. This arises because each successive addition of an
alkyl chain will affect the anisotropy of the molecule in one of two different ways,
depending on whether it is a linear addition or at an angle. As can be seen this
happens in an alternate manner (Fig 2.7).
Figure 2.7: The odd-even effect
Upon further increasing the molecular length, the smectic phase is progressively
stabilised, until eventually no nematic phase is observed (10CB). These molecules
still find use today in digital watches and calculators, but generally in a mixture
with other compounds (both mesogenic and non-mesogenic) which has been selected
to give optimum device performance. It is on these mixtures that attention will now
be focussed.
2.2
Liquid C rystal M ixtures
Perhaps the most relevant application of polydisperse liquid crystals is the widely
practised use of mixtures in nematic devices, where the presence of two (or more)
different molecule lengths delays the onset of smectic ordering, as would be expected
range, increasing the utility of such devices. The importance of this is obvious when
it is considered that the vast majority of LCDs use twisted nematic cells.
However, polydispersity not only affects the relative stability of the phases, it also
opens up the possibility of novel phases, and coexistence between them. A tran
sition between two uniaxial nematic phases has been observed experimentally [11]
for a mixture of two relatively similar nematogens. Although no nematic-nematic
coexistence has been observed for these molecules, it has been observed in mixtures
of polymeric and low molecular weight nematogens [12], and also in mixtures of
rod-like and disk-like nematogens [13].
Certainly, any improvement in the understanding of what drives these effects in
liquid crystal mixtures would be of importance, and it is the aim of this work to
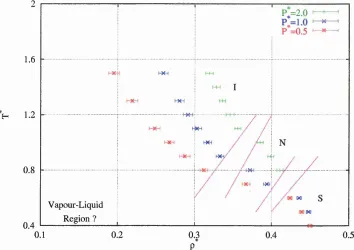
make some progress in this direction. A simple generic phase diagram is shown (Fig
2.8), which illustrates the important effects of extended nematic range and phase
coexistence (I,N and S represent isotropic, nematic and smectic phases respectively).
T
N+I
N-I
.A
T
S-N
N+S
Pure A % PurcB
Figure 2.8: Binary mixture phase diagram
although more will be said of this in the next section, a practical application is worthy
of mention here. The order parameters of the individual components of the mixture
may differ appreciably [14] in binary nematics, which could prove useful in the design
of dye displays. The dye molecules could be chosen to have a high anisotropy, and
hence a high order parameter, one which would normally be indicative of a smectic
phase for a one-component system. However the bi-dispersity will destabilise the
smectic ordering and keep the system nematic, enabling a much better contrast ratio
to be obtained due to the high order parameter [3].
Perhaps a better illustration of the degree of complexity bidispersity can confer on
phase behaviour is given by the phase diagram shown (Fig 2.9), for a binary mix
ture of octyloxyphenyl-nitrobenzyloxy benzoate (DBgONC^) and
decycloxyphenyl-nitrobenzoyloxy benzoate (DB10ONO2) [15] (Fig 2.9). X denotes the mole percent
of D B10ONO2.
220
200
160
140
120
100
60
1QC
60
A number of different phases are present in this diagram, including isotropic (I),
nematic (N), smectic A monolayer (A i), smectic A bilayer (A2), smectic A partial
bilayer (Ad), reentrant phases (re), tilted bilayer (C2) and a fluid antiphase (C). The
fact that both of these molecules are highly polar helps to explain to some degree
the richness of the phase diagram, but it does still give an idea of the plethora of
phases available in bidisperse systems.
2.3
Confined Liquid C rystals
Moving on from considerations of bulk systems, the single most important applica
tion of mesogens to date has been in the liquid crystal display (LCD). This makes
use of the electric and optical anisotropic properties of liquid crystals to provide
exceptionally low power displays. A very simple schematic o f a twisted nematic
device is shown (Fig 2.10).
ITO
Alignment Layers
Polarising films
GLASS
LIQUID CRYSTAL
GLASS
Reflector
Light enters the cell from the top and is plane polarised by the uppermost film,
before passing straight through the transparent glass, indium tin oxide (ITO) and
alignment layers. Switching essentially occurs within the nematic liquid crystalline
material. The alignment layers are set up during cell fabrication so that the topmost
nematic layer is parallel to the incoming plane polarised light, and the bottom one
is perpendicular. This forces the nematogen to adopt a twist across the cell and
this twist rotates the polarisation vector of the light, allowing it to pass through the
bottom plane polariser which is at right angles to the top one. The light is then
reflected back through the cell and the display thus appears light. However, when
an electric field is applied across the liquid crystal (delivered through the ITO) the
liquid crystalline molecules align themselves parallel to it, and thus no longer twist
the incoming light so that it can pass through the bottom polariser. The display
therefore appears dark. The actual orientations of the molecules within these two
states are shown below (2.11). Note - in real devices the cells are much thicker than
the few molecular lengths shown here.
o o o o o o ° o 0 o°
o o o o o o o °
o ° o O O O o o o o
o ° o o o o o o
O O q O O o ° o ° O n
E
Off State (V=0)
On State (V^O)
Figure 2.11: Orientations in the two states [4]
The liquid crystalline material in a device needs to possess a number of different
temper-ature range of nematic stability is necessary for the device to be practical, as is a
strong surface anchoring, which keeps the nematic in its twisted state. However,
matters are complicated further by considerations of switching - a low viscosity and
a large dielectric anisotropy will reduce the switching time and required voltage, in
addition to which a high optical anisotropy is needed to improve the contrast of the
device.
In general, mixtures of liquid crystalline compounds are used to achieve the desired
properties. The optimisation of these mixtures to produce ever improving displays
is an ongoing process, and it is obvious that comprehensive simulation of such a
device is beyond current computational power. The role of simulation (and theory)
instead is to look at various effects individually, and try to build up a picture of how
they vary with certain trends, such as changing the length of the mesogen, or the
strength of its interactions.
Clearly in a device such as the one above, the anchoring of the liquid crystal
molecules to the alignment layer will be of major importance in ensuring successful
operation. Ideally the molecules will need to be tightly anchored in the off state,
to ensure the stability of the twist with temperature, shock etc. Before reviewing
previous experimental studies of substrate-mesogen interfaces, a brief account of the
theoretical distinction between weak and strong anchoring will be given.
Fig 2.12 shows how the angle the local nematic director makes with the anchoring
direction at the wall, 9, varies across half of a typical device cell, where y is the
distance from the wall. The bulk gradient represents the twist across the device; the
Surface
Region
Wall
Bulk
Nematic
O
Figure 2.1 2: Anchoring of director at wall [2]
surface region considerations of anchoring energy minimisation lead to a deviation
from this constant behaviour. In this region of molecular thickness a, the twist
is dependent upon detailed molecular properties. The extrapolation length, b, is
dependent upon the strength of the alignment and can be approximately estimated
using
where A is a positive constant representing the anchoring strength and having dimen
sions of the surface tension, and K2 is the bulk twist elastic constant; the stronger
it is, the less the bulk nematic favours a twist deformation. Both of these quantities
are dependent upon the materials used, and in practice there are two possible types
of anchoring:
the nematic-nematic, and the extrapolation length b is comparable to the
molecular dimension a.
• Weak anchoring, where the nematic-substrate interaction is far weaker than
the nematic-nematic, and the extrapolation length b may be much larger than
the molecular dimension a.
Recent scanning tunnelling microscopy (STM) studies have probably been the most
successful in showing the high degree of order promoted by the substrate interac
tion. For example, the interface between a droplet of liquid crystalline material,
8-cyanobiphenyl (8CB) and a planar substrate (cleaved pyrolytic graphite) has been
shown to display a first adsorbed layer of mesogenic molecules forming a highly
ordered, possibly 2-d crystal, structure stretching for thousands of angstroms [16].
The effect of changes in the bulk behaviour have also been studied, indicating that
they can drastically change the surface region order. Specifically, the crystal struc
ture of the adsorbed monolayer mentioned above is found to be destroyed at the
bulk nematic-smectic transition [17].
Second harmonic generation (SHG) studies of similar systems have confirmed the
existence of surface ordering but produced slightly contradictory results in that
they indicate a tilted rather than planar ordering of the first monolayer at the sub
strate [18]. This could be attributed to the different substrate used in SHG (mica
rather than graphite) however it should be noted that recent simulation results sug
gest the invasive nature of STM may promote a planar structure [19]. SHG studies
have also observed phase transitions in confined systems - when ethylene glycol
and a concentration-dependent anchoring transition occurs, appearing to be surface
driven [2 0].
Of marked importance in the consideration of interfacial phenomena and their effect
upon optimum device performance is the interaction of different length scales
-specifically the link between microscopic substrate anchoring and the macroscopic
film (device) behaviour [21]. This can lead to some problems experimentally, since
it is difficult to access the transition region across which this anchoring is conferred.
Theoretical models, of which more will be said in the next section, have attempted
to address this correlation, but only with limited success. Computer simulation
is an ideal technique with which to study this effect, but unfortunately the large
length-scales involved are at the limits of tractability. In an attem pt to remedy this,
a simpler reference system would make a far better target for the simulator. Aside
from considerations of mesoscopic models, a suitable choice is an unconfined liquid
crystal film, which still contains the symmetry breaking element which should induce
some form of inhomogeneity, yet does not involve a complicated wall - molecule
interaction. A brief survey of the experimental work in this area will be given as a
preface to the theoretical and simulation review in the next chapter.
2.4
U nconfined Liquid C rystals
In a similar manner to confined liquid crystal films (such as in LCD’s), the break in
symmetry at the free surface of a liquid crystalline material can induce a preferred
One of the first experimental investigations of free nematic surfaces looked at surface
alignment using a light reflection technique. It was found that p-azoxyanisole (PAA)
favours planar ordering, whereas 4-methoxybenylidene-4/-butylaniline (MBBA) prefers
an oblique state, the surface director lying at an angle of 75 degrees from the surface
[22]. Subsequent work confirmed this for PAA [23] and showed that MBBA in fact
undergoes a transition from tilted to perpendicular (homeotropic) alignment at a
temperature slightly below the triple point [24]. Studies of another common class of
liquid crystal molecule, the cyanobiphenyls (CB), showed perpendicular alignment
at the free surfaces of 5, 6, 7, 8 CB [25]. This type of behaviour was also seen for a
closely related compound, 8-oxy-cyanobiphenyl (80C B ) [26].
Also of consideration is surface induced (dis)ordering, or wetting behaviour. Inter
faces which induce enhanced ordering are said to display nematic wetting, whereas
those which are surface disordering are termed isotropic wetting. Virtually all real
confined systems show nematic wetting, but at the free surface, disordering is intu
itively more likely to be possible (because of the lack of an order enhancing wall
-substrate interaction).
A variety of experimental studies have established conclusively that orientationally
ordered states, and in certain materials even density modulations, develop in the
vicinity of the free surface [3]. Reflection ellipsometry work on the cyanobiphenyls
[25] has shown nematic wetting of the isotropic free surface, with this wetting chang
ing from partial to complete upon increasing the molecule length (5CB partial; 6,7,8
CB complete). This is in good agreement with theoretical predictions of increased
Furthermore a study of the surface tension behaviour for these systems [27] showed
the expected trend for nematic wetting, which will be discussed at a later point.
More recently, prewetting transitions and a prewetting critical point have been ob
served at the free surfaces of various benzoic acid oxyphenylester derivatives [28].
These ellipsometric studies have all shown enhanced orientational order at the sur
faces.
The surface tension, 7, of an interface is commonly determined by measuring the
exact shape of a drop of liquid crystalline material (several methods are applicable),
and using a simple relationship between this shape, the density difference between
the drop and its surrounding fluid, and 7 [29]. The surface tension is important
in that it gives an indication of the rigidity of the interfaces, and normally shows a
certain qualitative behaviour with temperature depending upon the type of wetting
displayed at the surface.
Generally speaking, the surface tension of an isotropic liquid with its own vapour
shows a negative gradient with increasing temperature, decaying to zero at the
critical temperature, where liquid-vapour coexistence ceases. In terms of decreasing
temperature, if the isotropic liquid undergoes a transition to a nematic fluid, whilst
staying in coexistence with its vapour, there is likely to be a discontinuity in the
surface tension associated with the weakly first order transition. There is also a
possibility of a change in sign of the gradient J j around the transition, as wetting
of some type occurs. Typical behaviours of the surface tension for isotropic (a) and
a)
TN tc t tin tc t
Figure 2.13: Behaviour of surface tension vs temperature [30] (a) Isotropic wetting; (b) Nematic wetting
In general, negative discontinuities occur for isotropic wetting whereas positive ones
are usually observed in cases involving nematic wetting. This can be explained quite
simply by considering the well known relationship [3]
g — < « .- « ( .>
where S is entropy per unit area and the suffixes <r and /? refer to the surface and
bulk states. If there is any surface ordering then Sa may be less than Sp and
7 may show a positive slope. A large number of experimental studies have shown
positive discontinuities (see refs in [3]), hardly surprisingly since the vast majority of
liquid crystalline materials show nematic wetting at the free surface. However, some
few examples of isotropic wetting can be deduced from appropriate surface tension
behaviour. In particular, an early study of p-anisaldazine and MBBA [31] showed a
negative discontinuity at the transition point, implying a surface disordering effect
[32]. A region of positive gradient was observed below this; it is possible that this
corresponds to enhanced layering at the surface at a temperature just below the
In conclusion, the behaviour of mesogens at free surfaces is surprisingly rich, even
when considered at the simple level presented here. Various sorts of smectic surface
ordering have also been observed (see eg. [33]), although these will not be expanded
upon since they are beyond the scope of this thesis. The role of these free systems as
references for the confined systems is in no doubt, since the complicated behaviour
discussed here will need to be understood and modelled accurately before concise
treatments of confined systems can successfully developed. It is with this modelling,
both theoretically and using computer simulation, that attention will be concerned
Chapter 3
Modelling Liquid Crystals
In this chapter an overview of the modelling techniques used for liquid phases is
presented, together with a review of the current progress made with these methods
in the liquid crystal field. Theoretical treatments are briefly dealt with first, then a
more complete discussion of simulation work is given. The modelling methods used,
both in previous investigations and this body of work are first considered, followed by
studies of bulk ordering and concluding with the more complex interfacial systems.
3.1
T heoretical M odels
The statistical mechanics o f liquid crystals is exceptionally difficult, and even for
the simplest physical models, no exact solution has been worked out [2].
A number of different analytical techniques are available to the theorist, which can
observed behaviour empirically, but do not consider a priori molecular interactions.
Conversely, molecular theories start from a consideration of inter-particle effects and
predict the macroscopic behaviour in some way from these. Obviously assumptions
and approximations have to be made in molecular theories to make them analytically
tractable. One of the most important of these for mesogenic systems is the mean-field
approximation, in which the molecular interactions are not considered individually
but approximated collectively to give an average local effect - ie a mean field. This
greatly simplifies the solution of these theories, but results in an incorrect treatment
of local correlations; this can lead to erroneous predictions, especially in the vicinity
of phase transitions where the correlation length scale is of primary importance.
Mesogenic theories have been applied to both bulk and confined systems as described
below.
3.1.1
B ulk System s
The vast majority of liquid crystals (mesogens) are rod-like in shape and in the
1940’s, in his seminal work, Onsager [34] showed that a system of hard rods will
display orientational order above a certain concentration. Onsager used a simple
form of density functional theory, with a mean field type approximation, and made
a number of assumptions. Firstly the rods were not able to interpenetrate each
other, secondly, the volume fraction was much less than one (sparse system ), and
lastly the rods were very long.
order phase transition from the isotropic to nematic phase; this was the first proof
that attractive forces are not necessary for a system to show spontaneous alignment.
However, apart from the assumptions made above, this model differs from actual
observations on thermotropic systems in many respects: the transition density is
too low, the jump in density at the transition is too high, and the order parameter
at the threshold is too big. Like all models involving only infinitely repulsive forces
(so called hard models), the system is independent of temperature.
Maier and Saupe [35] developed a theory which takes into account the attractive
intermolecular interactions, using a system of classical spin vectors located on the
sites of a cubic lattice with nearest neighbour interactions. By solving this with a
mean field approximation, they predicted a strongly first order transition to occur
between the isotropic and nematic phases, at a transition temperature dependent
upon the intermolecular potential. In particular the order parameter for the nematic
phase was found to be much smaller than that predicted by Onsager and a lot closer
to experimentally observed values.
However, later simulation results upon this spin system [36,37] showed the
isotropic-nematic transition to be weakly rather than strongly first order (similar to that
observed experimentally), indicating that mean field theory is not a very good guide
for such characterisation.
Recently, some attempts have been made to extend the mean field type approach
to bidisperse systems, using first numerical [8] and later analytical [38] methods.
This essentially Onsager-like approximation (ie. only steric interactions) revealed a
shorter ones; the presence of a strong fractionation effect (with the longer rods going
preferentially to the nematic phase); a widened biphasic gap; and the possibility of
nematic-nematic phase coexistence for sufficiently different sized rods. The predic
tion of so many features in such a simple system makes this an attractive area for
study by computer simulation, which would have the advantage of treating more
realistically the orientational correlations than the mean-field theory used here.
3.1.2
Interfacial System s
Theoretical treatments of both confined and unconfined liquid crystal films have
shown a rich phase behaviour. Phenomenological treatments [39,40] based on a
Landau-de Gennes [2] formalism have shown qualitative agreement with trends ob
served experimentally [2 1], such as shifting of the transition temperature relative to
the bulk system. However, the number of different effects at work (ordering and
disordering surface interactions, excluded volume effects etc) at a wide range of
length-scales, coupled with the multitude of possible behaviours makes a complete
understanding of these systems a considerable challenge. That said, the observation
that subtle changes in intermolecular and molecule-substrate interactions can lead
to considerable changes in the bulk behaviour suggests that this is a particularly
suitable area for investigation by computer simulation.
The study of anchoring at the free liquid crystal - vapour interface is of importance
both in its own right and as a reference for fully confined systems. The presence of
an interface with no fixed barrier holding it in place allows particular attention to be
rich phase behaviour has been suggested for the interface between a nematic liquid
and its own saturated vapour, including various induced orientations at the surface
as well as both partial and complete wetting regimes and anomalous surface tension
dependency. Theoretical treatment of a lattice-based model [41] predicts cross
over between surface and bulk-region transitions for finite width systems. It is the
competition between these effects that gives rise to such complicated behaviour in
liquid crystal films.
In the last 15 years or so, molecular theories have made significant progress in this
area. A number of papers [42-44] have been published in which a generalised van
der Waals theory [45], based on spherical harmonic expansion of the anisotropic
attractive component of the intermolecular interaction potential, has been used to
analyse the wetting and alignment properties of the liquid-vapour interface, both
above and below the bulk isotropic-nematic transition temperature. These show that
appropriate choices of the various expansion terms can yield perpendicular, parallel
or oblique alignment at the interface. Although direct mapping of these terms
onto physical properties is difficult, the first second order term which couples the
translational and rotational degrees of freedom, and thus gives rise to a non-trivial
surface behaviour, has been shown to induce homeotropic alignment for prolate
molecules, and planar for oblate ones. The next second order term, which has a
weaker effect at the free interface, has been shown to have the opposite effect, with
oblique alignment resulting when there is near-cancellation of these competing effects
and higher order terms become relevant. Recently the assumption of a spherical hard
core for these theories has been called into question [30], casting doubt over some of
are still thought to be valid.
A related paper [46] which employs explicit expansions of a range of
parameteri-sations of the Gay-Berne potential [7,47] has found that perpendicular alignment
should arise in such systems. Conversely, studies based on perfectly ordered systems
with ellipsoidally symmetric intermolecular interactions [48] predict parallel surface
orientation. This apparent inconsistency is explained by noting [46] the considerable
differences between the Gay-Berne form and its predecessor, the Berne-Pechukas
potential [49], which is more consistent with the ellipsoidally symmetric potentials
considered in the latter works.
Aside from considerations of induced orientation, the wetting effects of these systems
upon approach to the vapour-isotropic-nematic triple point are also predicted to de
pend sensitively on the terms in the molecular model used. In summary, it has been
found that increasing magnitude of the alignment inducing terms favours nematic
wetting of the isotropic phase [44,50], as would be expected intuitively. A change
from partial to complete wetting occurs as these are increased above a certain value,
and correspondingly, for sufficiently small values, the opposite is observed (isotropic
wetting of the nematic phase or surface disordering).
The behaviour of the surface tension in this region has been linked with the differing
wetting regimes. As was stated in Chapter 2, normally surface tension decreases with
temperature, reaching a value of zero at the liquid-vapour critical point. Theoretical
treatments of systems with disordering interfaces (ie. showing isotropic wetting)
show this trend with the expected negative discontinuity at the nematic-isotropic
with temperature (on either or both sides of the transition) has been predicted,
along with either a positive or negative discontinuity at the transition [30,43]. This
is again in agreement with experimental observations described previously.
In conclusion, theoretical treatments of liquid crystalline systems have shown a rea
sonable degree of success in explaining experimental behaviour. The observation
that repulsive interactions alone can give rise to mesogenic behaviour was an im
portant early result. However, this hardly seems surprising now when it is known
that most liquid behaviour is governed by hard core interactions, and that attrac
tive effects can be regarded, with some reservations, as a simple perturbation away
from this. Even in comparatively simple cases, though, theoretical techniques have
not been wholly successful. For example they tend to overestimate the strengths
of mesogenic transitions, and this is thought to be due to their inability to capture
correctly the nature of orientational correlations. In more complicated interfacial
and bi-disperse systems this problem will be even more acute, and it is here that
computer simulation can provide a useful comparison between the effectiveness of a
model and the theories being used to predict its behaviour.
3.2
Sim ulation Techniques
Computer simulations [5] aim to predict the properties of real systems and test
theories based upon model systems by producing a correct behaviour for a relatively
small idealised system of particles interacting through a given potential. The system
reasonable approximation to bulk behaviour to be made. However, this can lead
to problems, especially around phase transitions, due to suppression of long range
fluctuations. There are two main techniques, Metropolis Monte Carlo (MC), which
attem pts to create a series of configurations for the system using random moves
accepted with an appropriate probability, and molecular dynamics (MD), which
solves Newton’s equations of motion (to an acceptable degree of accuracy) for the
system and can, therefore, be seen as representing the real evolution of the system
through time. MD has the major advantage of allowing dynamical information to
be obtained, however MC is conceptually the easier and was thus the first technique
to be used. It has the advantage that many different sorts of move (not necessarily
realistic) can be attempted, and through a prudent choice of these, certain systems
can be brought to equilibrium with greater ease.
These techniques will now be further explained, starting in historical order with
MC, which was also the first method used in this work.
3.2.1
M on te Carlo T heory
The term Monte Carlo [5] [51] has come into use to designate numerical methods in
which specifically stochastic elements are introduced in contrast to the completely
deterministic algebraic expressions of the MD approach. It was first used to describe
a method developed at the end of the Second World War to study the diffusion of
neutrons in fissionable material. The particular form used in liquid state physics
was developed from this a few years later [52] and is generally known as Metropolis
In the context of a liquid state simulation, the MC method involves generating a
set of molecular configurations by making random displacements of the particles in
a model. A new configuration is accepted or rejected according to a criterion which
ensures that, in the lim it of an infinite number of transitions, a given configuration
occurs with a probability proportional to the Boltzmann factor for that configura
tion, whatever the initial condition of the model. A more detailed analysis is now
given.
Consider the canonical ensemble ie. a system consisting of N particles in a fixed
volume V and at a fixed temperature T (also referred to as constant N V T ). The
probability of a certain configuration m of the particles occuring is proportional to
the Boltzmann factor of its potential energy, Um, ie
Pn v t (m ) oc exp ■ (3-1)
To normalise this, the configuration integral is introduced. This is simply the sum
of the Boltzmann factors for all the possible configurations of the system
Z n v t =
J
exp ™^
dm . (3.2)Using this, the probability of a certain configuration m occuring is now given by
P n v t (m ) = — ~— ~— • (3.3)
The configuration integral can be thought of as being the configurational (potential)
part of the partition function. The partition function is the fundamental property
in statistical mechanics from which all other thermodynamic quantities, such as
the appropriate free energy, can be obtained. However, its direct calculation for
reasonably sized systems is practically impossible, and what is needed is a way to
sample the system effectively so that other quantities can be obtained accurately.
The average value of some function f ( m ) in the canonical ensemble is given by
( / ) n v t =
J
P n v t { m ) f (m) d m (3.4)and by sampling configurations at random, the integral can be estimated as
/ E r s / ( m ) e x p ( ^ ) \
( / w
\
a j - e x p ^ )
rFor an infinite number of trials, this random technique will give the correct result;
however for the finite number of trials possible with computer simulation it tends
to behave poorly, since it does not sample effectively the areas of phase space where
the potential energy is such that significant contributions are made to the sum. In
practice, most of the terms are virtually zero due, e.g., to a significant degree of
molecular overlap, and as such the value required is incorrectly estimated.
The Metropolis technique instead uses an importance sampling technique where the
configurations are chosen from a non-uniform distribution so that most of them
at random from a distribution p, the value of a function can be estimated as
( / W
= ( / W
^ )
•
(3-6)
\
P / trialsFor most functions, the integrand will be significant where P n v t (m ) is significant,
and in these cases choosing p = Pn v t (^ ) should give a good estimate of the integral:
U )nV T ~ ( f ( m ))trials '
(
3
*
7
)
The difficult job is finding a method o f generating a random sequence of states so
that, by the end of the simulation, each state has occured with the appropriate
probability. The solution is to set up a Markov chain of states of the liquid, which is
constructed so that it has a limiting distribution of P n v t - Each step in the Markov
chain satisfies the requirements that it depends solely on the present state of the
system (ie is independent of the previous states) and that the outcome of each step
belongs to a finite set of states (Fi, T2,
...rm, rn,...],
called the state space. If 7r isdefined as the transition matrix then the element 7rmn is the probability of moving
from state m to state n. The probability that the system is in a particular state
is given by a state vector p = [pi,P2> --jPrnjPn, What is needed is a particular
transition matrix such that the limiting distribution of the chain
is equal to the desired distribution ie P n v t
-The limiting distribution of p is required to be independent of the starting guess,
p 1. It must also satisfy the eigenvalue equation
p = pit. (3.9)
A 7r needs to be found which satisfies the equation
^ j Prn^mn = Pn- (3.10)
m
This can be ensured using the condition of ‘microscopic reversibility’
Prn^mn = Pn^nm- (3*11)
The Metropolis solution is
TTmn = OLmn
'Kmn = ®mn (p^)
'Kmm ~ 1 X / n ^ m ^ m n
where a is a symmetrical stochastic matrix (a mn = anm), often called the under
lying matrix of the Markov chain. The symmetric properties of a ensure that the
Metropolis solution satisfies the condition of microscopic reversibility.
Pn > Pm m ^ n
To implement the Metropolis solution, it is necessary to specify a . The commonly
used technique for generating a new configuration n from an old one m is to choose
an atom (i) at random and displace it from its old position r™ with equal probability
to any point r” within a sphere centred on r™. On a computer, there are a large
but finite number of new positions N R and in this case a mn can simply be defined
The appropriate element of the transition matrix, 7r, depends upon the relative
probabilities of the initial state m and the final state n. There are two cases to
consider. If the move is downhill in energy ie AU = Un — Um < 0 then p n > p m and
fimn = Oimn. Since the probability a mn has already been incorporated in choosing
the move, it can now be accepted automatically. However, if the move is uphill in
energy AU = Un - Um > 0 then p n < p m and 7rmn = a mn (pn/ pm), so the move
has to be accepted with a probability (pn/Pm )‘ This ratio can be expressed as the
Boltzmann factor of the energy difference
Pn _