A COMPARISON OF THE UTILITY OF DATA MINING ALGORITHMS
IN AN OPEN DISTANCE LEARNING CONTEXT
A. Fynn*
Department of Psychology e-mail: [email protected]
J. Adamiak*
Student Success Unit
e-mail: [email protected]
*University of South Africa Pretoria, South Africa
ABSTRACT
The use of data mining within the higher education context has, increasingly, been gaining traction. A parallel examination of the accuracy, robustness and utility of the algorithms applied to data mining is argued as a necessary step toward entrenching the use of EDM. This article provides a comparative analysis of various classification algorithms within an Open Distance Learning institution in South Africa. The study compares the performance of the ZeroR, OneR, Naïve Bayes, IBk, Simple Logistic Regression and the J48 in classifying students within a cohort over an eight-year time span. The initial results appear to show that, given the data quality and structure of the institution under study, the J48 most consistently performed with the highest levels of accuracy. Keywords: Educational Data Mining, learning analytics, WEKA, J48, logistic regression, student success
INTRODUCTION
The University of South Africa (Unisa), as along with many other universities across the world, is faced with low graduation rates. Additionally, being an Open Distance Learning (ODL) university, Unisa is particularly vulnerable in this area, since the pass rates in ODL institutions
are typically lower when compared to traditional, contact-based institutions (Letseka and Karel 2015). The phenomenon of ODL underperformance is so ubiquitous that it is now commonly
return on investment is of the order of 2 000 per cent for students successfully graduated from ODL institutions. Thus, a considerable benefit may reside in early recognition of the factors that negatively influence graduation rates, as these can then be compensated for through the application of appropriate interventions before the problem becomes exacerbated.
Universities and higher education institutions routinely collect an immense amount of data concerning students. Therefore, a better comprehension of the reasons for low performance on the part of the students might emerge from the knowledge congregated in educational databases. Data Mining (DM) is the process of extracting often hidden patterns from pre-existing data and may lead to novel insights, new applications or alternative interpretations of institutional processes. Educational Data Mining (EDM) is an application of DM procedures to educational data and is concerned with developing methods to explore these types of data to improve the understanding of the students and the context in which they learn (Romero and Ventura 2010).
The purpose of this article is to examine which data mining process leads to the most efficient estimation of student performance. In particular, we are interested in finding out which machine learning algorithm provides the best predictability of student academic success. In our context, a successful student is one who has graduated within the maximum time allowed which, at Unisa, is eight years. This definition of success is in contrast with Moreno and
Stephens (2015), who defined success as the achievement of all the credits in regulation time. The decision to focus on the maximum allowed time was motivated by the realisation that
completion rates within minimum time would be negatively skewed as distance education students typically take longer to complete their qualifications (Letseka and Karel 2015).
REVIEW OF THE LITERATURE
1. Hypothesis formulation 2. Data collection
3. Data pre-processing
4. Algorithm selection and optimisation 5. Interpretation of results
Each of the above steps can be split into detailed procedures; for example, data pre-processing might be constructed as a two-stage routine: data preparation and data reduction (García, Luengo and Herrera 2015). The first of these two stages can be comprised of data cleaning, data transformation, data integration, data normalisation, missing data imputation and noise
identification. The second might involve feature selection, instance selection, discretisation and feature extraction (García, Luengo and Herrera 2015).
DM can be useful in answering queries on forecasting, object classification, associating similar events, clustering objects into groups and discovering causal relationships (Pal 2011). The area of applicability encompasses various industries in the private and public economic sectors, the research communities (Baker and Yacef 2009) and, in particular, the researchers in education.
EDM methods integrate concepts and applications from a wide area of research which include data mining, machine learning, psychometrics, statistics, information visualisation, and computational modelling (Moreno and Stephens 2015).
The applications of EDM are manifold, for example Moreno and Stephens (2015) group them into the following categories: data analysis, data visualisation, generating information to support instruction, courseware construction and planning and scheduling. From a student perspective, EDM can provide recommendations for students, predict student performance, provide models of student profiles, detect undesirable student behaviours, group student by predefined criteria, perform social network analysis to highlight interaction and, develop concept maps of learning programmes to inform design (Moreno and Stephens 2015). A more accurate categorisation about performance analysis and prediction is described in (Thakar, Mehta and Manisha 2015). The authors consider the pre and post-enrolment factors, the relationship of these factors to employability and the power of various DM techniques in predicting academic performance.
Ferguson (2012) looks at the relationship between academic and learning and EDM by focusing on the four challenges: connectivity with the learning sciences, development of ways
guidelines. Papamitsiou and Economides (2014) investigated the fundamental research objectives of learning analytics and EDM, the methods by which these aims were achieved, and the exploration of other emerging research technologies. The authors use SWOT (strength, weaknesses, opportunities and threats) methodology to present the findings. A similar approach is illustrated by Peña-Ayala (2014), together with a chronicle in EDM development.
Unisa developed the socio-critical model of understand, predict and enhancing student success (Subotzky and Prinsloo 2011). The consecutive development of the socio-critical model about emerging big data, as well as the issues to be addressed, are discussed in Prinsloo et al. (2015). The overview of analytics, as used by Unisa and in comparison with Open University in the UK are explored in Prinsloo, Slade and Galpin (2012) as well as in Prinsloo and Slade (2013).
LEGAL AND ETHICAL CONSIDERATIONS IN LEARNING ANALYTICS
The initial optimism and hype driving the use learning analytics in teaching and learning has recently slowed due to concerns about privacy and the impact on individual integrity and identity (Drachsler and Greller 2016). The concerns raised pertaining to learning analytics are parallel to concerns relating to internet safety, surveillance and commercial exploitation of data
(Drachsler and Greller 2016). Proponents of EDM emphasise the benefits of increased efficiency and cost effectiveness related to delivering education and conducting research in the
field (Eynon 2013). While it is beyond the scope of this article to provide a detailed discussion of the legal and ethical implications of Learning Analytics and EDM, we intend to briefly highlight the key principles guiding the legal and ethical frameworks that, in turn, guide the use of analytics in higher education.
The use of EDM places unprecedented access to analytics about students in the hands of institutions. Concomitantly it has also created new obligations and responsibilities for institutions regarding ensuring data privacy, ethical use of student data, complying with legislation protecting personal information and the duty to act on intelligence derived from analyses (Prinsloo and Slade 2013; 2014). Sclater (2015) proposes key principles for the utilisation of EDM to enhance teaching and learning. These principles include identifying and providing specific responsibility for the use of EDM; ensuring transparency and consent; protecting individual privacy; ensuring data and predictive validity of analyses; taking measures to ensure access to the analyses and results; enabling positive interventions; minimising adverse impacts and providing an environment for the responsible stewardship of data.
According to Drachsler and Greller (2016), acceptance of technological solutions based on learning analytics depends on data subjects being sufficiently aware of the consequences of using the system, of the validity and relevance of the results obtained, and of the level of transparency of the data model. Wook, Yusof and Nazri (2016) found that relevance of the analysis, self-efficacy of individual users, conducive environmental conditions, perceived usefulness, perceived ease of use, optimism about learning analytics and discomfort experienced about learning analytics influenced the acceptance of EDM among 211 undergraduate students at six public universities in Malaysia. In summary, their results indicate that students who are optimistic toward technological advancements, and who are self-efficacious, are more likely to use EDM when the usefulness and usability of the analytics are made readily apparent. Furthermore, they state that the relevance of the analysis, paired with conditions that facilitate access to and the application of EDM, further enhances the likelihood of EDM uptake among the sample (Wook, Yusof and Nazri 2016). The focus of this study is on addressing the principle of increasing the transparency of the data model by making explicit the underlying accuracy and performance of the algorithms utilised to make predictions as to student success.
METHODOLOGY
In this section, we will summarise the applied data mining process, from obtaining the data to the summary and visualisation of results. In particular, we will pursue the process detailed in Ball and Brunner (2010), since the application of DM in the applied sciences is already well researched and standardised. Currently, Unisa harvests from five distinct data warehouses that are structured along the primary functions of the institution (Prinsloo et al. 2015):
1. Student administration 2. Learner management 3. Human resources
4. Finance, space and the built environment
context, assumptions and ideologies underpinning the data are lost (Prinsloo et al. 2015). The Waikato Environment for Knowledge Analysis (WEKA) is a collection of machine learning algorithms, data pre-processing and visualisation tools (Witten, Eibe and Hall 2011). WEKA has been is widely accepted for DM and EDM applications in both the business and academic sectors (Hall et al. 2009).
Data acquisition
The data was obtained from the institutional databases and included the socio-demographic information, registration details, high school learning achievements and university academic results of the students. The research team provided the institutional ICT services with a request specifying the variables required for the analysis, as well as the cohort years which spanned the period 2008 to 2010. The data tables were then joined with the various institutional databases and provisioned. The initial data set received from the institutional ICT department comprised 269 274 instances of undergraduate students. The data was then processed, and cases with missing module performance or missing matric performance data were discarded on a per-case basis. The rationale behind the per-case exclusion is that some of the algorithms used in this study are not able to process missing data.
Data pre-processing
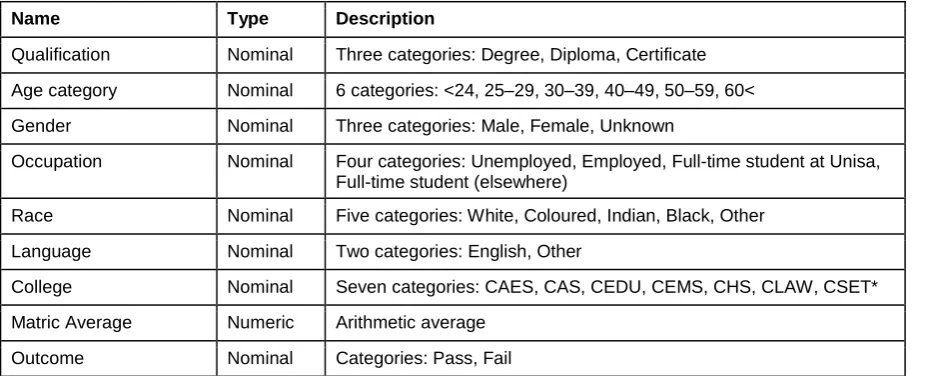
Data pre-processing procedures entailed identifying and excluding all cases with missing data on performance. Demographic data were categorised as indicated in Table 1, while the average of the matric performance was calculated. Duplicate cases were identified and removed, and individual cases were randomly selected to check against institutional systems for accuracy.
Table 1: The set of features describing students’ data
Name Type Description
Qualification Nominal Three categories: Degree, Diploma, Certificate Age category Nominal 6 categories: <24, 25‒29, 30‒39, 40‒49, 50‒59, 60< Gender Nominal Three categories: Male, Female, Unknown
Occupation Nominal Four categories: Unemployed, Employed, Full-time student at Unisa, Full-time student (elsewhere)
Race Nominal Five categories: White, Coloured, Indian, Black, Other Language Nominal Two categories: English, Other
College Nominal Seven categories: CAES, CAS, CEDU, CEMS, CHS, CLAW, CSET* Matric Average Numeric Arithmetic average
Outcome Nominal Categories: Pass, Fail
data sample for the study. The choice of cohort years was based on the assumption that the time to completion for each cohort year selected was greater than five years. The analysis, therefore, considered which students had completed their qualifications within a five-to-eight-year period. The size of the 2008 cohort after data processing comprised 98 880, the 2009 cohort 78 663 and the 2010 cohort 91 731 undergraduate students.
The data was then imported into WEKA, and the outcome classes identified as pass or fail. The choice of a dichotomous outcome was based on the assumption that students either completed their qualification within the defined period or failed to do so. The variables adopted in the current analysis, along with their respective domains, are presented in Table 1.
The college acronyms are defined as follows: CAES: College of Agriculture and Environmental Sciences, CAS: College of Accounting Sciences, CEDU: College of Education, CEMS: College of Economic and Management Sciences, CHS: College of Human Sciences, CLAW: College of Law, CSET: College of Science, Engineering and Technology.
The Outcome indicator was computed by averaging the marks students obtained during their studies at Unisa. The “Pass” indicator was assigned to average marks greater than or equal to 50 per cent. Otherwise, the indicator was set as “Fail”. (The outcome indicators could have been more accurately labelled as complete and incomplete.) For ease of reference, the reader
should consider “pass” as meaning completed and “fail” as meaning incomplete. Further on in the process, the dataset was oversampled in order to adjust the Outcome indicator to real
graduation rates.
Feature and instances selection
structured differently in each college and that the students’ trajectories vary substantially between the colleges. Hence, we split the original dataset into seven separate “chunks”, one for each college.
Table 2: The importance of particular features evaluated via Wrapper, CfsSubsetEval and decision tree split methods
Name Wrapper CfsSubsetEval Splits
Qualification D* 8
Age category D 9
Gender 2
Occupation 9
Race D 5
Language 4
College D D N/A
Matric Average D D 24
Outcome N/A
In Table 2, the D symbol means that the feature is dominant according to the given method. The Splits value indicates how many times the feature has been used in the final model to perform the split.
We compared the indicator outcome with the institutional graduation summaries and selected the 2008 cohort as having the best fit to these summaries. This action limited the number of data instances to 62 246. Then, the datasets were processed with the application of the Synthetic Minority Oversampling Technique (SMOTE) algorithm to adjust the indicator to the institutional summary throughput rates (Chawla et al. 2002). These were provided per college for a six year period. Consequently, the data were passed through a SMOTE filter with the percentage of instances calibrated appropriately for each college.
Algorithm selection
Machine learning is a scientific discipline and has both theoretical and empirical aspects
(Langley 1988). For this reason, it was incumbent on us to perform a range of experiments under different conditions and conclude them with a statistical test (Drummond 2006). An emphasis on the empirical side of data mining makes a stronger case for the scientific validity of generated models.
percentage of dataset instances correctly classified by the classifier, was chosen as the measure of the scheme appropriateness. Overfitting, an undesirable phenomenon in DM, is the use of unnecessarily complicated approaches or models or procedures with superfluous terms included (Hawkins 2004). We controlled this with the help of cross-validation rather than making use of a single training and testing data setup. As part of this approach, the dataset is split into equal folds, and the iteration is performed over these folds. During each iteration, one of the folds is used for testing and all the others for training. The learning procedure executes as many times as the number of folds, then the scores and errors are averaged. WEKA implements, by default, stratified cross-validation, which means that the folds are selected in such a way that the mean response value is relatively equal in all the folds. Since our Outcome class is dichotomous, each fold would contain approximately the same fraction of the two class label types. For the consistency, the 10-fold cross-validation was utilised as a test option for all the experiments, and the statistical significance was determined by the application of paired t-test. We started with simple machine learning algorithms, ZeroR and OneR to get a reasonable estimate of the lower bound for more sophisticated schemas (Holte 1993).
ZeroR chooses the most common category all the time, whereas, OneR chooses the rule with the lowest error rate (Devasena et al. 2011). Consequently, the four other popular schemes
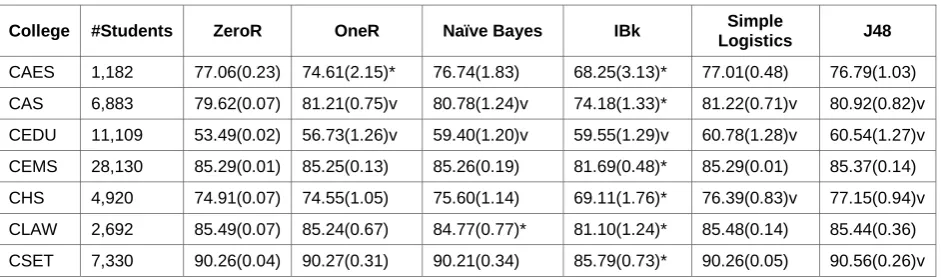
were utilised, namely Naive Bayes, IBk, Simple Logistics and J48, which is a Java implementation of the C4.5 algorithm (Quinlan 1993). These results are presented in Table 3.
In this table, the brackets indicate the standard deviation, statistically better performance of the algorithm is indicated with the v symbol (p = 0.05) than ZeroR. The symbol * means that the algorithm performs significantly worse than ZeroR and the performance is presented as an accuracy percentage.
Table 3: Comparative performance of algorithms per faculty
College #Students ZeroR OneR Naïve Bayes IBk Simple
Logistics J48
CAES 1,182 77.06(0.23) 74.61(2.15)* 76.74(1.83) 68.25(3.13)* 77.01(0.48) 76.79(1.03) CAS 6,883 79.62(0.07) 81.21(0.75)v 80.78(1.24)v 74.18(1.33)* 81.22(0.71)v 80.92(0.82)v CEDU 11,109 53.49(0.02) 56.73(1.26)v 59.40(1.20)v 59.55(1.29)v 60.78(1.28)v 60.54(1.27)v CEMS 28,130 85.29(0.01) 85.25(0.13) 85.26(0.19) 81.69(0.48)* 85.29(0.01) 85.37(0.14) CHS 4,920 74.91(0.07) 74.55(1.05) 75.60(1.14) 69.11(1.76)* 76.39(0.83)v 77.15(0.94)v CLAW 2,692 85.49(0.07) 85.24(0.67) 84.77(0.77)* 81.10(1.24)* 85.48(0.14) 85.44(0.36) CSET 7,330 90.26(0.04) 90.27(0.31) 90.21(0.34) 85.79(0.73)* 90.26(0.05) 90.56(0.26)v
Some authors (Nghe, Janecek and Haddawy 2007; Molina et al. 2012; Sharma and Mavani 2011; Kaur, Singh and Josan 2015; Shahiri and Husain 2015) also favour this algorithm, placing it in the top, or near-top, position with regard to the accuracy estimate. Consequently, we proceeded with fine-tuning the J48 algorithm.
Algorithm optimisation
Optimisation is one of the core goals of machine learning, as many of the schemas reduce to optimisation problems (Bennett and Parrado-Hernández 2006). Amongst others, pruning, which is a process of removal of unnecessary structures, is one of the major optimisation procedures applied to decision trees (Quinlan 1987). In essence, we have two major strategies when adopting pruning in respect of a particular model. The first is called pre-pruning, and it involves the decision as to when the development of sub-trees has to be stopped. The second one, called post-pruning, involves the learning scheme’s decisions regarding whether the sub-tree should be replaced, raised or left unpruned (Witten, Eibe and Hall 2011). In summary, the optimisation processes for J48 scheme in WEKA involve the following implementations of tree pruning:
• Switching the pruned/unpruned flag
• Adjustment of the confidence factor that determines the amount of tree pruning (the C
factor, equal to 0.25 as a default), and
• Adjustment of the minimal number of instances per leaf (the M factor, equal to 2 as a
default)
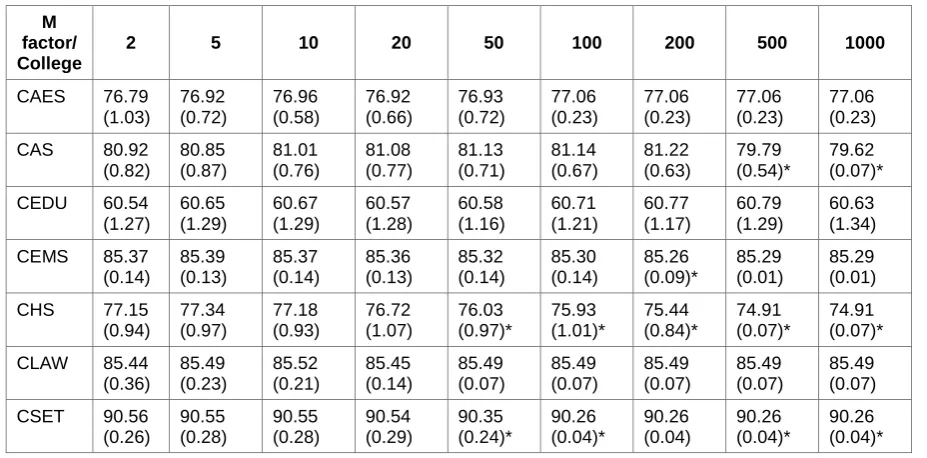
When we disabled the tree pruning altogether, the performance of J48 on the datasets was substantially lowered for all the colleges. Additionally, an unpruned tree tends to over fit the data. Thus we further decided to have the pruning switched on at all times. Varying the C factor
be implemented in the production environment. The results of the optimisation process, presented in Table 4, give us the accuracy as a function of M factor for all the colleges. In Table 4, brackets denote standard deviation while the symbol * means that the algorithm performs statistically worse than one with M=2. The performance of the relative M factor adjustments are reported in percentages.
Table 4: Comparative performance of J48 with adjustment on M factor
M factor/ College
2 5 10 20 50 100 200 500 1000
CAES 76.79 (1.03) 76.92 (0.72) 76.96 (0.58) 76.92 (0.66) 76.93 (0.72) 77.06 (0.23) 77.06 (0.23) 77.06 (0.23) 77.06 (0.23) CAS 80.92
(0.82) 80.85 (0.87) 81.01 (0.76) 81.08 (0.77) 81.13 (0.71) 81.14 (0.67) 81.22 (0.63) 79.79 (0.54)* 79.62 (0.07)* CEDU 60.54
(1.27) 60.65 (1.29) 60.67 (1.29) 60.57 (1.28) 60.58 (1.16) 60.71 (1.21) 60.77 (1.17) 60.79 (1.29) 60.63 (1.34) CEMS 85.37
(0.14) 85.39 (0.13) 85.37 (0.14) 85.36 (0.13) 85.32 (0.14) 85.30 (0.14) 85.26 (0.09)* 85.29 (0.01) 85.29 (0.01) CHS 77.15
(0.94) 77.34 (0.97) 77.18 (0.93) 76.72 (1.07) 76.03 (0.97)* 75.93 (1.01)* 75.44 (0.84)* 74.91 (0.07)* 74.91 (0.07)* CLAW 85.44
(0.36) 85.49 (0.23) 85.52 (0.21) 85.45 (0.14) 85.49 (0.07) 85.49 (0.07) 85.49 (0.07) 85.49 (0.07) 85.49 (0.07) CSET 90.56
(0.26) 90.55 (0.28) 90.55 (0.28) 90.54 (0.29) 90.35 (0.24)* 90.26 (0.04)* 90.26 (0.04) 90.26 (0.04)* 90.26 (0.04)*
The results in Table 4 indicate that, optimisation of the M factor does not produce significantly improved accuracy rates for the various colleges. In some cases, the optimisation process resulted in the algorithm performing significantly worse than the baseline M factor of two. For instance, we see that, in the college of Sciences, M factors over 500 lead to statistically significant lower performance levels. Therefore, in this particular case, optimisation did yield improved accuracy rates. However, it is important to investigate the optimisation process to ascertain whether the performance of the algorithm can be improved on.
RESULTS
algorithm to improve accuracy and performance, in particular for those colleges where J48 did not perform better than ZeroR, yielded marginal improvements which did not translate into better performance overall. Consequently, while we recommend the use of the J48 on large data sets such as those within ODL institutions such as ours, the optimisation process needs to be improved upon to ensure greater consistency across faculties.
Key considerations for the implementation of results from EDM analyses in
institutions
Development of a near real time system using the techniques and models described above, would require extensive consultation to ensure that privacy issues and potential algorithmic bias are openly discussed and contextualised. (Wook, Yusof and Nazri 2016). While the analysis presented in this article was aggregated and anonymised, live integration of the analytics into the Learning Management System (LMS) would require some level of disaggregation to ensure that students in need of support are identified for targeted interventions. This would require careful consideration of who should be allowed to view disaggregated student information as well as an open discussion about how the information should be made available to students. The disaggregation of student information will further require a clear code of practice which emphasises the benefits (and under which conditions) for all stakeholders; stipulates the conditions for consent, describes the process of de-identification and the implications of opting out; details measures to reduce vulnerability and mitigate harm; and prescribes the conditions for the collection, analysis, access to and storage of the data (Sclater 2015; Prinsloo and Slade 2014).
Limitations
This study has a number of limitations which might be removed in future investigations. The dichotomous outcome variable is a crude description of the students’ entire interaction with the university. It would be appropriate to define a larger variety of class outcomes that relate to different stages of students’ involvement and to generate models for each stage. No data from the learning management system was integrated into the current analysis. This is, in part, due to the correspondence nature of study that is dominant in many of the modules which does not require online interaction and the data would therefore only reflect on the behaviour of a minority of students. The model would substantially benefit from the inclusion of assignment and raw exam results, as well as information about stop-outs in the study continuum. We only explored the use of a few machine learning algorithms and data mining environments for our
algorithms that might perform in a superior way on our datasets.
With the limited number of features used, it was difficult to produce a universal model of the successful student. One may attribute such difficulties in identifying a universal model to the large scale on which Unisa operates; the diverse student population; the immense variety of support services; and the varying socioeconomic spheres of the students. In fact, it is arguable whether a universal model is necessary, and posit instead that there may be a number of core models that hold more explanatory power. This implies a need for Ockham’s razor to reflect Unisa’s complex dynamics.
Another possible reason for the difficulty in producing a universal model was the limitation on the initial variables and on the assumptions that were set.
Future research
Future research could incorporate a wider utilisation of student data, which would include graduation details, and application of natural rather than historical discretisation. Additionally, the inclusion of psychological characteristics and a revisited definition of success which includes the financial factors as well as the time dimension in studies, would enlarge the feature set and provide a number of additional interpretative outcomes. Finally, in the machine learning field, we intend to embrace more sophisticated algorithms and compare them in a holistic fashion, for instance, by using a cost analysis and ROC area estimation.
REFERENCES
Aggarwal, C. C. 2015. Data mining: The textbook. Springer, Switzerland.
Archer, E., Y. B. Chetty and P. Prinsloo. 2014. Benchmarking the habits and behaviours of successful students: A case study of academic-business collaboration. International Review of Research in
Open and Distance Learning 15(1): 62–83.
Baker, R. S. and K. Yacef. 2009. The state of educational data mining in 2009: A review and future visions. JEDM-Journal of Educational Data Mining 1(1): 3–17.
Ball, N. M. and R. J. Brunner. 2010. Data mining and machine learning in Astronomy. International
Journal of Modern Physics D 19(7): 1049–1106.
Bell, G., T. Hey and A. Szalay. 2009. Beyond the data deluge. Science 323(5919): 1297–1298.
Bennett, K. P. and E. Parrado-Hernández. 2006. The interplay of optimization and machine learning research. Journal of Machine Learning Research 7: 1265–1281.
Bramer, M. 2013. Principles of data mining. Springer, London.
Chawla, N. V., K. W. Bowyer, L. O. Hall and W. P. Kegelmeyer. 2002. SMOTE: Synthetic minority over-sampling technique. Journal of Artificial Intelligence Research 16: 321–357.
Clarke, B., E. Fokoue and H. H. Zhang. 2009. Principles and theory for data mining and machine
learning. Springer Science & Business Media.
Devasena, C. L., T. Sumathi, V. V. Gomathi and M. Hemalatha. 2011. Effectiveness evaluation of rule based classifiers for the classification of iris data set. Bonfring International Journal of Man
Drachsler, H. and W. Greller. 2016. Privacy and learning analytics – a DELICATE issue. A checklist for trusted learning analytics. In 6th International Conference on Learning Analytics and
Knowledge, Edinburgh, UK, April 25–29 2016. April 25–2: 89–98.
Drummond, C. 2006. Machine learning as an experimental science (revisited). Proceedings of the Twenty-First National Conference on Artificial Intelligence: Workshop on Evaluation Methods
for Machine Learning: 1–5. AAAI Press.
Eynon, R. 2013. The rise of big data: What does it mean for education, technology, and media research?
Learning, Media and Technology 38(3): 237–240.
Ferguson, R. 2012. Learning analytics: Drivers, developments and challenges. International Journal of
Technology Enhanced Learning 4(5/6): 304–317.
Galusha, J. 1998. “Barriers to learning in distance education.” An Electronic Journal for the 21st
Century 5(3/4): 6–14.
García, S., J. Luengo and F. Herrera. 2015. Data preprocessing in data mining. Springer, New York.
Hall, M. A. 1999. Correlation-based feature selection for machine learning. Doctoral dissertation, The University of Waikato.
Hall, M., E. Frank, G. Holmes, B. Pfahringer, P. Reutemann and I. Witten. 2009. The WEKA data mining software: An update. SIGKDD Explorations 11(1): 10–18.
Han, J., J. Pei and M. Kamber. 2011. Data mining: Concepts and techniques. Morgan Kaufmann, Waltham.
Hawkins, D. M. 2004. The problem of overfitting. Journal of Chemical Information and Computer
Sciences 44(1): 1–12.
Holte, R. C. 1993. Very simple classification rules perform well on most commonly used datasets.
Machine Learning 11(1): 63–91.
Islam, M. M. and A. Al-Ghassani. 2015. Predicting college math success: Do high school performance and gender matter? Evidence from the Sultan Qaboos University in Oman. International Journal
of Higher Education 4: 67–80.
Kantardzic, M. 2011. Data mining: Concepts, models, methods, and algorithms. John Wiley & Sons.
Kaur, P., M. Singh and G. S. Josan. 2015. Classification and prediction based data mining algorithms to predict slow learners in education sector. Procedia Computer Science 57: 500–508.
Kohavi R. and G. H. John. 1997. Wrappers for feature subset selection. Artificial Intelligence 97(1–2): 273–324.
Langley, P. 1988. Machine learning as an experimental science. Machine Learning 3(1): 5–8.
Ledolter, J. 2013. Data mining and business analytics with R. John Wiley & Sons.
Letseka, M. and K. Karel. 2015. Pass rates in Open Distance Learning (ODL). Open Distance Learning
(ODL) in South Africa: 65.
Molina, M. M., J. M. Luna, C. Romero and S. Ventura. 2012. Meta-learning approach for automatic parameter tuning: A case study with educational datasets. International Educational Data Mining
Society.
Moreno, G. and C. R. Stephens. 2015. Applying data mining techniques to identify success factors in students enrolled in distance learning: A case study. Advances in Artificial Intelligence and Its
Applications 1: 208–219.
Nghe, N. T., P. Janecek and P. Haddawy. 2007. A comparative analysis of techniques for predicting academic performance. In 2007 37th Annual Frontiers In Education Conference-Global
Engineering: Knowledge Without Borders, Opportunities Without Passports, IEEE.
Pal, J. K. 2011. Usefulness and applications of data mining in extracting information from different perspective. Annals of Library and Information Studies 58: 7–16.
Educational Technology & Society 17(4): 49–64.
Peña-Ayala, A. 2014. Educational data mining: A survey and a data mining-based analysis of recent works. Expert Systems With Applications 41(4): 1432–1462.
Piatetsky-Shapiro, G. 2007. Data mining and knowledge discovery 1996 to 2005: Overcoming the hype and moving from “university” to “business” and “analytics”. Data Mining and Knowledge
Discovery 15(1): 99–105.
Piatetsky-Shapiro G. and G. Parker. 2011. “Lesson: Data mining, and knowledge discovery: An Introduction”. Introduction to Data Mining. KD Nuggets. http://www.kdnuggets.com/ data_mining_course/index.html (Accessed 14 February 2017).
Prinsloo, P., E. Archer, G. Barnes, Y. Chetty and D. van Zyl. 2015. Big(ger) data as better data in Open Distance Learning. International Review of Research in Open and Distributed Learning 16(1): 284–306.
Prinsloo, P. and S. Slade. 2014. Student data privacy and institutional accountability in an age of surveillance. In Using data to improve higher education, ed. Maria Eliophotou Menon, Dawn Geronimo Terkla and Paul Gibbs, 197–214. Rotterdam: SensePublishers.
Prinsloo, P., S. Slade and F. Galpin. 2012. Learning analytics: Challenges, paradoxes and opportunities for mega open distance learning institutions. In Proceedings of the 2nd International Conference
on Learning Analytics and Knowledge, 130–133.
Prinsloo, P. and S. Slade. 2013. An evaluation of policy frameworks for addressing ethical considerations in learning analytics. In 3rd International Conference on Learning Analytics and
Knowledge. LAK 2013: 240–244.
Quinlan, J. R. 1987. Simplifying decision trees. International Journal of Man-machine studies 27(3): 221–234.
Quinlan, J. R. 1993. C4. 5: Programming for machine learning. Morgan Kauffmann, Chicago, 38.
Romero, C. and S. Ventura. 2010. Educational data mining: A review of the state of the art. IEEE
Transactions on Systems, Man, and Cybernetics, Part C (Applications and Reviews) 40(6): 601–
618.
Sclater, Niall. 2015. “Code of practice for learning analytics.” Joint Information Systems Committee. https://www.jisc.ac.uk/sites/default/files/jd0040_code_of_practice_for_learning_
analytics_190515_v1.pdf
Shahiri, A. M. and W. Husain. 2015. A review on predicting student’s performance using data mining techniques. Procedia Computer Science 72: 414–422.
Sharma M. and M. Mavani. 2011. Accuracy comparison of predictive algorithms of data mining: Application in education sector. In Advances in computing, communication and control, 189–194. Springer, Berlin Heidelberg.
Simpson, O. 2005. The costs and benefits of student retention for students, institutions and governments.
Studies in Learning, Evaluation Innovation and Development 2(3): 34–43.
Simpson, O. 2013. Supporting students for success in online and distance education. Routledge.
Subotzky, G. and P. Prinsloo. 2011. Turning the tide: A socio-critical model and framework for improving student success in open distance learning at the University of South Africa. Distance
Education 32(2): 177–193.
Thakar P., A. Mehta and Manisha. 2015. Performance analysis and prediction in educational data mining: A research travelogue. International Journal of Computer Applications 110(15): 60–68.
Witten, I. H., F. Eibe and M. A. Hall. 2011. Data mining: Practical machine learning tools and
techniques. 3rd Edition. Morgan Kaufman Publishers.