TRACKING STUDENTS’ PERFORMANCE IN HIGHER EDUCATION:
THE TRANSITION FROM NATIONAL BENCHMARK TESTS TO
QUANTITATIVE LITERACY INTERVENTION COURSE
D. T. Mutakwa*
Centre for Educational Testing for Access and Placement Centre for High Education Development
e-mail: [email protected]
D. Mhakure*
Numeracy Centre
e-mail: [email protected]
*University of Cape Town Cape Town, South Africa
ABSTRACT
This study, situated in the context of higher education, seeks to track the performance of students whose National Benchmark Tests (NBT) performance is known in a Quantitative Literacy intervention course. The study used the repeated measures Analysis of Variance and t-tests in tracking the performance of students. Furthermore, student-test answer sheets were used to understand the challenges they were facing in the intervention course. The results show that the trajectory of the students’ performances from the NBT Quantitative Literacy test to the end of semester Quantitative Literacy course examination scores had an upward trend. These findings provide a starting point for understanding students’ experiences as they transit from NBT Quantitative Literacy to the final examination of Quantitative Literacy intervention course.
Keywords: quantitative literacy, National Benchmark Test, student performance
INTRODUCTION
al. 2012), the National Benchmark Tests (NBT) were commissioned in 2005 by Higher Education South Africa (HESA). The NBT were “specifically developed with the purpose of providing information about higher education preparedness, in addition to that provided by the NSC” (Wilson-Strydom 2012, 137). One of the objectives of the NBT is to assess entry-level Quantitative Literacy (QL) skills in the Faculty of Humanities at an institution of higher learning. The QL intervention course discussed in this study is an example of a foundation course intended for first year Humanities students.
For clarity, students are admitted to the Faculty of Humanities using their NSC grades as well as their NBT QL results, which they would have written either before or after the NSC examination, depending on the university concerned. The NBT QL results are then used for students’ placement and/or designing appropriate QL intervention courses. The marks, in percentages, of the students’ NBTs are classified into three categories: The Proficient level is from 70 per cent and above; the Intermediate level is from 38 per cent to 69 per cent; and below 38 per cent is the Basic level (Wolmarans et al. 2010; Frith and Prince 2016). Research has shown that very few students are in the Proficient level (Prince 2010; Wilson‐Strydom 2010), and it is suggested by the NBT Project that students in the Intermediate level will not cope with mainstream degree programmes. Their best chance of success would be to enrol in appropriate support or extended degree programmes (EDP). Students who are in the Basic level would need substantial support in order to pass even if they are allowed to pursue an EDP.
The construct of QL is a contested one; however, for the purposes of this study we use the definition of QL that underpins the NBT QL as follows:
“Quantitative literacy is the ability to manage situations or solve problems in practice, and involves responding to quantitative (mathematical and statistical) information that may be presented verbally, graphically, in tabular or symbolic form; it requires the activation of a range of enabling knowledge, behaviours and processes and it can be observed when it is expressed in the form of a communication, in written, oral or visual mode” (Frith and Lloyd 2016, 30).
Numerous studies on QL in higher education have focused on what QL is, and how the construct of QL should be implemented in higher education. However, research focussing on students’ transitions from NBT QL to QL intervention courses is scarce. Our position is that there is therefore a gap in the knowledge in this regard, and that a deep understanding of this transition could lead to the improvement of NBT QL testing and/or the improvement in the design of QL intervention courses in higher education.
The QL intervention course being referred to in this study is taught over the duration of one semester (12 weeks), and consists of four lectures, one classroom tutorial, and one computer-based tutorial every week. In the computer-based tutorials students are taught real data analysis and interpretation techniques.
The aim of the QL intervention course is twofold. Firstly, it aims to develop students’ quantitative reasoning skills using mathematical and statistical elementary concepts which they will need in their disciplines of study, and in different academic contexts. Secondly, it aims to teach students to use appropriate quantitative reasoning skills in their everyday life situations when making personal decisions as informed democratic citizens (Jordan and Haines 2003). In the context of this study, quantitative reasoning refers to the abilities to “select, apply, and explain a variety of quantitative methods across different [familiar and unfamiliar] contexts” (Jordan and Haines 2003, 16). Anecdotally, as QL course facilitators we are aware of the challenges faced by students in the “re-contextualisation of knowledge as it crosses the boundaries of two communities [two contexts]” (Noss and Hoyles 2013, 76) during knowledge application and transfer.
THE PROBLEM
The proportion of students who graduate in minimum time across all universities in South Africa is, on average, about 27 per cent. Throughput is therefore very low across all universities. At the institution where this study was carried out, however, the proportion of students who graduate within minimum time is about 40 per cent. The high throughput experienced at this institution is a result of the fact that only the top 10 per cent of performers on the NBT and the National Senior Certificate (NSC) are admitted. Furthermore, this institution is one of the historically advantaged universities (Bunting 2006).
world of work and as active citizens.
One such intervention course is the QL course for Humanities students, which is designed and taught by the Numeracy Centre (NC). The challenge is that there is a dearth of research that seeks to track students’ performance and transition from the NBT QL to the QL intervention courses.
THE STUDY
This study, situated in the context of higher education, seeks to track the performance of students, whose NBT marks are known, on a QL intervention course. Specifically, the study focuses on how the students enrolled in QL intervention courses are performing, and how this performance compares with their NBT QL levels of: Basic, Intermediate Lower, Intermediate Upper, and Proficient.
In addition, this study seeks to investigate whether there are significant differences between students’ performance in NBT QL test scores and QL intervention course assessment scores for Test 1, Test 2, and the examination. The study was conducted during the first semester of the students’ first year of enrolment in a psychology course. Therefore, this study seeks to address the following research questions: Are there statistically significant differences between the mean scores of these two assessments? What do the analyses of the students’ written scripts from the assessments indicate about the students’ progression in the intervention course?
METHODOLOGY
The study sample consisted of 117 students enrolled in two QL intervention courses during a single semester. Most of these students were either part of the extended degree and/or main stream programme and had obtained Intermediate or Basic scores in their NBT QL. Only students who score a minimum of 70 per cent in the NBT QL or at least 50 per cent in NSC Maths (not mathematical literacy) are allowed unconditionally to enrol in first year psychology courses at the institution. This QL intervention course is intended for students whose results would not have satisfied these entry requirements. Those students who do not meet the requirements have to enrol in one of the two intervention courses reported in this study.
ways of improving the learning experience of students in the QL intervention course.
Ethical clearance was sought to carry out the study at the institution of higher learning. The students were asked to sign a consent form indicating their voluntary participation in the study, and their agreement to be participants for the duration of the study.
Research data for this study constituted the following: NBT QL scores and QL intervention course-assessment scores for Test 1, Test 2, and the examination. In addition, the students’ written work from Test 1, Test 2, and the examination on questions testing the concept of rates was analysed.
The study used the repeated measures-research design which is also known as the within-subjects design. In general, this research design allows for more than a single assessment of the dependant variable to be made on a single subject of the study. Maxwell and Delaney (2003) identified two major advantages of the repeated measures design. Firstly, more information is obtained from the same subject of research. This is advantageous in cases where it is costly or difficult to get a large group of study subjects. Furthermore, this implies that the sample size to reach statistical power is easily achieved by obtaining more information from the same subjects. The second advantage highlighted by Maxwell and Delaney (2003) is that comparisons are made between subjects, which implies that variability between subjects is removed.
There are, however, a few disadvantages to using the repeated measures design method. Tanguma (1999) identified three main disadvantages: The first is termed “practise effects”, that is, subjects getting used to being assessed by the same instrument. If the same test is given to students on two occasions, there is a chance that they develop practise effects. In the context of this study, different tests on the same subject, with increasing difficulty were given to students, thus avoiding practise effects. The second disadvantage is termed “differential carryover effects”, that is, the effect of the first assessment on the second assessment will be different from the effect of the second assessment on the third assessment. This effect was reduced by allowing sufficient breaks between assessments. Lastly, there is the potential for violations for statistical assumptions. The assumptions that are prone to violations are independence of observations, multivariate normality and sphericity (Nimon and Williams 2009). For this study, the statistical assumptions were tested and there were no violations observed.
The repeated measures statistical tests were conducted using StataCorp (2015) Software. Preliminary quantitative data cleaning was conducted in Microsoft Excel.
FINDINGS
tracking student performance on three questions on rates, that is, one question each from Test 1, Test 2, and the final examination through the analysis of the students’ written transcripts.
The results presented in this section are based on the performance of the 117 students who made up the study sample. Table 1 shows the distribution of the sample by gender and performance on the NBT QL. The results show that most of the students in the sample were female. The NBT QL scores show that more than half of the students achieved an Intermediate lower or Basic level.
Table 1: Distribution of the numbers and proportions of the students according to gender and NBT QL performance
Demographic characteristic Number of students Proportion of students (%) Gender
Male 30 26
Female 87 74
Total 117 100
NBT QL Performance
Basic 13 11
Intermediate Lower 60 51
Intermediate Upper 31 27
Proficient 13 11
Total 117 100
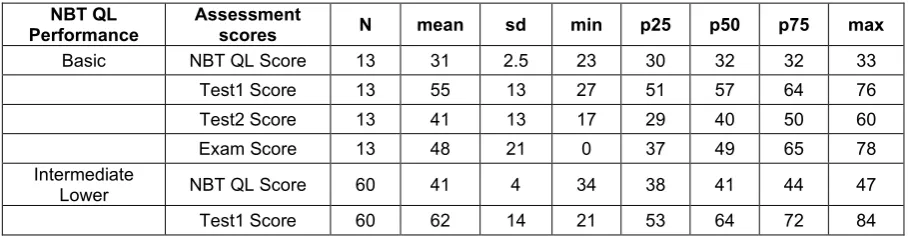
Table 2 shows a comparison of the performance on the NBT QL and the three other tests in the QL intervention course. The scores of all four tests were converted to percentages for ease of comparison. The comparison was conducted using the three NBT performance levels, namely the Basic, Intermediate lower, Intermediate Upper and Proficient.
The results show that Test 1 had the highest mean score, followed by the final exam score, while the NBT QL had the lowest mean. The summary statistics suggest that Test 1 might have been easier than the other three assessments. One-way repeated measures of analysis of variance (ANOVA) and t-tests were conducted to check whether there was any statistical difference between the mean scores in the four different tests.
Table 2: Comparison of performance on NBT QL and QL Intervention Tests
NBT QL
Performance Assessment scores N mean sd min p25 p50 p75 max
Basic NBT QL Score 13 31 2.5 23 30 32 32 33
Test1 Score 13 55 13 27 51 57 64 76
Test2 Score 13 41 13 17 29 40 50 60
Exam Score 13 48 21 0 37 49 65 78
Intermediate
Lower NBT QL Score 60 41 4 34 38 41 44 47
NBT QL
Performance Assessment scores N mean sd min p25 p50 p75 max
Test2 Score 60 44 14 0 35 44 52 76
Exam Score 60 55 19 0 46 59 68 83
Intermediate
Upper NBT QL Score 31 54 4.8 48 50 54 59 62
Test1 Score 31 73 16 19 66 74 83 96
Test2 Score 31 55 17 0 47 56 66 91
Exam Score 31 64 20 0 62 66 78 98
Proficient NBT QL Score 13 69 6 63 65 68 71 83
Test1 Score 13 77 8 62 73 77 78 96
Test2 Score 13 64 9 50 56 63 73 77
Exam Score 13 67 22 0 64 73 77 90
Total NBT QL Score 117 46 12 23 38 44 54 83
Test1 Score 117 66 16 19 57 68 77 96
Test2 Score 117 49 16 0 37 49 60 91
Exam Score 117 58 20 0 49 63 69 98
PAIRED SAMPLE t-TESTS
The results showed that there was a statistically significant difference between the mean scores of QL Score (46%) and Test 1 (66%) (46% vs 66%, t = -14.3, p-value <0.05). This means the students performed significantly better in Test 1 than in NBT QL. However, the students performed poorly in Test 2 compared to Test 1; the difference in these means scores was statistically significant (66% vs 49%, t = 14.9, p-value <0.05). Although the students had performed poorly in Test 2, the results indicated that there is a statistically significant improvement in the mean score between Test 2 and the final exam (49% vs 58%, t = -6.0, p-value <0.05). Finally, the results show that there was a statistically significant improvement in the mean score between the NBT QL and the final QL exam. In relative terms, the mean score for the whole sample increased from 46 per cent to 58 per cent (t = -6.0, p-value <0.05).
One-way repeated measures Analysis of Variance (ANOVA)
In addition to the t-tests comparison in the previous section, a one-way repeated measures Analysis of Variance test was conducted to determine if there were any differences between the mean scores observed in the four QL tests. This assessment was intended to show whether there was significant improvement for each student whilst controlling for individual student differences.
poor-performing students and higher poor-performing students experienced similar improvements in performance. To answer this question, the one-way repeated measures ANOVA was conducted separately for students with different levels of the NBT QL performance.
The results showed that the QL intervention course elicited statistically significant differences in mean test scores over the four different testing sessions for students in the NBT QL Basic [(F = 3, 36) = 15.3, p<0.05], Intermediate lower [(F = 3, 177) = 47.6, p<0.05] and Intermediate upper [(F = 3, 90) = 22.8, p<0.05] levels. However, the results also show that the QL intervention did not result in a statistically significant improvement for students with NBT QL Proficient scores [(F = 3, 36) = 2.4, p = 0.08]. Although there was no statistically different change for these students, the mean comparison shows that these students achieved the highest marks compared to other NBT QL groups.
Analyses of students’ performance on the concept of rates
In this section, we analyse students’ performance across the three assessments on the concept of rates; particularly, we analyse students’ understanding of the instruction, “calculate a ‘whole’ given a rate, and a corresponding quantity”. The analyses constitute students’ conceptual and procedural knowledge on questions 1d in Test 1, 2d in Test 2, and the 5b in the examination where the rates are expressed per 100, 1 000, and 100 000 respectively. In the context of these three questions, procedural knowledge refers to the students’ ability to manipulate sequentially mathematical skills such as calculations, and conceptual knowledge relates to the interpretation and application of mathematical concepts to a context (Rittle‐
Johnson, Fyfe and Loehr 2016).
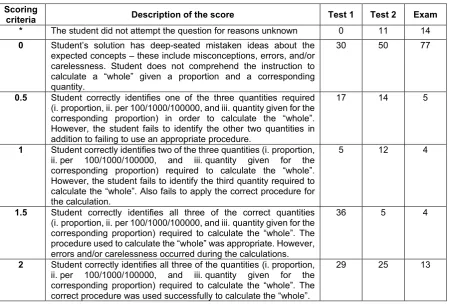
Table 3: Distribution of students’ scores for questions 1d, 2d, and 5b, in Test 1, Test 2, and examination respectively
Scoring
criteria Description of the score Test 1 Test 2 Exam
* The student did not attempt the question for reasons unknown 0 11 14
0 Student’s solution has deep-seated mistaken ideas about the expected concepts ‒ these include misconceptions, errors, and/or carelessness. Student does not comprehend the instruction to calculate a “whole” given a proportion and a corresponding quantity.
30 50 77
0.5 Student correctly identifies one of the three quantities required (i. proportion, ii. per 100/1000/100000, and iii. quantity given for the corresponding proportion) in order to calculate the “whole”. However, the student fails to identify the other two quantities in addition to failing to use an appropriate procedure.
17 14 5
1 Student correctly identifies two of the three quantities (i. proportion, ii. per 100/1000/100000, and iii. quantity given for the corresponding proportion) required to calculate the “whole”. However, the student fails to identify the third quantity required to calculate the “whole”. Also fails to apply the correct procedure for the calculation.
5 12 4
1.5 Student correctly identifies all three of the correct quantities (i. proportion, ii. per 100/1000/100000, and iii. quantity given for the corresponding proportion) required to calculate the “whole”. The procedure used to calculate the “whole” was appropriate. However, errors and/or carelessness occurred during the calculations.
36 5 4
2 Student correctly identifies all three of the quantities (i. proportion, ii. per 100/1000/100000, and iii. quantity given for the corresponding proportion) required to calculate the “whole”. The correct procedure was used successfully to calculate the “whole”.
29 25 13
In addition, Table 3 provides information about the distribution of the students’ scores on questions 1d, 2d, and 5b. In general, the students performed better in Test 1 than in Test 2 and the examination. The reason for this is not clear. However, we assume that students had difficulty with calculating a “whole” using the rates given “per 100” or working with percentages even though they should have covered this in high school mathematics. Given that the questions 1d, 2d, and 5b are based on the same concept of finding the “whole”, one would assume that students would have done better in questions 2d and 5b. This was certainly not the case and could be due to the unfamiliar contexts used for questions 2d and 5b. We posit that transfer of knowledge of elementary mathematics is perceived to be difficult, particularly where learning using an unfamiliar complex context is envisaged (Madison 2004; Jürges et al. 2012).
Example of students’ solutions for questions 1d, 2d, and 5b
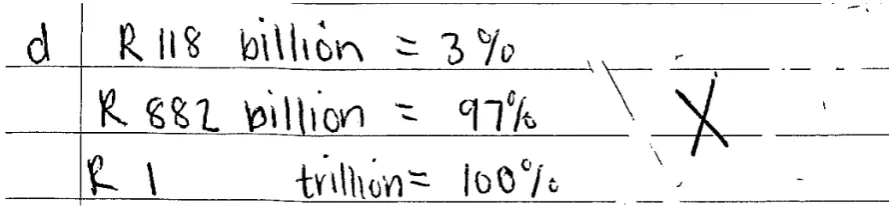
Students’ solution on Test 1. Question 1d context
Social grants in South Africa 1994–2016. The South African government has, since 1994, made available social assistance grants (such as old age, child support and disability grants) as a direct means of combating poverty. In 2014, in his Budget Speech in February, the finance minister said the number of South Africans who were eligible for social assistance grants would increase by 0.7 million to 16.5 million over the next two years. Spending on all social grants (R118 billion in 2014) accounted for 3 per cent of the country’s gross domestic product (GDP) (the total value of all goods and services produced in the country) and was expected to rise by 23 per cent by 2016. Calculate the value of the country’s GDP in 2014 (in trillions).
Figure 1: A student’s solution for question 1d
Figure 2: A student’s solution for question 1d
Figure 3: A student’s solution for question 1d
country’s GDP for year 2014. In Figure 3, the student tried unsuccessfully to calculate 97 per cent of the GDP, instead of 100 per cent. Figure 1 shows that the student successfully calculated the GDP for the year. However, s/he made an error when converting the GDP from the scientific form to an ordinary form. Figures 2 and 3 represent the major conceptual challenges that students experienced in question 1d.
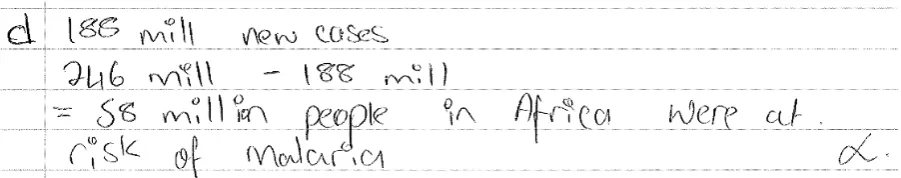
Students’ solution on Test 2. Question 2d context
Table 4 shows the number of new cases per 1000 and the number of deaths per 100 000 due to malaria in the three main regions affected and in the whole world in 2000 and in 2015.
Table 4: Estimated malaria incidence and death rates in the three main regions affected, 2000‒2015
Malaria incidence ‒ new cases per 1000 people at risk of
malaria Change
Malaria death rate – deaths per 100 000
people at risk of malaria
Change
Year 2000 2015 2000‒2015 2000 2015 2000‒2015
Africa 427 246 -42% 153 52 -66%
Source: Adapted from World Malaria Report 2015, a publication of WHO 2015. There were 188 million new cases of malaria in Africa in 2015.
Calculate the number of people who were at risk of malaria in Africa in 2015
Figure 3: A student’s solution to question 2d
Figure 4: A student’s solution to question 2d
of the correct rates: some students used the rate for “malaria deaths” instead of the rate for “malaria incidence”. Of interest was the high number of students (74%) who omitted the question, and scored zero or half. This shows that students experienced a lot of discomfort with conceptual and procedural issues emanating from the calculation of a “whole” using a rate per 1 000.
Figures 3 and 4 represent solutions from students who scored full marks (21%) and zero (43%) respectively on question 2d. Figure 4 shows a solution from a student with some serious conceptual challenges on calculations pertaining to finding a “whole”. Although in different forms, these conceptual challenges were observed in 50 students (43%).
Students’ solution on examination. Question 5b context
The data in this table is adapted from the information obtained from the World Report on Disability, published in 2011 by the World Health Organisation and the 2011 census in South Africa.
Table 5: Prevalence* of severe disability ‒ number and proportion of population “unable to do” a specific function in South Africa and Zambia
South Africa 2011 Zambia 2011 Number
(thousands) (per 100 000) Prevalence (thousands) Number (per 100 000) Prevalence
Seeing 79.2 180 62.4 520
Hearing 57.2 130 63.6 530
Walking 105.6 240 94.8 790
Communicating A 170 37.2 310
Remembering/concentrating 92.4 B 46.8 390
Self-care 330.0 750 64.8 540
*Prevalence of disability: the proportion of the population that is disabled.
Calculate the value of the total population of Zambia that was used in the creation of this table.
Figure 5: A student solution to question 5b
Before writing the examination, students were given feedback in all questions from Test 2. The intention in this question was for the students to calculate the whole given a quantity and a corresponding rate (per 100 000). Only 13 students (11%) successfully calculated the “whole”, as illustrated in Figure 5. About 66 per cent of the students failed to find the “whole” and their solutions were riddled with deep-seated conceptual challenges. For example, in Figure 6, students simply added the absolute numbers under the column “numbers (thousands)” representing the five disabilities for Zambia, which was not correct. In addition, in most instances, the majority of the 77 students (66%) failed to convert the number 62.4 thousand to 62 400. All the students who successfully calculated the population of Zambia used the information on the disability “seeing”. No students used a different rate which could have resulted in a correct calculation of the population of Zambia.
SUMMARY AND CONCLUSION
The findings of this study show, using the means test scores, that students performed significantly better in Test 1 when compared to the NBT QL. However, the students’ performance in Test 2 was much lower than that of Test 1. After a significant drop in the mean scores in Test 2 compared to Test 1, the students’ performance showed significant improvement in terms of mean score in the examination. In other words, barring the slump experienced in Test 2, the trajectory of the students’ performance from the NBT QL test to the end of semester QL examination had an upward trend.
One could argue that students from different levels of the NBT QL, that is, Basic, Intermediate Lower, Intermediate Upper, and Proficient performed differently in the QL intervention course. For example, the students in the NBT QL level of Proficient did not show any significant improvement during the QL intervention course, whereas the other three NBT QL level groups did. In other words, students in the NBT QL level of Proficient performed constantly well during the QL intervention, whilst the students in other NBT QL levels showed significant improvement. A possible explanation, though not part of this study, could be that the QL intervention is particularly suitable for students with lower NBT QL performance levels.
When we tracked students’ performance on the concept of rates, the findings show that the students performed better in Test 1 than in Test 2, and the examination. A possible explanation is that Test 1 used a familiar context – that of social grants in South Africa ‒ and a familiar rate – per 100. In contrast, Test 2 and the examination used more complex rates – per 1 000 and 100 000 respectively ‒ as well as unfamiliar contexts on malaria incidences and prevalence of disability using data obtained from the World Health Organisation (WHO). One of the key cornerstones of QL is that students must be prepared to apply quantitative ideas in unfamiliar contexts that students will encounter in the real world, for instance, at workplaces (Steen 2004). If students are to succeed in learning the mathematical skills embedded in these unfamiliar contexts, then they will be faced with the challenge of “recontextualization of knowledge as ‘it’ [knowledge] crosses boundaries between communities” (Noss and Hoyles 2013, 76) – the two communities being the QL intervention course and the real world of work. In other words, students find the transfer of knowledge from the undergraduate learning context to everyday unfamiliar real situations difficult.
In Test 2 and the examination, students seemed to struggle with the concept of rates which were embedded in contexts which constitute “ill-structured challenges [tasks] that help students rehearse for the complex ambiguities of professional [world of work] life” (Mhakure 2014, 70). Given that the students performed poorly in the examination on the concept of rates, it is possible that a greater proportion of students complete the QL intervention course ill-prepared for the quantitative demands of contemporary life. We opine that students need to be exposed to more familiar contexts during the teaching of QL, particularly contexts that develop the critical thinking and quantitative reasoning skills they will need in real life situations.
These findings provide an initial understanding of students’ experiences as they transition from NBT QL to the final examination of the QL intervention course. The limitation of this study is that it used quantitative techniques in the main, with some qualitative techniques used for analysing students’ written work. What is missing in this study are the students’ narratives that involve and embody their positionality in terms of their experiences in the QL intervention course, which could be the focus of future research.
REFERENCES
Bunting, Ian. 2006. The higher education landscape under apartheid. In Transformation in higher education, 35‒52. Springer.
Cook, Thomas D., Donald Thomas Campbell and William Shadish. 2002. Experimental and quasi-experimental designs for generalized causal inference. Houghton Mifflin Boston.
Engelbrecht, Johann, Christer Bergsten and Owe Kågesten. 2009. Undergraduate students’ preference for procedural to conceptual solutions to mathematical problems. International Journal of
00207390903200968.
Engelbrecht, Johann, Ansie Harding and Marietjie Potgieter. 2005. Undergraduate students’ performance and confidence in procedural and conceptual mathematics. International Journal of
Mathematical Education in Science and Technology 36(7): 701‒712. doi:
10.1080/00207390500271107.
Frith, Vera and Pam Lloyd. 2016. Proportional reasoning ability of school leavers aspiring to higher education in South Africa. Pythagoras 37(1). doi: 10.4102/pythagoras.v37i1.317.
Frith, Vera. and Robert Prince. 2016. Quantitative literacy of school leavers aspiring to higher education in South Africa. South African Journal of Higher Education 30(1): 138‒161. doi: http://dx.doi.org/ 10.20853/30-1-552
Gal, I., M. Van Groenestijn, M. Manly, M. J. Schmitt and D. Tout. 2005. Adult numeracy and its assessment in the ALL survey: A conceptual framework and pilot results. In Measuring adult literacy and life skills: New frameworks for assessment, ed. T. Scott; Clermont Murray, Yvan Binkley Marilyn, 137‒191. Ottawa: Statistics Canada.
Jansen, J. 2011. Results don’t add up. Times Live 12 January. http://www.timeslive.co.za/ opinion/article847919.ece/Results-dont-add-up/?service=print (Accessed 28 July 2017).
Jordan, Joy and Beth Haines. 2003. Fostering quantitative literacy: Clarifying goals, assessing student progress. Peer Review 5(4): 16‒19.
Jürges, Hendrik, Kerstin Schneider, Martin Senkbeil and Claus H. Carstensen. 2012. Assessment drives learning: The effect of central exit exams on curricular knowledge and mathematical literacy.
Economics of Education Review 31(1): 56‒65. doi: https://doi.org/10.1016/
j.econedurev.2011.08.007.
Kelly, S., B. Johnston and M. Baynham. 2003. The adult numeracy handbook: Reframing adult numeracy in Australia, ed. Keiko Yasukawa, Betty Johnston, Sheilagh Kelly. Literacy Adult, Consortium Numeracy Australian Research, Science Australia. Department of Education, Training and Project Australian National Training Authority. Adult Literacy National. Broadway, NSW: NSW.
Madison, Bernard L. 2004. Two mathematics: Ever the Twain shall meet? Peer Review 6(4): 9‒12. Marsden, Emma and Carole J. Torgerson. 2012. Single group, pre- and post-test research designs: Some
methodological concerns. Oxford Review of Education 38(5): 583‒616. doi: 10.1080/03054985. 2012.731208.
Maxwell, Scott E. and Harold D. Delaney. 2003. Designing experiments and analyzing data: A model comparison perspective: Routledge.
Mhakure, Duncan. 2014. Toward an understanding of authentic assessment: A theoretical perspective. 22nd Annual Conference of SAARMSTE – New avenues to transform mathematics, science and technology in Africa, Nelson Mandela Metropolitan University, Port Elizabeth, South Africa, 13‒
16 January 2014.
Nimon, Kim and Cynthia Williams. 2009. Evaluating performance improvement through repeated measures: A primer for educators considering univariate and multivariate designs. Research in Higher Education Journal 2: 1.
Noss, Richard and Celia Hoyles. 2013. Modeling to address techno-mathematical literacies in work. In Modeling students’ mathematical modeling competencies: ICTMA 13, ed. Richard Lesh, Peter L. Galbraith, Christopher R. Haines and Andrew Hurford, 75‒86. Dordrecht: Springer Netherlands. Pitoniak, Mary and Nan Yeld. 2013. Standard setting lessons learned in the South African context:
Implications for international implementation. International Journal of Testing 13(1): 19‒31. DOI: 10.1080/15305058.2012.741085.
Prince, Robert. 2010. The National Benchmark Tests: 2010 Intake Report. Higher Education South Africa Consultative Forum, Johannesburg, May.
Education 26(3): 564‒585.
Rittle‐Johnson, Bethany, Emily R. Fyfe and Abbey M. Loehr. 2016. Improving conceptual and procedural knowledge: The impact of instructional content within a mathematics lesson. British Journal of Educational Psychology 86(4): 576‒591.
StataCorp. 2015. Stata Statistical Software: Release 14.
Steen, Lynn Arthur. 2004. Achieving quantitative literacy: An urgent challenge for higher education: MAA.
Street, Brian and Dave Baker. 2006. So, what about multimodal numeracies. Travel notes from the New Literacy Studies, Multilingual Matters Ltd, Cleveden, Buffalo, Toronto: 219‒233.
Street, Brian V. 2005. At last: Recent applications of new literacy studies in educational contexts. Research in the Teaching of English 39(4): 417‒423.
Tanguma, Jesus. 1999. Analyzing repeated measures designs using univariate and multivariate methods: A primer. In Advances in social science methodology (Vol. 5), ed. B. Thompson, 233–250. Stanford, CT: JAI Press.
Torgerson, David. 2008. Designing randomised trials in health, education and the social sciences: an introduction: Springer.
WHO. 2015. World malaria report 2015: World Health Organization. WHO, see World Health Organisation.
Wilson-Strydom, Merridy. 2012. Using the NBTs to inform institutional understandings of “under-preparedness”: Implications for admissions criteria. South African Journal of Higher Education 26(1): 136‒151.
Wilson‐Strydom, Merridy. 2010. Traversing the chasm from school to university in South Africa: A student perspective. Tertiary Education and Management 16(4): 313‒325.