COMPARISON OF PHYSIOLOGICAL AND 2D KINEMATIC VARIABLES
DURING 2 KM TIME TRIAL ON STATIONARY VERSUS DYNAMIC ROWING
ERGOMETER
Amirah Zahiran, Muhammad Irwan Abdullah, Shazlin Shaharudin
Pusat Pengajian Sains Kesihatan, Unversiti Sains Malaysia, Malaysia
*Email: [email protected]
(Received 15 May 2018; accepted 1 October 2018; published online 17 January 2019)
To cite this article: Zahiran, A., Abdullah, M. I., & Shaharudin, S. (2019). Comparison of physiological and 2d kinematic variables during 2 km time trial on stationary versus dynamic
rowing ergometer. Malaysian Journal of Movement, Health & Exercise, 8(1), 185-195.
https://doi.org/10.15282/mohe.v8i1.244
Link to this article:https://doi.org/10.15282/mohe.v8i1.244
Abstract
This study was conducted to evaluate the differences of physiological and biomechanical variables during 2 km rowing time trials on a stationary versus dynamic ergometer. Ten state-level rowers (male: 6, female: 4) voluntarily participated in the study. Two sessions of 2 km time trial were conducted: one on a static ergometer and another on a dynamic ergometer. Data on oxygen consumption, blood lactate concentration, maximum heart rate, stroke rate, time to completion and lower limb angles at sagittal plane were collected and analysed during the tests. A paired T-test was used to compare the physiological and biomechanical variables across stationary and dynamic ergometer. Stroke rate, maximum heart rate, drive to recovery phase ratio and VO2max showed statistically significant differences during 2 km rowing time trials on stationary versus dynamic ergometer. Moreover, VO2max was inversely related with high correlation to time to completion of 2 km rowing test on both ergometers. Height, body fat and VO2max are the major determinants of 2 km rowing time trials on stationary and dynamic ergometer. The outcomes from this study are important to enhance rowing performance especially for rowers.
Introduction
Rowing is a strength-endurance type of sport in which performance depends on many factors such as physiology, biomechanics, anthropometry, psychology, rowing technique and tactics. As a highly ranked endurance sport, rowing requires large aerobic capacity to maintain a high intensity performance. During a typical race, the body’s aerobic energy system provides approximately 70% of a rower’s required energy, while the anaerobic energy system supplies the remaining 30% of energy required (Webster, Gervais, Syrotuik & Bell, 2006; Kramer, Legar, Paterson & Morrow, 1994; Hunter, Hilyer & Foster, 1993).
It has been reported that VO2max values of collegiate female rowers range from 58 - 65 ml.kg-1.min-1, significantly greater than non-athlete college-age females (VO2max values of approximately 33 - 42 ml.kg-1.min-1) (Steinacker et al., 2000). Furthermore, rowers rank second only to Nordic skiers in terms of endurance (Secher & Volianitis, 2007). As a strength and endurance sport, rowing requires important training adjustments in order to optimize biomechanical and physiological factors. It has been shown that power output and race performance depend on aerobic and anaerobic energy supplies (Mickelson & Hagerman, 1982; Mikulic 2011), mechanical force application (Barrett & Manning, 2004), and the technical skills that determine an athlete’s efficiency (Laursen & Jenkins, 2002: Mandic, Quinney & Bell, 2004). Additionally, rowing performance is highly correlated with anthropometric characteristics (Barrett & Manning, 2004), mean and peak anaerobic power output (Bourdin, Messonnier, Hager & Lacour, 2004; Riechman, Zoeller, Balasekaran, Goss & Robertson, 2002) and maximum oxygen uptake (VO2 max) (Ingham, Whyte, Jones & Nevill, 2002).
Most rowing race training is completed on-water; however, rowing ergometers are still commonly used for performance testing, technique coaching, crew selection and training during poor weather (Soper & Hume 2004). Traditional ergometers are stationary; the rower moves according to the resistance unit of the machine. Stationary rowing has become popular for recreation, rehabilitation, cross training, competition and an adjunct to rowing on the water. Also, it is often prescribed by rowing coaches for on-land fitness training, to aid in seat selection of rowing crews, and to determine rowing race performance and fitness off-water (Klusiewicz, Faff, & Zdanowicz, 1999). On a stationary ergometer, the rower moves his entire body mass up and down the slide, and must absorb large amounts of momentum at the beginning and end of each stroke (Bernstein, 2002). This energy is about six times higher with a stationary flywheel as compared to a dynamic ergometer (Bernstein, 2002).
Although the physiological performance across ergometer design was extensively studied, research on the comparison of biomechanical aspects across different design of rowing ergometer was scarce. Therefore, the purpose of the present study is to compare physiological and biomechanical factors during 2 km time trial rowing performance on a stationary versus dynamic ergometer.
Method
A cross-sectional study design with convenience sampling was adopted. This study involves the all-Terengganu state-level rowing team (6 male, 4 female). Participation in the present study was voluntary. Ethical approval was obtained from Human Research Ethical Committee of Universiti Sains Malaysia (USM/JEPeM/15040122). Only rowers with at least two years of experience in competitive rowing and who were physically healthy without any serious musculoskeletal injuries within six months of data collection were recruited. For each participant, all methods and procedures were thoroughly informed and a written consent was obtained before participating in this study.
The objective of this study was to compare the kinematics and physiological responses during 2 km rowing on stationary and dynamic ergometer. Therefore, two sessions of 2 km time trials were conducted: one on a static ergometer while another on a dynamic ergometer. Extra care were taken in reducing the circadian effect on physiological data by performing the sessions at the same time of the day with at least 24 hours interval between experiments. During the tests, participants were advised to wear tight clothes for ease of movement and accuracy of data collected. Participants were advised to have a light breakfast at least 2 hours before the tests and get at least six hours of sleep during the night prior to the tests.
Prior to the experiments, anthropometric parameters including body weight, body height, body fat composition and blood pressure were measured. A portable stadiometer (Seca 220, Germany) was used to measure the height of the subjects. Body weight and composition were measured using a Body Composition Analyzer (TANITA, model TBF-410, Japan).
A 2 km time trial was conducted on Concept 2 ergometer (model E, Morrisville, USA). The aim of the test was to cover the 2 km in the shortest possible time, and the participants should be exhausted at the completion of the trial. Participants warmed up for five minutes by rowing without resistance on the ergometer before the test start. During the tests, drag factor was applied according to Australian Rowing Team Ergometer Protocols. Blood lactate, oxygen consumption and kinematic data were collected during the tests. After the test completion, participants cooled down for five minutes by rowing on the ergometer.
During the 2 km time trial tests on both the dynamic and static ergometer, the rowing motion was captured using digital camera (SONY HDR-CX240, Japan) at sagittal plane. Then, kinematic data were analysed using Siliconcoach Pro (version 8, The Tam Group, UK). The kinematic variables during the 2 km time trial on both ergometers were recorded in five separate sections with 400m interval between the sections, with at least 10 rowing strokes were captured for each section. The angle of knee and hip joints and drive to recovery phase ratio were evaluated.
Cortex MetaMax3B portable metabolic system (MM3B, Leipzig, Germany) was used to measure the metabolic variables such as oxygen consumption (VO2), carbon dioxide production (VCO2), respiratory exchange ratio (RER) and expired ventilation (VE). The measurements of breath-by-breath using MetaMax3B were averaged over 30s interval (Shaharudin, Zanotto, & Agrawal, 2014). A heart rate monitor (Polar, Electro Oy, Finland) was used to measure the heart rate during the tests.
Statistical Analysis
Descriptive data were expressed as means and standard deviation. The normality of the data was assessed using Shapiro-Wilk test. To examine the research hypotheses, Paired T-test was used to compare the dependent variables, which are the physiological and biomechanical variables across the stationary and dynamic ergometers. All statistical analysis was carried out using SPSS version 22 (IBM Corp, Armonk, New York). The significance level for analyses was set at p < 0.05, as per standard scientific conventions.
Results
This research involved a total of 10 state-level rowers (male: 6, female: 4) recruited from the Terengganu Rowing Team. All data were normally distributed as determined by Shapiro-Wilk test; therefore, a parametric test was applied. The descriptive statistics of rowers’ physical characteristics are presented in Table 1.
Table 1: Descriptive statistics of physical characteristics of participants (N=10)
Physical characteristics Mean ± SD
Age (years) 20.6 ± 1.8
Height (m) 168.5 ± 4.8
Mass (kg) 67.2 ± 6.3
Fat mass (kg) 23.05 ± 9.6
* m=meter, kg=kilogram, bpm=beats per minute, mmHg=millimetre
Table 2: Correlation of physical characteristics and 2 km time trial on dynamic and stationary ergometers (N=10)
Physical characteristics Time trial on
stationary ergometer
Time trial dynamic ergometer
R p value R p value
Height (m) -0.754* 0.012 -0.748* 0.013
Mass (kg) -0.381 0.278 -0.456 0.185
Fat mass (kg) 0.864* 0.001 0.828* 0.003
* = p value< 0.05, m=meter, kg=kilogram
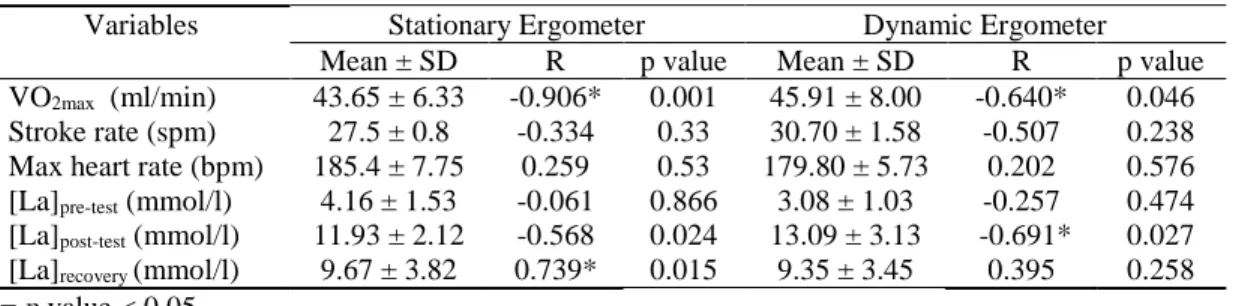
There were no significant differences in VO2max and blood lactate concentration (at pre- and post-test and recovery phase) during the 2 km time trial on dynamic and stationary ergometers. However, maximum heart rate (p-value = 0.001) was significantly greater during 2 km time trial on stationary ergometer than dynamic ergometer while stroke rate (p-value = 0.038) was significantly greater during 2 km time trial on dynamic ergometer than stationary ergometer. Table 3 shows the correlation between physiological variables during 2 km time trial and type of ergometer.
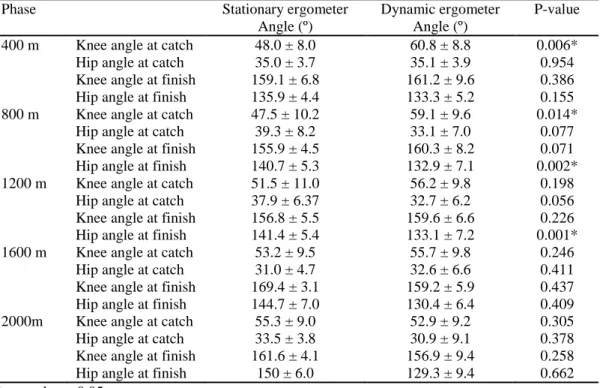
The drive and recovery phase ratio during 2 km time trial rowing on stationary and dynamic ergometer is presented in Table 4. The ratio was significantly different across type of ergometer at the 800m, 1200m and 1600m sections. The hip and knee angles in sagittal plane at catch and finish positions were compared across type of ergometers (Table 5).
Table 3: Relationship of physiological variables during 2 km time trial and type of ergometer (N=10)
Variables Stationary Ergometer Dynamic Ergometer
Mean ± SD R p value Mean ± SD R p value
VO2max (ml/min) 43.65 ± 6.33 -0.906* 0.001 45.91 ± 8.00 -0.640* 0.046
Stroke rate (spm) 27.5 ± 0.8 -0.334 0.33 30.70 ± 1.58 -0.507 0.238
Max heart rate (bpm) [La]pre-test (mmol/l)
[La]post-test (mmol/l)
[La]recovery (mmol/l)
185.4 ± 7.75 4.16 ± 1.53 11.93 ± 2.12
9.67 ± 3.82
0.259 -0.061 -0.568 0.739* 0.53 0.866 0.024 0.015
179.80 ± 5.73 3.08 ± 1.03 13.09 ± 3.13
9.35 ± 3.45
0.202 -0.257 -0.691* 0.395 0.576 0.474 0.027 0.258 * = p value< 0.05
Table 4: Comparison of drive to recovery phase ratio in sagittal plane at catch and finish positions during 2 km time trial on stationary and dynamic ergometer
Distance Stationary
ergometer
Dynamic ergometer
P-value
400m 0.94 ± 0.17 0.90 ± 0.15 0.455
800m 1.08 ± 0.05 0.94 ± 0.13 0.004*
1200m 1.06 ± 0.06 0.90 ± 0.15 0.002*
1600m 1.06 ± 0.05 0.91 ± 0.15 0.005*
2000m 1.02 ± 0.08 1.08 ± 0.14 0.273
Table 5: Comparison of hip and knee angles in sagittal plane at catch and finish positions during 2 km time trial on stationary and dynamic ergometer
Phase Stationary ergometer
Angle (º)
Dynamic ergometer Angle (º)
P-value
400 m Knee angle at catch 48.0 ± 8.0 60.8 ± 8.8 0.006*
Hip angle at catch 35.0 ± 3.7 35.1 ± 3.9 0.954
Knee angle at finish 159.1 ± 6.8 161.2 ± 9.6 0.386
Hip angle at finish 135.9 ± 4.4 133.3 ± 5.2 0.155
800 m Knee angle at catch 47.5 ± 10.2 59.1 ± 9.6 0.014*
Hip angle at catch 39.3 ± 8.2 33.1 ± 7.0 0.077
Knee angle at finish 155.9 ± 4.5 160.3 ± 8.2 0.071
Hip angle at finish 140.7 ± 5.3 132.9 ± 7.1 0.002*
1200 m Knee angle at catch 51.5 ± 11.0 56.2 ± 9.8 0.198
Hip angle at catch 37.9 ± 6.37 32.7 ± 6.2 0.056
Knee angle at finish 156.8 ± 5.5 159.6 ± 6.6 0.226
Hip angle at finish 141.4 ± 5.4 133.1 ± 7.2 0.001*
1600 m Knee angle at catch 53.2 ± 9.5 55.7 ± 9.8 0.246
Hip angle at catch 31.0 ± 4.7 32.6 ± 6.6 0.411
Knee angle at finish 169.4 ± 3.1 159.2 ± 5.9 0.437
Hip angle at finish 144.7 ± 7.0 130.4 ± 6.4 0.409
2000m Knee angle at catch 55.3 ± 9.0 52.9 ± 9.2 0.305
Hip angle at catch 33.5 ± 3.8 30.9 ± 9.1 0.378
Knee angle at finish 161.6 ± 4.1 156.9 ± 9.4 0.258
Hip angle at finish 150 ± 6.0 129.3 ± 9.4 0.662
* = p value< 0.05
Discussion
Rowing is a strength endurance type of sport. The rower’s body size and mass are performance related factors. The physical characteristics of the mean age, height, mass and fat mass of the male and female rowers are presented in Table 1. The height and mass stature of the state–level athletes varies between male rower lightweight (165-173 cm and 63kg-69kg, respectively) and female lightweight (162-168cm and 57kg-60kg, respectively). Our results indicate that our national junior rowers are shorter compared to rowers from China (So, Tse & Wong, 2007) and lighter than rowers from the United States of America (DeRose, Crawford, Kerr, Ward & Ross, 1989). Weight classification has been part of rowing in the World Championships since 1974 and in the Olympic Games since 1996 at the senior level. Carter and Heath (1984) suggested that height and mass of national standard athletes are increasing by about 2cm and 5kg per decade, respectively. Rodriguez (1986) stated that rowers are on average 6.7 cm taller and 11.9 kg heavier than lightweight rowers.
(Secher, 1983), and long strokes are closely identified with high-level rowing performance (Ingham et al., 2002).
On the other hand, body fat mass was directly related with high correlation to time to completion of 2 km rowing test on both ergometers. Therefore, our results indicate that rowers with more fat mass tend to take more time to complete 2 km time trial. Rowing performance has been found to correspond closely to the fat-free mass values (Cosgrove et al., 1999). According to Yoshiga and Higuchi (2003), greater fat-free mass is associated with higher aerobic capacity, which is crucial for successful rowing performance. In studies designed to determine the best performance predictive parameters (Ingham et al., 2002; Riechman et al., 2002), fat-free mass emerged as one of the strongest correlates with performance. Moreover, it was shown in Australian lightweight rowers, greater total muscle mass was associated with faster 2 km time. This is thought to be due to an association between lean body mass, blood volume and stroke volume of the heart (Slater et al., 2005).
However, we observed no significant correlation of body mass and 2 km time trial performance on dynamic and stationary ergometers. This is contradictory to findings by Ingham et al. (2000) which observed that body mass is an important anthropometric characteristic which strongly correlates with performance. The level of expertise of recruited rowers, different model of ergometer used, and a different method of applying drag factor could be reasons behind the discrepancy.
The current study found that there was no statistically significant difference of VO2max during 2 km time trial on dynamic and stationary ergometers (Table 3). Moreover, our finding showed that VO2max was inversely related with high correlation to time to completion of 2 km rowing test on both ergometers. The relationship means that with larger aerobic capacity (measured as VO2max), rowers are able to complete 2 km time trial rowing test in shorter duration. Ingham et al. (2002) stated that VO2max is one of the variables most often correlated with rowing performance. Furthermore, a high correlation between the 2 km time trial on ergometer and VO2max value has also been previously reported (Cosgrove et at., 1999).
Furthermore, stroke rate was significantly greater during 2 km time trial on dynamic ergometer than stationary ergometer, because the slide mechanism on dynamic ergometer provides ease of movement during the recovery phase (Mello et al., 2014). On the other hand, maximal heart rate was significantly greater during 2 km time trial on stationary ergometer than dynamic ergometer. This is due to greater total work, as the rower needs to accelerate and decelerate his centre of mass at the end of each stroke when rowing on a stationary ergometer. Our findings are similar to a previous study by (Shaharudin & Agrawal, 2015) despite using different type of race simulation test (e.g., 2 km time trial versus 6 minutes maximal rowing test). Stroke rate, however, did not show relevant correlation with 2 km time to completion in the present study. Hofmijster, Van Soest and Koning (2006) also suggested that higher stroke rates produce higher net mechanical power output. It must be noted that rowers most likely will not be able to maintain high power output found at the highest stroke rates during a 2 km race.
sections, a longer drive phase was achieved on the dynamic ergometer. Typically, a fast drive phase and a slow recovery during a single stroke are common among elite and junior rowers (Cerne, Kamnik, Vesnicer, Gros & Munih, 2013). According to Dawson, Lockwood, Wilson and Freeman (1998), force changes which may be attributed to fatigue, require rowers to pull more stokes per minute to maintain the same power output, which they do by decreasing the duration of recovery phase, rather than the drive period.
Kinematic variables including hip and knee angles were compared across types of ergometer during separate sections of 2 km time trial (Table 5). Further analysis showed that greater knee flexion at the catch position was observed while rowing on the dynamic rather than the stationary ergometer during the first and second 400m sections of 2 km time trial. Next, more hip extension at finish position was observed while rowing on the stationary than the dynamic ergometer during the second and third 400m sections of 2 km time trial. No other statistically significant differences were observed in other sections across the type of ergometers. According to Caldwell, McNair and Williams (2003), rowers attained relatively high levels of lumbar flexion during rowing which further increased with increase duration of rowing. Furthermore, greater use of the lumbar spine towards the end of the rowing piece may be attributed to fatigue (Holt, Bull, Cashman & McGregor, 2003). Due to high incidence of lower back pain among rowers, Stallard (1999) suggested a lower degree of hip flexion, particularly at the catch. Our results showed that kinematical changes at knee and hip joints were not distinguishable across type of ergometers except at certain limited phases. However, three dimensional studies should be conducted to gain more accurate information on kinematical changes across three planes of motion during rowing.
Conclusions
The purpose of the current study was to compare the biomechanical and physiological variables during 2 km rowing time trial on stationary and dynamic ergometer. Findings from this study may provide insights regarding important variables that may determine the outcomes of rowing performance. Height, body fat and VO2max are the major determinants of 2 km rowing time trial on both the stationary and dynamic ergometer. Rowers showed significantly shorter drive phase at the middle of 2 km time trial during rowing on dynamic ergometer than stationary ergometer. Increased knee flexion at the catch position was observed at the early sections of 2 km time trial on the dynamic ergometer. On the other hand, increased hip extension was noted at the finish position when rowing on the stationary ergometer.
Acknowledgments
References
Barrett, R. S. & Manning, J. M. (2004). Relationships between rigging set-up, anthropometry, physical capacity, rowing kinematics and rowing performance. Sports
Biomechanics, 3(2), 221–235.
Benson, A., Abendroth, J., King, D., & Swensen, T. (2011). Comparison of rowing on a Concept 2 stationary and dynamic ergometer. Journal of Sports Science and Medicine, 10(2), 267–227.
Bernstein, I. A. (2002). An ergonomic comparison of rowing machine designs: Possible implications for safety. British Journal of Sports Medicine, 36(2), 108–112.
Bourdin, M., Messonnier, L., Hager, J. P., & Lacour, J. R. (2004) Peak power output predicts rowing ergometer performance in elite male rowers. International Journal Sports Medicine, 25(5), 368-373.
Caldwell, J. S., McNair, P. J., & Williams, M. (2003). The effects of repetitive motion on lumbar flexion and erector spinae muscle activity in rowers. Clinical
Biomechanics, 18(8), 704-711.
Carter, J. E. L., & Heath, B. H. (1984). Somatotyping: development and application. Cambridge: Cambridge University Press.
Cerne, T., Kamnik, R., Vesnicer, B., Gros, J. Z., & Munih, M. (2013). Differences between elite, junior and non-rowers in kinematic and kinetic parameters during ergometer rowing. Human Movement Science,32(4), 691-707.
Cosgrove, M. J., Wilson, J., Watt, D., & Grant, S. F. (1999). The relationship between selected physiological variables of rowers and rowing performance as determined by a 2,000 m ergometer test. Journal Sports Science,17(11), 845–852.
Dawson, R. G., Lockwood, R. J., Wilson, J. D. & Freeman, G. (1998). The rowing Sources of variance and invariance in ergometer and on-the water performance. Journal Motor Behaviour, 30(1), 33-43.
DeRose, E. H., Crawford, S. M., Kerr, D. A., Ward, R., & Ross, W. D. (1989). Physique characteristics of Pan American Games lightweight rowers. International Journal Sports Medicine, 10(4), 292-297.
Hofmijster, M. J., Van Soest, a. J., & De Koning, J. J. (2006). Rowing skill affects power loss on a modified rowing ergometer. Medicine and Science in Sports and Exercise, 40(6), 1101–1110.
Hunter, G. R, Hilyer, J., & Forster, M. A. (1993). Changes in fitness during 4 years of intercollegiate basketball. Journal of Strength and Conditioning Research, 7(1), 26-29.
Ingham, S., Whyte, G., Jones, K., & Nevill, A. (2002). Determinants of 2,000 m rowing ergometer performance in elite rowers. European Journal of Applied Physiology, 88(3), 243–246.
Jensen, K., Johansen, L., & Secher, N. H. (2001). Influence of body mass on maximal oxygen uptake: effect of sample size. European Journal of Applied Physiology, 84(3), 201-205.
Klusiewicz, A., Faff, J., & Zdanowicz, R. (1999). Diagnostic value of indices derived from specific laboratory tests for rowers. Biology of Sport, 16(1), 39-50.
Kramer, J. F., Leger, A., Paterson, D. H., & Morrow, A. (1994). Rowing performance and selected descriptive, field, and laboratory variables. Canadian Journal of Applied Physiology, 19(2), 174-184.
Laursen, P. B., & Jenkins, D. G. (2002). The scientific basis for high-intensity interval training: optimising training programmes and maximising performance in highly trained endurance athletes. Sports Medicine, 32(1), 53-73.
Mandic, S., Quinney, H. A., & Bell, G. J. (2004). Modification of the Wingate anaerobic power test for rowing: Optimization of the resistance setting. International Journal
Sports Medicine, 25(6), 409-414.
Mello, F. D. C., Bertuzzi, R., Franchini, E., & Robin, C. (2014). Rowing ergometer with the slide is more specific to rowers’ physiological evaluation. Research in Sports Medicine, 22(2), 136–146.
Mickelson, T. C., & Hagerman, F. C. (1982). Anaerobic threshold measurements of elite oarsmen. Medicine Science Sports Exercise, 14(6) 440-444.
Mikulic, P. (2011). Maturation to elite status: A six-year physiological case study of a world champion rowing crew. European Journal of Applied Physiology, 111(9), 2363-2368.
Riechman, S. E., Zoeller, R. F., Balasekaran, G., Goss, F. L., & Robertson, R. J. (2002). Prediction of 2000 m indoor rowing performance using a 30 s sprint and maximal oxygen uptake. Journal Sports Science, 20(9), 681-687.
Rodriguez, F. A. (1986). Physical structure of international lightweight rowers. In: Reilly T, Watkins J, Borms J, eds. Kinanthropometry III. London: E and FN Spon, 255–261.
Rossi, J., Piponnier, E., Vincent, L., Samozino, P., & Messonnier, L. (2015). Influence of ergometer design on physiological responses during rowing. International Journal
Secher, N. H., & Volianitis, S. S., (2007). Handbook of Sports Medicine and Science, Rowing. Malden, MA: Blackwell Pub.
Secher, N. H. (1983). The physiology of rowing. Journal of Sports Sciences, 1(1), 23–53.
Shaharudin, S., & Agrawal, S., (2015). Muscle synergy of collegiate rowers during 6 min maximal rowing on fixed and slides ergometer. Journal of Medical and Bioengineering, 4(4), 263-269.
Shaharudin, S. & Agrawal, S., (2016). Muscle synergies during incremental rowing VO2max test collegiate rowers and untrained subjects. Journal of Sports Medicine &
Physical Fitness,56(9), 980–989.
Shaharudin, S., Zanotto, D. & Agrawal, S., (2014). Muscle synergy during Wingate anaerobic rowing test of collegiate rowers and untrained subjects. International Journal
of Sports Science, 4(5), 165-172.
Slater, G. J., Rice, A. J., Mujika, I., Hahn, A. G., Sharpe, K., & Jenkins, D. G, (2005). Physique traits of lightweight rowers and their relationship to competitive success. British Journal of Sports Medicine, 39(10), 736-741.
So, R. C. H., Tse, M. A., & Wong, S. C. W. (2007). Application of surface electromyography in assessing muscle recruitment patterns in six-minute continuous rowing effort. Journal
of Strength and Conditioning Research, 21(3), 724-730.
Soper, C. & Hume, P. A. (2004). Towards an ideal rowing technique for performance: The contributions from biomechanics. Sports Medicine, 34(12), 825–848.
Stallard, M. (1999). The challenge of rowers backache. Sport and Medicine, 1(2), 53–55.
Steinacker, J. M., Lormes, W., Kellmann, M., Liu, Y., Reissnecker, S., Opitz-Gress, A., Baller, B., Günther, K., Petersen, K. G., Kallus, K. W., Lehmann, M., & Altenburg, D. (2000). Training of junior rowers before world championships. Effects on performance, mood state and selected hormonal and metabolic responses. Journal Sports Science Physical Fitness, 40(4), 327-335.
Webster, T. G., Gervais, P. L., Syrotuik, D. G., & Bell, G. J. (2006). The combined effects of 8-weeks aerobic and resistance training on simulated 2000-meter rowing performance and the related biomechanical and physiological determinants in men and women.
Advanced Exercise Sports Physiology, 12(4), 135-143.