DEVELOPMENT AND APPLICATION OF SURFACE COATINGS FOR MICROCHIP CAPILLARY ELECTROPHORESIS-ELECTROSPRAY IONIZATION-MASS
SPECTROMETRY ANALYSIS OF BIOLOGICAL ANALYTES
Nicholas G. Batz
A dissertation submitted to the faculty at the University of North Carolina at Chapel Hill in partial fulfillment of the requirements for the degree of Doctor of Philosophy in the Department
of Chemistry.
Chapel Hill 2014
iii ABSTRACT
Nicholas G. Batz: Development and Application of Surface Coatings for Microchip Capillary Electrophoresis-Electrospray Ionization-Mass Spectrometry Analysis of Biological Analytes
(Under the direction of J. Michael Ramsey)
This work describes the development of improved surface coating methods for microchip capillary electrophoresis-electrospray ionization-mass spectrometry (CE-ESI-MS) and their application for the analysis of biological analytes. A new coating method based on chemical vapor deposition (CVD) of aminopropyl silane (APS) reagents is demonstrated. The method improved the efficiency of separations over previously used surface coatings while also promoting batch processing of multiple devices at once. The separation performance was quantified using a new efficiency metric based on CE theory. Microchips coated via CVD produced the most efficient liquid phase separations coupled to MS reported to date.
The CVD method was found to produce a base layer well suited for subsequent
modification. APS surfaces administered via CVD were modified with n-hydroxy succinimide (NHS) esters of polyethylene glycol (PEG) with varying PEG chain lengths. These coatings were found to produce highly efficient separations while offering a range of electroosmotic flow (EOF) values. PEGylation resulted in increased peak capacity and resolution as compared to APS coatings for the separation of intact proteins and digested proteins using CE-ESI microchips coupled with MS.
iv
These devices were capable of CE separation times ranging from 10 s to < 1 s. To adequately sample the temporally narrow peaks generated by these devices a new MS data collection with increased data acquisition rates was developed. Both MS and tandem MS analyses were
demonstrated using this high speed MS data acquisition method. The HSCE-ESI-MS separations performed on the 1 cm microchip are the fastest liquid phase separations coupled to MS reported to date.
v
TABLE OF CONTENTS
LIST OF TABLES……….……….ix
LIST OF FIGURES..……….………..x
LIST OF ABBREVIATIONS...xiv
LIST OF SYMBOLS...xvii
CHAPTER 1: INTRODUCTION TO BIOANALYSIS VIA MICROCHIP CAPILLARY ELECTROPHORESIS-ELECTROSPRAY IONIZATION-MASS SPECTROMETRY ...………...……….…1
1.1 Capillary zone electrophoresis theory and practical considerations..………….….1
1.2 Motivations for microfluidic CE-ESI-MS for bioanalysis………...3
1.3 Work described in this dissertation...………....6
1.4 References...………....8
CHAPTER 2: CHEMICAL VAPOR DEPOSITION OF AMINOPROPYL SILANES IN MICROFLUIDIC CHANNELS FOR HIGHLY EFFICIENT MICROCHIP CE-ESI-MS…...10
2.1 Introduction………10
2.2 Experimental………..…14
2.2.1 Reagents and materials………...14
vi
2.2.3 Fabrication of microfluidic devices………...16
2.2.4 Chemical vapor deposition coating procedure………...16
2.2.5 Operation of microfluidic devices……….17
2.2.6 CE-LIF data collection and analysis………..18
2.2.7 CE-ESI data collection and analysis………..19
2.3 Results and discussion………..….20
2.3.1 Characterization of CVD deposited aminopropyl silane coatings by CE-LIF...20
2.3.2 Device-to-device reproducibility of the CVD coating method...22
2.3.3 Characterization of stability for CVD deposited aminopropyl silanes…...23
2.3.4 CE-ESI-MS of peptide standards...25
2.3.5 CE-ESI-MS of enolase tryptic digest...27
2.3.6 CE-ESI-MS of intact proteins...29
2.4 Conclusions...31
2.5 References...35
CHAPTER 3: AMINOPROPYL SILANE-POLYETHYLENE GLYCOL SURFACE COATINGS FOR MODULATING THE EOF OF HIGHLY EFFICIENT CE-ESI-MS...39
3.1 Introduction...39
vii
3.2.1 Reagents and materials...42
3.2.2 Fabrication of microfluidic devices...43
3.2.3 Surface coating methods...44
3.2.4 Surface characterization via CE-LIF...45
3.2.5 Peptide and protein analyses via CE-ESI-MS...47
3.3 Results and discussion...48
3.3.1 Surface coating characterization...48
3.3.2 APTES PEGylation and non-functionalized PEG...50
3.3.3 CE-ESI-MS of enolase tryptic digest...52
3.3.4 CE-ESI-MS of intact proteins...55
3.4 Conclusions...59
3.5 References...61
CHAPTER 4: HIGH SPEED MICROCHIP CAPILLARY ELECTROPHORESIS- ELECTROSPRAY IONIZATION-MASS SPECTROMETRY WITH FAST SCANNING MS DETECTION...63
4.1 Introduction...63
4.2 Experimental...65
4.2.1 Reagents and materials...65
4.2.2 Fabrication of microfluidic devices...66
viii
4.2.4 Operation of microfluidic devices...67
4.2.5 High speed mass spectrometry data collection...68
4.2.6 Data analysis for high speed MS and MS/MS...69
4.3 Results and discussion...70
4.3.1 Data acquisition for HSCE-ESI-MS...70
4.3.2 HSCE-ESI-MS of peptide standards with high speed and efficiency...76
4.3.3 HSCE-ESI-MS/MS of BSA tryptic digest...78
4.3.4 Future directions...80
4.4 Conclusions...83
4.5 References...85
CHAPTER 5: RESULTS SUMMARY, MOST RECENT WORK, AND FUTURE WORK...87
5.1 High efficiency CVD surface coatings...87
5.2 Tunable EOF surface coatings...89
5.3 PEG450 coatings for intact monoclonal antibody analysis...90
5.4 On-chip sample cleanup for CE-ESI-MS of ESI-MS incompatible fluids...94
ix
LIST OF TABLES
Table 2.1 – Performance of APDIPES coated microfluidic devices...22
Table 2.2 – Diffusion coefficients measured by stopped-flow in 50% acetonitrile, 0.1% formic acid...24
Table 2.3 – Peaks observed by CE-ESI-MS of the intact protein mixture...32
Table 3.1 – Applied voltage profiles for CE-LIF analyses...47
Table 3.2 – Applied voltage profiles for CE-ESI-MS analyses...47
Table 3.3 – Intact protein masses and ep values...58
Table 4.1 – Voltage profiles for HSCE analyses...68
Table 4.2 – Data acquisition parameters and sampling...74
x
LIST OF FIGURES
Figure 1.1 – Double layer cartoon depicting relative ion ratios and the
potential drop across the Stern layer, diffuse layer, and into the bulk solution...2 Figure 2.1 – Schematics for the microfluidic chip designs used for CE-LIF and
CE-ESI, respectively. Microchannel depths were 10 m for all devices.
All other dimensions presented in the text...15 Figure 2.2 – Data from stopped-flow LIF experiments performed in
50% acetonitrile, 0.1% formic acid using a mixture of fluorescein and rhodamine 6G. The slope of each plot indicates the rate of band
broadening and is used to determine the molecular diffusion coefficient...21 Figure 2.3 – Representative data for CE-LIF performance analysis using a
cross-channel microfluidic device with a separation channel length of 3 cm. Electropherograms for a mixture of fluorescein and rhodamine 6G
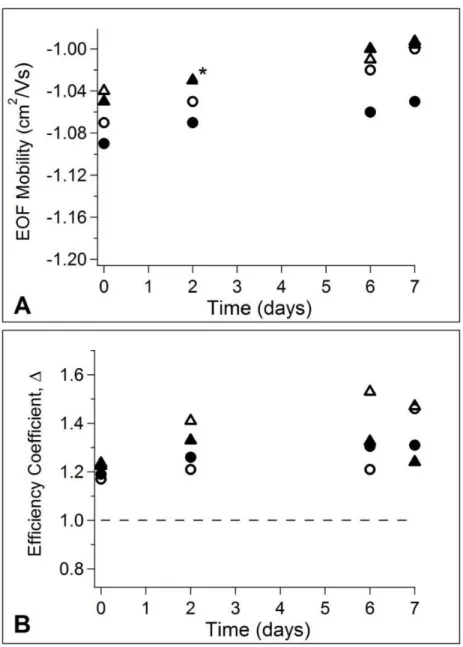
were acquired at the separation distances indicated...23 Figure 2.4 – Performance of microfluidic devices coated with APTES
and APDIPES. APTES coatings are displayed as triangles, APDIPES as circles. Open symbols indicate vacuum storage at 4 °C whereas closed symbols indicate wet storage at room temperature. A) Electroosmotic mobility versus time. B) Efficiency coefficient versus time. Overlapping data for APTES runs are
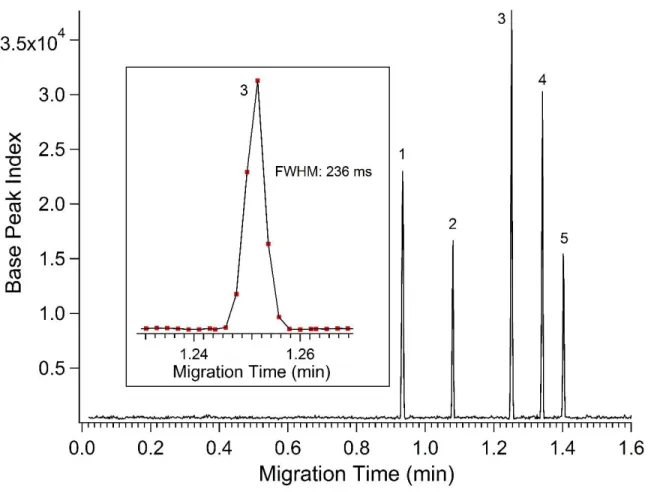
indicated with an asterisk...27 Figure 2.5 – Base peak electropherogram showing; fluorescein
(1), methionine enkephalin (2), angiotensin II (3), bradykinin (4) and thymopentin (5) separated using a CE-ESI
microfluidic device coated with APDIPES using a field strength of 410 V/cm and 50% acetonitrile, 0.1% formic acid (pH 2.8) BGE. Mass spectra were acquired with a Synapt G2 mass spectrometer
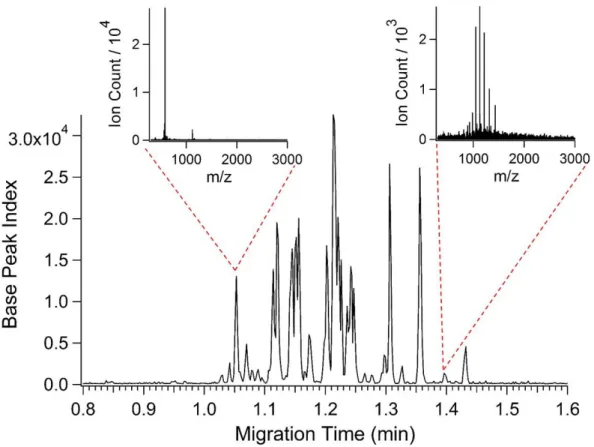
at a rate of 8 summed scans per second...28 Figure 2.6 – Base peak electropherogram for the analysis of a
5 M tryptic digest of the enzyme enolase. All other experimental conditions were the same as in Figure 2.4. MS spectra insets show a doubly charged peptide with a molecular weight of 1,156.6 Da eluting at 1.05 min as well as a protein envelope eluting at
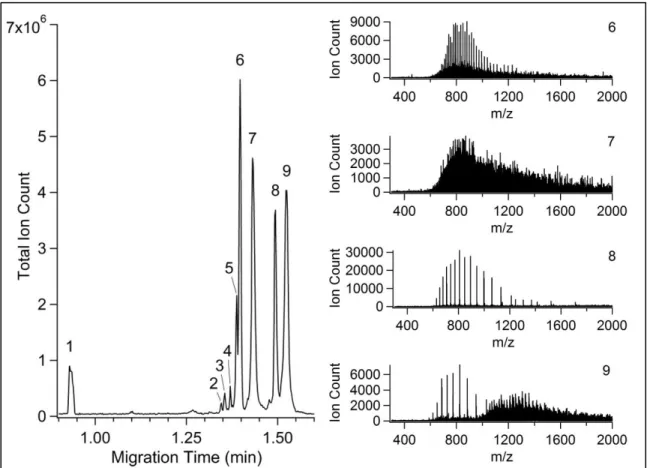
1.4 min associated with a 15.7 kDa molecular weight species...30 Figure 2.7 – TIC electropherogram of an intact protein standard analyzed
xi
spectra for the most intense protein bands including the co-elution
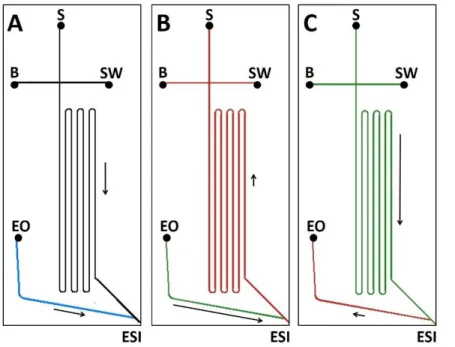
of cytochrome c and the larger protein BSA in peak 9...32 Figure 3.1 – Microfluidic chip design and surface coatings used for CE-ESI.
A) Separation channel coated with PEG24 (black) and native glass EO
pump channel (blue) used for the separation of tryptic peptides. B) Separation channel coated with PEG450 (red) and EO pump channel
coated with APDIPES (green) used for separation of intact proteins. C) Separation channel coated with APDIPES (green) and EO pump channel coated with PEG450 (red) used for comparison to devices with
PEGylated separation channels. Arrows indicate EOF direction and
relative magnitude for each microchannel...44 Figure 3.2 – A study of EOF versus PEG chain length for PEG reagents ranging
from 4 to 450 polymer units. PEG12 – PEG450 coatings are represented by
red diamonds. The green circle represents data from devices coated with APDIPES only. The PEG4 coating is represented by a black triangle
(excluded from fit). EOF was reduced to a minimum of 3.2 x10⁻⁵ cm2V-1s-1. The red dashed line is a double exponential fit to all points excluding the PEG4 surfaces (see text for discussion on exclusion). Error bars are
± one standard deviation (n = 3). Error bars for most PEG coatings are
within the markers...49 Figure 3.3 – A plot of EOF versus PEG chain length using APTES as the base
layer. The EOF of the APTES surface is represented by the green circle. NHS-PEG reagents are represented with black diamonds. Error bars are ± one standard deviation (n = 3). As compared to the plot generated when APDIPES was used as the base layer this plot shows a narrower range of EOF magnitudes, less reproducibility for all PEG reagents studied, and a minimum EOF that is an order of magnitude greater than
that achieved with APDIPES-PEG450...51
Figure 3.4 – Comparison of 5 M enolase tryptic digest separations performed on different surface coatings using 50% acetonitrile, 0.1% formic acid BGE. A) PEG24 coated device operated at 375 V-1cm-1. B) PEG24 coated device
operated at 745 V-1cm-1. APDIPES coated device operated at 375 V-1cm-1. C) APDIPES coated device operated at 375 V-1cm-1. Peak numbers
correspond to the same peptides in each electropherogram to
facilitate comparisons...53 Figure 3.5 – Total ion count electropherograms comparing separations of a 5 M
mixture of intact proteins on a CE-ESI microfluidic device coated with
xii
Figure 4.1 – Microfluidic chip designs used for HSCE-ESI. Both designs consist of three elements; a separation channel, an injection cross with tapered channels, and electroosmotic (EO) pump channels for integrated ESI. All channels were etched to 10 m deep. A 1-cm long separation channel is incorporated in design A, design B has a 3-cm long separation channel; separation channels for each design were 30 m wide
after etching...66 Figure 4.2 – Schematic of the MS instrument SIP signal voltage pattern, the
timing of high speed MS detection, and synchronized functions of the microchip. The user programs the instrument with an MS scan time to match the CE separation window. The ISD determines the total CE injection time and is also user controlled. The user also programs the total experiment run time. By varying the run time the user can capture a single CE injection or multiple CE injections that are summed into a
single file at the end of the run time...71 Figure 4.3 – HSCE-ESI-MS separation of two intact proteins, -lactoglobulin
and lysozyme. Separations were performed on a HSCE device with a 3 cm separation channel using 10 M sample in 50% acetonitrile, 0.1% formic acid. Approximately 2 femtomoles of each protein were injected. A) Total ion count electropherograms with varying data acquisition rates; 222 Hz (red, top) and 53 Hz (black, bottom). The inset highlights the sampling across the -lactoglobulin peak. B) Mass spectrum acquired by summing data across the -lactoglobulin peak. The inset in panel B is zoomed in on the most intense -lactoglobulin charge state, highlighted with a green dashed box, showing the presence of two variants of the protein. C) Mass spectrum acquired by summing data across the
lysozyme peak...74 Figure 4.4 – Base peak index electropherogram for the HSCE-ESI-MS
separation of a mixture containing fluorescein, methionine enkephalin, angiotensin II, bradykinin and thymopentin (listed from shortest to longest migration time). Data were obtained using a 3 cm device at
an electric field strength of A) 1,500 V/cm and B) 500 V/cm...77 Figure 4.5 – A) HSCE-ESI-MS/MS low energy, base peak index
electropherogram of a 10 M BSA tryptic digest in 50% acetonitrile, 0.1% formic acid acquired on a device featuring a 3 cm separation channel. The separation was performed at a field strength of 500 V/cm (< 1 femtomole injected) with an acquisition rate of 40 Hz using the dead time exclusion method. B) Low energy mass spectrum of peak
highlighted in panel A; green peaks correspond to the +3 and +2 charge states of the selected BSA tryptic fragment. C) High energy mass
xiii
y-type ions in red. Fragments exhibiting a mass shift of -18 Da,
corresponding to water loss, are noted with a superscript “o”...79 Figure 4.6 – HSCE-ESI-MS of peptides in record speed. The extracted ion
electropherogram was obtained using a 1 cm device operated at an
electric field strength of 2,400 V/cm...82 Figure 5.1 – Peptide standards plus fluorescein separated on a CE-ESI
microchip with a 1 m separation channel. The applied field strength
was 300 V/cm with 50% acetonitrile, 0.1% formic acid BGE...88 Figure 5.2 – Enolase tryptic digest separated on a CE-ESI microchip with a
23 cm separation channel. The applied field strength was 600 V/cm with
50% acetonitrile, 0.1% formic acid BGE...90 Figure 5.3 – Cartoon of the typical IgG structure containing two light chains
(green) and two heavy chains (blue) connected via disulfide bonds
(yellow). A conserved site for glycosylation which occurs at an arginine residue common to most IgGs is annotated with the letter “N”. The
C-termini of each heavy chain, where the addition or subtraction of a
lysine residue is common, are annotated with the letter “C”...91 Figure 5.4 – Enolase tryptic digest separated on a CE-ESI microchip with a 23 cm
separation channel coated with PEG450. The applied field strength was
600 V/cm with 10% 2-propanol, 0.2% acetic acid BGE. The protein variant containing two C-terminal lysines is annotated as 2-K, one lysine as 1-K, and zero lysines as 0-K. (Figure and data analysis courtesy of E.A. Redman
and J.S. Mellors)...93 Figure 5.5 – A schematic of a CE-ESI microchip with a 23 cm separation channel
showing the coating strategy used for analysis of samples with ESI-MS incompatible matrix components. Channels coated with APDIPES are in green, channels coated with PEG450 are in red. Black arrows denote EOF
xiv
LIST OF ABBREVIATIONS
APDIPES (3-aminopropyl)di-isopropylethoxysilane
APS aminopropyl silane, general APTES (3-aminopropyl)triethoxysilane
BGE background electrolyte BSA bovine serum albumin CCD charge-coupled device
CE capillary (zone) electrophoresis cm centimeter, 10-2 meters
CVD chemical vapor deposition D true diffusion coefficient
experimentally apparent diffusion coefficient Da Dalton, mass unit defined as grams per mole DAQ data acquisition
E electric field strength
EOF electroosmotic flow ESI electrospray ionization
xv Hz Hertz, defined as 1/second
IMS ion mobility spectrometry
kDa kilo-Dalton, defined as 103 Daltons KOH potassium hydroxide
kV kilo-Volt, defined as 103 Volts LC liquid chromatography
separation distance
LIF laser-induced fluorescence mL milli-liter, defined as 10-3 liters
mM milli-molar, unit of concentration defined as 10-3 moles per liter
MS mass spectrometry
mg milli-gram, unit of mass defined as 10-3 grams
mW milli-Watt, unit of power defined as 10-3 Watts NHS n-hydroxy succinimide/succinimidyl
N theoretical plate count
N/m theoretical plates per meter PEG polyethylene glycol
xvi RMS root mean square
Rs electrophoretic resolution
RSD relative standard deviation
s seconds
t time
xvii
LIST OF SYMBOLS
°C degrees Celsius
sigma, used to denote the statistical standard deviation of a peak
spatial variance
mobility, general
mobility, electroosmotic
̅ mobility, average electrophoretic m micrometer, 10-6 meters
CHAPTER 1: INTRODUCTION TO BIOANALYSIS VIA MICROCHIP CAPILLARY ELECTROPHORESIS-ELECTROSPRAY IONIZATION-MASS SPECTROMETRY
1.1 Capillary zone electrophoresis theory and practical considerations
Capillary zone electrophoresis (CE) is an analytical separations technique that separates molecules based on differences in their electrophoretic mobility ( ) under the influence of an electric field.1-4 The glass or fused silica capillaries with which CE is often performed have a charged surface giving rise to bulk fluid flow due to electroosmosis (EOF).2 The summed vector of both the EOF ( ) as well as an analyte’s dictates the analyte’s apparent mobility ( ) as defined in eq 1.1.
(1.1)
Differences in between analytes leads to separation in CE. The extent of resolution ( ) in CE is dependent on the applied voltage ( ), , and the average electrophoretic mobility of the analytes ( ̅ ), according to eq 1.2:5
( ) [ ̅
] ⁄
(1.2)
The resolution ( ) is also influenced by the diffusivity ( ) of the analyte molecules, and the magnitude of the voltage applied ( ). These properties also greatly influence the efficiency of a CE separation. CE separation efficiency, in terms of theoretical plates ( ), is defined in eq 1.3:6
( )
2
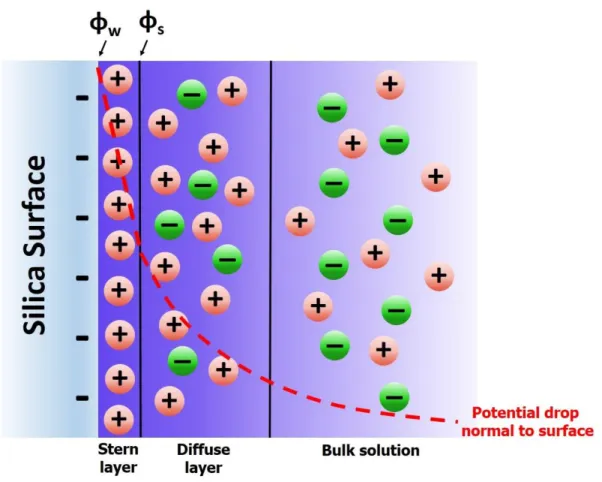
The magnitude of is dictated by both the static charge at the walls of the CE conduit as well as the thickness of the electrical double-layer that is formed due to charged species in solution.6 Figure 1.1 is a cartoon of the conditions that give rise to EOF in CE. The cartoon describes the electrical double layer and the approximate nature of the potential drop across this layer localized near the surface, into the bulk solution of the conduit.7
Figure 1.1 Double layer cartoon depicting relative ion ratios and the potential drop across the Stern layer, diffuse layer, and into the bulk solution.
3
a mobile diffuse layer. Net flow of cations in the diffuse layer gives rise to EOF. The electrical potential drops in an exponential fashion across the diffuse layer into the bulk solution where charge neutrality exists. The size of the diffuse layer is impacted by the ionic strength of the BGE as well as the -potential. The higher the ionic strength of the BGE, the smaller the diffuse layer will be. The larger the electrical double layer the greater the electromotive force and the higher the EOF. The magnitude of the EOF impacts both the separation resolution as well as the analysis time in addition to the resolution and efficiency contributions described in eq 1.1 and eq 1.2, respectively.
Reducing the analysis time minimizes band broadening because in CE band broadening is ideally due to axial-diffusion only. A system with a high -potential and low ionic strength BGE will result in high EOF and a short analysis time. This high EOF condition also reduces the relative differences in appleading to limited resolution. From eq 1.2 it is evident that increasing
the voltage applied is one method by which the resolution can be improved. All of these conclusions are supported by CE theory under the assumption that there is zero interaction between analyte bands and the walls of the CE conduit. Any analyte-wall interactions introduce mass transfer effects and non-diffusional band broadening which is not accounted for in the above equations. With analyte-wall interactions present the benefits of reducing analysis time in CE, with respect to efficiency, are negated as band broadening is no longer diffusion-limited. Additionally, increasing the voltage will exacerbate non-diffusion band broadening effects further decreasing separative performance.
1.2 Motivations for microfluidic CE-ESI-MS for bioanalysis
4
due to their intrinsic complexity as well as the analytically challenging nature of the matrices in which they are found. Often the complexity of bioanalytes necessitates sample preparation as well as separation steps prior to analysis. Capillary electrophoresis (CE) is capable of highly efficient separations with short analysis times and microfluidic devices have emerged as an excellent platform for CE.8, 13, 19-21 Microfluidic devices have achieved separation efficiencies of greater than 1 million theoretical plates22 and sub-second analysis times.21 Prior work utilizing microfluidic CE has often relied on optical detection methods which are inherently fast and well suited to optically transparent microchips.15-16, 19, 21 However, optical detection methods such as laser induced fluorescence (LIF) are information-limited when compared to mass spectrometry (MS). For microfluidic devices to be truly impactful in the field of bioanalysis it is imperative that they be coupled with MS due to the information rich nature of MS and the increasing complexity of biological analytes of interest.
5
post-translational modifications which may affect protein function.23-24 Ideally, peptide mapping experiments achieve 100% sequence coverage. Due to its reliance on hydrophobic retention mechanisms, hydrophilic peptides with low molecular weight are often excluded from reverse phase LC-MS analyses.23 CE, as opposed to LC, does not depend on the hydrophobicity or hydrophilicity of analytes and as such offers an orthogonal and potentially improved separation approach to LC for peptide analyses.
Despite the potential advantages of increased efficiency, increased sequence coverage, and reduced analysis times offered by CE-ESI-MS, adoption of the method by the scientific community has been slow. This can be attributed to multiple practical drawbacks associated with CE. One major hurdle to the realization of theoretical CE-ESI-MS performance for biological analytes is the integration of CE with ESI. The integration capabilities of microfluidic devices have proven to be particularly effective at overcoming this challenge when compared to CE-ESI performed in traditional fused-silica capillaries.8, 23 Another aspect of CE that has been
detrimental to its wide spread use is surface adsorption of analytes. Biological analytes, such as intact proteins especially, have a tendency to interact with surfaces. These surface interactions, which are critical for the selectivity of LC, inhibit the efficiency of CE substantially. Surface control can be particularly challenging for CE methods that are ESI-MS compatible due the simple background electrolytes (BGEs) commonly used for sensitive ESI-MS. Finally, a third mitigating factor limiting the applicability of CE-ESI-MS to biological analytes commonly analyzed by LC-MS is the lack of preconcentration which often limits CE-ESI-MS sensitivity.
6
peptides, partially digested proteins, and intact proteins with masses of approximately 150 kDa. The separation efficiency of these devices was improved using new surface coating technologies developed in lab.8 In addition to integrating highly efficient CE separations with sensitive ESI-MS analysis, additional surface coating technology developments have enabled in-line sample clean-up in an effort to minimize bench top sample preparation methods for bioanalytes and improve CE sensitivity. These advancements have opened up new application space for the analysis of complex biological analytes of interest using microfluidic devices or so called micro-total analysis systems.18
1.3 Work described in this dissertation
In this dissertation the development of surface coating technology for microfluidic CE-ESI-MS of biological analytes is reported and discussed. Surface coatings play a vital role in achieving the theoretical performance advantages of CE while maintaining ESI-MS
compatibility. Despite their importance, surface coating methods in the literature were found to offer performance that was poor relative to theoretical expectations for CE. Chapter 2 discusses the current state of coating methodologies in the literature, their short-comings, and the
requirements that must be met for the successful application of CE-ESI-MS to complex
7
8 1.4 References
1. Jorgenson, J. W., Lukacs, K. D., Clin. Chem. 1981, 27. 1551-1553. 2. Jorgenson, J. W., Lukacs, K. D., J. Chromatogr. 1981, 218. 209-216. 3. Jorgenson, J. W., Lukacs, K. D., Anal. Chem. 1981, 53. 1298-1302. 4. Jorgenson, J. W., Lukacs, K. D., Science 1983, 222. 266-272. 5. Jorgenson, J. W., Trac-Trends in Anal. Chem. 1984, 3. 51-54.
6. Lukacs, K. D., Jorgenson, J. W., HRC & CC, J. High Resolut. Chromatogr. Chromatogr. Commun. 1985, 8. 407-411.
7. Kirby, B. J., Hasselbrink, E. F., Electrophoresis 2004, 25. 187-202.
8. Batz, N. G., Mellors, J. S., Alarie, J. P., Ramsey, J. M., Anal. Chem. 2014, 86. 3493-3500.
9. Mellors, J. S., Black, W. A., Chambers, A. G., Starkey, J. A., Lacher, N. A., Ramsey, J. M., Anal. Chem. 2013, 85. 4100-4106.
10. Flangea, C., Schiopu, C., Capitan, F., Mosoarca, C., Manea, M., Sisu, E., Zamfir, A. D., Centr. Euro. J. Chem. 2013, 11. 25-34.
11. Chambers, A. G., Mellors, J. S., Henley, W. H., Ramsey, J. M., Anal. Chem. 2011, 83. 842-849.
12. Mellors, J. S., Jorabchi, K., Smith, L. M., Ramsey, J. M., Anal. Chem. 2010, 82. 967-973. 13. Mellors, J. S., Gorbounov, V., Ramsey, R. S., Ramsey, J. M., Anal. Chem. 2008, 80.
6881-6887.
14. Haeberle, S., Zengerle, R., Lab Chip 2007, 7. 1094-1110.
15. Jacobson, S. C., Koutny, L. B., Hergenroder, R., Moore, A. W., Ramsey, J. M., Anal. Chem. 1994, 66. 3472-3476.
16. Jacobson, S. C., Hergenroder, R., Moore, A. W., Ramsey, J. M., Anal. Chem. 1994, 66. 4127-4132.
17. Jacobson, S. C., Hergenroder, R., Koutny, L. B., Warmack, R. J., Ramsey, J. M., Anal. Chem. 1994, 66. 1107-1113.
9
19. Culbertson, C. T., Jacobson, S. C., Ramsey, J. M., Anal. Chem. 2000, 72. 5814-5819. 20. Culbertson, C. T., Jacobson, S. C., Ramsey, J. M., High efficiency separations on
microchip devices. 2000; p 221-224.
21. Jacobson, S. C., Hergenroder, R., Koutny, L. B., Ramsey, J. M., Anal. Chem. 1994, 66. 1114-1118.
22. Culbertson, C. T., Jacobson, S. C., Ramsey, J. M., Anal. Chem. 2000, 72. 5814-5819. 23. Ramautar, R., Heemskerk, A. A. M., Hensbergen, P. J., Deelder, A. M., Busnel, J.-M.,
Mayboroda, O. A., J. Proteomics 2012, 75.
CHAPTER 2: CHEMICAL VAPOR DEPOSITION OF AMINOPROPYL SILANES IN MICROFLUIDIC CHANNELS FOR HIGHLY EFFICIENT MICROCHIP CE-ESI-MS
2.1 Introduction
Electrospray ionization (ESI) has revolutionized the study of large biological molecules by combining the power of mass spectrometry (MS) with liquid phase separation methods. The most successful embodiment of this concept is liquid chromatography (LC)-ESI-MS of
enzymatically digested proteins. For applications such as drug development and proteomics, LC-ESI-MS has become the gold standard for analysis. Much work has also been put forth to couple capillary electrophoresis (CE) with ESI-MS,1 but CE-ESI-MS has achieved less widespread use at this time. CE offers some potential advantages over LC, particularly for separating intact proteins.2-7 In practice, however, most CE-ESI-MS separations do not achieve theoretically achievable separative performance, thus allowing potential for significant improvements. Efficient ESI of peptides and proteins requires the use of acidic, low ionic strength background electrolytes (BGE).1, 8 Under these conditions the native silica or glass surfaces of typical CE capillaries/channels exhibit poor electroosmotic flow (EOF) stability and analyte bands can be broadened by surface interactions. To counteract these deficiencies, surface coatings are commonly employed.9 For compatibility with cationic analytes and positive ESI, static,
11
A recent example from the literature provides an excellent benchmark for the type of work being done in this field. Faserl et al. investigated the performance of three different coatings (polyethyleneimine, PolyE-323, and M7C4I) for CE-ESI-MS of peptides.11 They used meter-long fused silica CE capillaries with porous tip emitters for sensitive sheathless ESI. The best separation performance was achieved using the covalently-attached M7C4I coating. The results reported are superior to most CE-ESI-MS analyses of peptides found in the literature, however, a detailed analysis of band broadening was not included. A comparison of
experimental performance to theoretical limits is uncommon in CE-ESI-MS literature, making it difficult to quantitatively compare different systems. This paper did report an average peak width of 3.8 seconds for an approximately 6 min separation window centered at a migration time of 9 min. Using these data we calculate an average separation efficiency of 295,000 theoretical plates and a peak capacity of 95. While these values are impressive when compared to other reports of CE peptide separations, a more rigorous evaluation is necessary to determine whether or not performance could be improved.
The number of theoretical plates (N) that can be generated in a diffusion limited CE separation is given by:
(2.1) where is the effective analyte mobility, E the electric-field strength, the separation
12
the efficiency is theoretically independent of separation distance. Under ideal conditions freely migrating bands will broaden due to molecular diffusion only.22-24 An ideal CE separation can therefore be described as diffusion-limited. For a diffusion-limited separation the time-dependent axial spatial variance ( ) of the analyte band is governed by the Einstein-Smoluchowski
equation.25
(2.2)
From eq 2.2 we can determine an apparent diffusion coefficient ( ) for any analyte band within a CE separation where:
(2.3)
Highly efficient separations will yield a value that is comparable to the molecular diffusion coefficient of the analyte indicating that axial dispersion is limited to diffusion. Separations suffering from Joule heating,26 analyte-wall interactions,27 Taylor dispersion28 or other sources of extraneous band broadening will display values that are elevated relative to . The ratio of the apparent diffusion coefficient, determined from a migrating band, to the molecular diffusion coefficient provides a clear measure of the quality of the separation. In this work we define this metric as :
(2.4)
A theoretically optimal CE separation will have a value of 1. Larger values of indicate greater deviation from ideal separation performance, and thus room for improvement. From eq 2.1 and eq 2.3 the theoretically optimal separation efficiency can be related to the experimentally observed separation efficiency by:
13
We therefore, refer to the value as the “efficiency coefficient” of a CE separation. This value directly indicates how efficient a CE separation would be if all extraneous sources of band broadening were removed.
The results for average peptide separation performance reported by Faserl et al. can be used to determine the value of their separation. Using a conservative estimate for the molecular diffusion coefficient of peptides (5 x10⁻⁶ cm2/s) we calculate an average value of 8, or the possibility of improving the separation performance by eight fold. The optimized separation efficiency would increase from 300,000 to 2.4 million theoretical plates and the peak capacity would be improved from 95 to 268.24, 29
The microfluidic CE-ESI devices reported here feature an integrated ESI interface with virtually zero dead volume and the ability to inject sample bands with temporal widths as narrow as 10 ms.5 These devices minimize extra-column band broadening such that the quality of the surface coating is the efficiency-limiting component of the platform. Attempts to optimize the performance of these devices led us to develop improved surface modification methods. Surface coatings administered in the liquid phase, both in our lab5, 14, 30-31 and in the literature,9-12, 17-18, 20,
32
, fall short of theoretically optimal performance. Microscopic examination of the movement of fluorescent analyte bands in our microfluidic devices coated with a liquid phase reagent (PolyE-323)5, 14 revealed Taylor dispersion attributed to non-uniform surface coating as a cause of extraneous band broadening. Spatial heterogeneity of -potential, has been shown to induce band broadening in CE.13, 33-37 Chemical vapor deposition (CVD) has been used to form highly
14
multiple devices. Moreover, this approach could be beneficial for the modification of nanofluidic devices as the small dimensions often mitigate liquid flushing methods.
In this work microfluidic CE devices were coated by CVD of aminopropylsilane (APS) reagents. We describe a microfluidic CE method for rigorously evaluating the performance of the surface coatings with regard to EOF, separation efficiency, and stability. In particular, we
measured the performance and EOF of three different devices at pH 2.8 and pH 7.5 for comparison to liquid-phase APS coatings described in the literature. Device-to-device
reproducibility of the coating method was evaluated for 20 different devices coated over an 80-day period. Stability of coatings formed with two different APS reagents was measured over a 1-week period. In addition to these evaluations of coating performance, a device with an integrated ESI interface was coated using the CVD method and used for microfluidic CE-ESI-MS of peptides and intact proteins.
2.2 Experimental
2.2.1 Reagents and materials
MS-grade organic solvents (acetonitrile, methanol, 2-propanol), formic acid (99.9%), ammonium acetate, and potassium hydroxide were obtained from Fisher Chemical (Fairlawn, NJ). Water was purified with a Nanopure Diamond water purifier (Barnstead International, Dubuque, IA). Fluorescein, rhodamine 6G (R6G), and (3-Aminopropyl)triethoxysilane (APTES) were obtained from Sigma-Aldrich (St. Louis, MO). (3-Aminopropyl)di-isopropylethoxysilane (APDIPES) was obtained from Gelest (Morrisville, PA). Peptide analytes bradykinin,
15 2.2.2 Microfluidic device designs
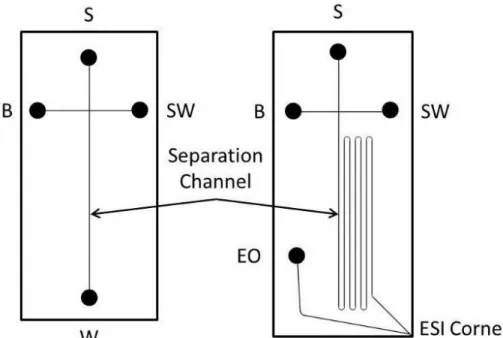
Schematics of the two microfluidic designs used for this work are shown in Figure 2.1. The device used for rigorous analysis of band-broadening and EOF of aminopropyl silane coatings was a simple cross design. This design incorporates two functional elements: an injection cross and a 3 cm separation channel. Laser induced fluorescence (LIF) detection was used with this chip design. The CE-ESI device includes four functional elements: an injection cross, a serpentine separation channel (23-cm long), an electroosmotic pump, and an ESI orifice. The reservoir labels indicate sample (S), background electrolyte (B), sample waste (SW), waste (W, CE-LIF only), and electroosmotic pump (EO, CE-ESI only) reservoir locations.
Microchannel dimensions for both devices were 10 m deep and 70 m wide. The serpentine turns of the CE-ESI device were asymmetrically tapered to a width of 25m to minimize geometrical band broadening.5, 42-43
Figure 2.1Schematics for the microfluidic chip designs used for CE-LIF and CE-ESI,
16 2.2.3 Fabrication of microfluidic devices
Devices for microfluidic CE with LIF detection were fabricated in-house from 0.9 mm thick B270 glass purchased from Telic Company (Valencia, CA). Previously described
photolithography and wet chemical etching techniques were used.5, 44 A total of 27 of these devices were used for the work presented here. The device used for microfluidic CE with integrated electrospray ionization (ESI) was fabricated by Caliper Life Sciences (Hopkinton, MA) using our mask design. This device was made with 0.5 mm thick B270 glass. The corner of the device used for ESI was polished in-house to remove dicing imperfections using a lapping wheel with 3 m lapping paper from Ultra Tec (Santa Ana, CA). Glass cylinders, 8 mm in diameter, were attached to all devices for use as solvent reservoirs with a chemically resistant epoxy (Loctite E-120HP, Henkel Corporation, Germany).
2.2.4 Chemical Vapor Deposition coating procedure
APS coatings were administered in the gas phase at low pressure using a commercially available LabKote CVD system (Yield Engineering Systems, Livermore, CA). Prior to CVD coating, devices were pretreated by flushing for 15 min with a mixture of 1 g of potassium hydroxide (KOH) dissolved in 25 mL of 80% 2-propanol-20% water solution. Flushing was accomplished by applying suction to the waste port of LIF devices or the ESI corner of CE-ESI devices (Figure 2.1). The pretreatment step was followed with a rigorous rinsing of the microfluidic channels as well as all other surfaces of the chip and fluid reservoirs with deionized water. After rinsing, pretreated channels were dried by applying suction to the channel inlet reservoirs using house vacuum on the bench top.
17
vacuum chamber, 2) injection and subsequent vaporization of the APS reagent, 3) “soak” period in which reagent vapor is held in the chamber, 4) evacuation purges to remove all reagent vapors. Steps 1-4 were repeated a total of three times for each coating procedure before removing the devices from the CVD system. Each dehydration purge consisted of three pressure cycles in which the chamber was pumped down to a pressure of 0.1 Torr then refilled with dry nitrogen gas. Evacuation purges consisted of four pressure cycles to ensure minimal residual APS vapor was present. After dehydration 0.3 mL of reagent was injected and vaporized resulting in a pressure rise from 0.1 Torr to 2.0 Torr. Each injection was followed by a 15 min soak period. The chamber was held at 130 °C for APTES depositions and 160 °C for APDIPES depositions. All other instrument parameters were the same for each reagent used. The total time for the coating procedure was approximately 1 hour. Coated devices were allowed to cool to room temperature prior to use. Anyone attempting to build a CVD system or working with silanes should be careful to avoid releasing harmful vapor into the ambient air of the laboratory. Note, the CVD process coats both the internal and external surfaces of microfluidic devices;
appropriate personal protective equipment should be worn when handling silanized devices. 2.2.5 Operation of microfluidic devices
18
from UltraVolt Inc. (Ronkonkoma, NY). Three of the modules (10A12N4) could supply 0 to -10 kV while the other two modules could supply 0 to +10 kV. The power supplies were controlled via an SCB-68 breakout box connected to a PC via a PCI 6713 DAQ card. A LabVIEW program was used to control voltage outputs. For CE-LIF the voltages applied to the S, B, SW, and W reservoirs were 0, 0, 1.4, and 2 kV, respectively (Figure 2.1). To open the electrokinetic gate for sample injection the voltages were switched to 0, 0.6, 0.8, and 2 kV for 20 ms. These voltages yielded an electric field strength of 550 V/cm in the separation channel. For CE-ESI the voltages applied to the S, B, SW, and EO reservoirs were -6, -6, -5, and 6.2 kV respectively. To open the electrokinetic gate for sample injection the voltages were switched to -6, -5.5, -5.5, and 6.2 kV for 200 ms. These voltages yielded an electric field strength of 410 V/cm in the separation channel and an ESI voltage of +4.8 kV relative to the MS inlet. 2.2.6 CE-LIF data collection and analysis
19
CCD color video camera, Model DXC-390 (Sony Corp, Japan) and a Nikon Intensilight mercury arc lamp. Devices to be analyzed were filled with background electrolyte (BGE) by applying suction at the waste port using house vacuum. Once filled with BGE the device was mounted on the microscope using a custom polycarbonate stage (to minimize the chance of electrical arcing). Sample was loaded into the sample reservoir using a micropipette. Voltages were applied to electrokinetically gate and inject sample as described previously.43 Electronic injection profiles were constructed in LabVIEW to automatically perform a series of five replicate CE injections. Prior to initiating the injection profile, 3-5 test injections were performed to ensure that the migration times were stable. The profile of replicate injections was performed with LIF detection at each of six different locations starting at a separation distance of 2.2 cm and terminating at a distance 0.35 cm from the injection cross. Data files were exported from LabVIEW to IGOR Pro (version 6.22A, wavemetrics.com) for peak fitting analysis.
2.2.7 CE-ESI data collection and analysis
The CE-ESI device was mounted on a custom built stage with the ESI corner
approximately 5-10 mm from the sample cone inlet of a Synapt G2 quadrupole-ion mobility-time of flight mass spectrometer (Waters Corporation, Milford, MA). A 1/16th inch thick, 4 cm by 5 cm, single-sided copper clad circuit board (M.G. Chemicals, Burlington, Ontario, Canada) was used to shield the electrospray orifice from the high voltages applied to the microfluidic
20
the LabVIEW program used for electrokinetic control of the microfluidic device.
Electropherograms collected in MassLynx were exported to IGOR Pro for peak fitting analysis. Data from the CE-ESI-MS analysis of enolase tryptic digest was additionally processed by BiopharmaLynx (version 1.2, Waters Corporation) to match observed peak masses with the amino acid sequence of yeast enolase obtained from the UniProt database. The analysis parameters allowed for tryptic digestion with no missed cleavages and no modifications. 2.3 Results and discussion
2.3.1 Characterization of CVD deposited aminopropyl silane coatings by CE-LIF
The performance of the CVD deposited aminopropyl silane coatings was evaluated using CE-LIF. The purpose of this analysis was to measure the electroosmotic mobility and
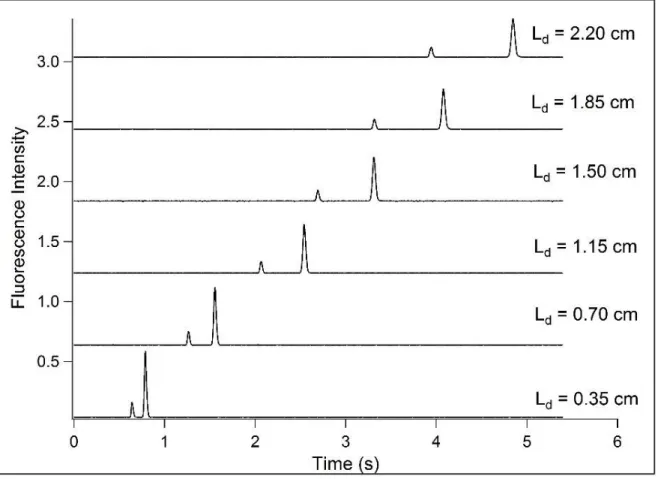
electrophoretic band broadening with high accuracy. This method removes sources of extra-column band broadening by observing analyte bands at multiple locations along the separation channel. Data exemplifying this type of analysis is shown in Figure 2.3. This figure shows the separation of fluorescein and rhodamine 6G (R6G) on an APS coated device, with LIF detection at six different detection points ranging from 0.35 cm to 2.2 cm from the injection cross. Using these data one can determine the apparent diffusion coefficient of the separation according to eq 2.3. The apparent diffusion coefficient can be used in conjunction with the molecular diffusion coefficient, , to determine the efficiency coefficient , according to eq 2.4.
In this work the stopped-flow method was used to determine . 58
21
by diffusion alone. After the stopped-flow period, the voltage was reapplied to complete the run. The results can be seen in Figure 2.2 where the spatial variance ( ) of the analyte bands is plotted as a function of time (t).
Figure 2.2 Data from stopped-flow LIF experiments performed in 50% acetonitrile, 0.1% formic acid using a mixture of fluorescein and rhodamine 6G. The slope of each plot indicates the rate of band broadening and is used to determine the molecular diffusion coefficient.
22
Once the molecular diffusion coefficient of an analyte is known it can be used to
determine values for all future CE analyses performed using that combination of analyte, BGE, and temperature. The stopped-flow time ranged from 0 to 200 s for CE-LIF analysis of
fluorescein and R6G. For CE-ESI of fluorescein and the peptide analytes the stopped-flow period was varied from 5 to 20 min. Results from all stopped-flow analyses can be found in Table 2.1. This stopped-flow method can be applied to any CE system, but special care should be taken to prevent pressure-driven transport during the stopped-flow period, particularly for capillary systems.
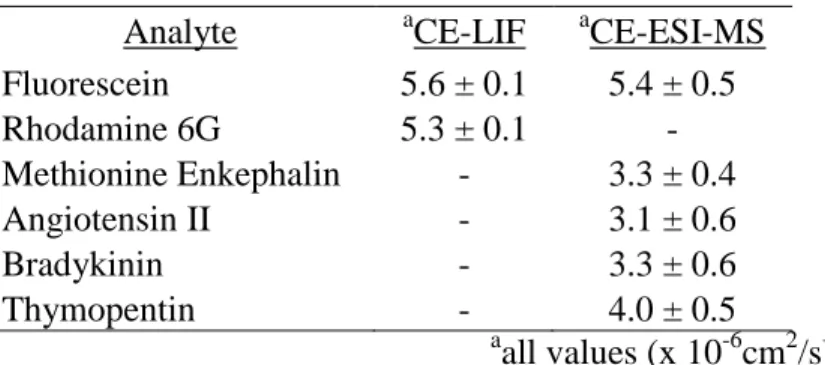
Table 2.1 Diffusion coefficients measured by stopped-flow in 50%acetonitirile, 0.1% formic acid
Analyte aCE-LIF aCE-ESI-MS Fluorescein 5.6 ± 0.1 5.4 ± 0.5 Rhodamine 6G 5.3 ± 0.1 - Methionine Enkephalin - 3.3 ± 0.4 Angiotensin II - 3.1 ± 0.6
Bradykinin - 3.3 ± 0.6
Thymopentin - 4.0 ± 0.5
a
all values (x 10-6cm2/s)
23
Figure 2.3 Representative data for CE-LIF performance analysis using a cross-channel
microfluidic device with a separation channel length of 3 cm. Electropherograms for a mixture of fluorescein and rhodamine 6G were acquired at the separation distances indicated.
24
Table 2.2 Performance of APDIPES coated microfluidic devices
pH 2.8 pH 7.5
EOF (cm2V-1s-1) -6.36E-04 (0.7%)1 -5.79E-04 (4%)
1.09 (3%) 1.49 (13%)
Plates/m 1.86E+06 (5%) 1.28E+06 (15%)
1
Percentages listed in parenthesis are relative standard deviations (n = 3). At pH 2.8 the separation approached the theoretically limiting efficiency (R6G = 1.09) with a
strong anodic EOF. At pH 7.5, we observed a 9% decrease in EOF along with a decrease in separation efficiency (R6G = 1.49). These changes could indicate the presence of silanol groups
not fully covered by the APS coating. Liquid phase APS coatings have been reported in the literature for which the EOF not only decreased at elevated pH levels but changed from anodic to cathodic at pH values greater than 5.5.45 This reversal of EOF at elevated pH is not seen in our CVD-coated devices up to pH 7.5. This result is in good agreement with previously reported comparisons of liquid and vapor phase silanization of surfaces in which vapor phase methods were found to produce surfaces with more uniform coverage46 and greater hydrolytic stability.47 2.3.2 Device-to-device reproducibility of the CVD coating method
The reproducibility of the APDIPES surface coating method, was evaluated in terms of EOF and band broadening performance for 20 different microfluidic devices coated over a 2-week period in batch sizes ranging from 1 to 3 devices. The devices with separation channels of 3 cm in length were evaluated using the CE-LIF method described above, but with a BGE fully optimized for ESI sensitivity (50% acetonitrile, 0.1% formic acid by volume). he anodic EOF in this BGE was significantly greater than that observed during the initial characterization using ammonium acetate buffered BGE due to the decreased ionic strength. The average
25
1.44 (7.5% RSD) for R6G. The slightly elevated efficiency coefficient of R6G may have been caused by partial separation of a minor variant peak. It should also be noted that the faster electroosmotic mobility obtained with this BGE yields higher theoretical plate counts at a given field strength, as indicated by eq 2.1. For this experiment the R6G efficiency coefficient of 1.44 corresponded to 61,600 theoretical plates (2.8 million plates per meter). Separation efficiency for both dyes on all devices studied was greater than 44,000 theoretical plates (2 million plates per meter).
2.3.3 Characterization of stability for CVD deposited aminopropyl silanes
The stability of the surface coatings for CE-MS applications is important for two reasons. In extreme cases of instability, chemical bleeding can lead to an elevated MS background signal or even fouling of the MS inlet. In all cases, coating instability will affect the quality of the separation in the form of excessive band broadening and migration time shifts, which have been reported previously for APS coatings administered in the liquid phase.48-49 A surface coating with high stability that successfully inhibits analyte adsorption can be used in consecutive runs without the need to rinse or recoat the separation channel. The instability of many surface coatings reported in the literature makes them unsuitable for continuous use without
26
more stable than APTES as the bulky side groups of APDIPES can hinder hydrolysis of the silane bond.38 Four total devices were characterized for this study; one device coated with each APS reagent in each of the two storage conditions. The devices were analyzed by the same CE-LIF method described previously to quantify the electroosmotic mobility and band broadening. The devices were analyzed the day of coating to establish initial performance and again on days 2, 6, and 7 of storage so that changes in performance could be tracked over time. Figure 2.4A shows the change in EOF observed over 1 week of storage for all four devices. The anodic EOF slowed slightly over the 1 week storage period for all cases, with the greatest change in EOF observed for APDIPES stored under vacuum (6.5% decrease in EOF). EOF measurements were reproducible with measurement error less than 1% RSD. Figure 2.4B shows the observed R6G efficiency coefficient versus storage time. All of the devices had an initial value of
27
Figure 2.4 Performance of microfluidic devices coated with APTES and APDIPES. APTES coatings are displayed as triangles, APDIPES as circles. Open symbols indicate vacuum storage at 4 °C whereas closed symbols indicate wet storage at room temperature. A) Electroosmotic mobility versus time. B) Efficiency coefficient versus time. Overlapping data for APTES runs are indicated with an asterisk.
2.3.4 CE-ESI-MS of peptide standards
28
analysis were to confirm that peptides did not interact with the APDIPES surface, yielding efficient separations, and that the coatings were compatible with ESI-MS. The CE-ESI devices had a longer separation channel (23 cm) than the CE-LIF devices (3 cm). These experiments therefore also served to confirm that the CVD method could produce a uniform coating inside longer microfluidic channels. Figure 2.5 shows a representative electropherogram for the CE-ESI-MS separation of four model peptides on an APDIPES coated CE-ESI device. Fluorescein was also added to this sample as an EOF marker.
29
The inset of Figure 2.5 shows a single peptide peak (angiotensin II) in greater detail. These separations produced symmetrical, temporally narrow peaks, with a median base peak width (4) of 384 ± 63 ms (n = 3). The run-to-run migration time reproducibility was stable with less than 0.3% RSD for all peptides. No background ions associated with the APDIPES coating were detected, confirming the stability of the coating and MS compatibility. As with all of the data presented here the channels were not flushed or equilibrated between runs permitting rapid, serial injections. The average separation efficiency for the peptides used in this set of experiments was 680,000 theoretical plates. This represents a substantial improvement in performance from our previous results using liquid phase coating methods which resulted in an average separation efficiency of 200,000 theoretical plates for CE-ESI-MS of peptide standards.5 The average value for CE-MS using the CVD coating method was 1.6 for the peptide standards, indicating some further improvement may be possible. The peptide peaks were sampled approximately five times per peak on average using the 8 Hz MS acquisition rate. This under-sampling could
underestimate peak height and inflate the measured peak widths slightly. These results indicate that the CVD silanization method is fully compatible with ESI-MS and is capable of coating long channel networks for exceptional separation performance.
2.3.5 CE-ESI-MS of enolase tryptic digest
30
show the mass spectra obtained for the indicated peptide peaks. The spectrum from the earlier peak is dominated by a doubly charged tryptic peptide with a molecular weight of 1,156.6 Da. The spectrum from the later peak is dominated by a charge state envelope from an unidentified sample component with a molecular weight of 15.7 kDa. We have observed this unidentified sample component in a number of different samples obtained from Waters Corporation, including the intact protein sample described below. While we have not identified this
component, its presence highlights the ability of CE-ESI-MS to efficiently separate a wide range of peptides and proteins concurrently. We believe this property makes CE-ESI-MS well-suited for peptide mapping experiments.
31
The data from the CE-ESI-MS analysis of enolase tryptic digest was further processed using BiopharmaLynx to simulate a peptide mapping experiment. By automated matching of observed masses to the amino acid sequence of yeast enolase, 85% sequence coverage was achieved with 42 identified peptides. Of the 52 possible tryptic fragments 30 were identified (allowing for no missed cleavages or modifications), including all 25 of the possible tryptic fragments larger than 700 Da. Expected tryptic fragments with molecular weights less than 450 Da were not detected. It is possible that more of these low mass fragments could have been identified if the instrument had been set to scan below 300 m/z. It is also possible that some of these smaller components might be lost during sample preparation by the supplier.52
2.3.6 CE-ESI-MS of intact proteins
In addition to peptide separations, the APDIPES-coated CE-ESI device was used to analyze a commercial intact protein standard mixture. A total ion electropherogram from one of these separations is shown in Figure 2.7. The mass spectra from the four most intense peaks are also shown. All six of the proteins present in this sample were identified in the four most intense peaks. The observed masses and assignments are listed in Table 2.3. Three less abundant
components observed (peaks 2, 3, and 4) did not correspond to any known sample components. Minor variants were observed for enolase and myoglobin. The observed mass spectrum for peak 7, assigned as phosphorylase b, could not be deconvoluted. This assignment was made based on the process of elimination and previous work. The efficiency values calculated for the peaks observed in this separation ranged from 100,000 to 400,000 theoretical plates (an average of 1.5 million plates per meter). Peak shapes for fully resolved components were Gaussian and
32
with less than 0.7% RSD (n = 3) for all proteins as determined from their extracted ion electropherograms.
Figure 2.7 TIC electropherogram of an intact protein standard mixture analyzed by CE-MS using a CVD APS coated microchip. Insets show mass spectra for the most intense protein bands including the co-elution of cytochrome c and the larger protein BSA in peak 9.
Table 2.3 Peaks observed by CE-ESI-MS of the intact protein mixture.*
Peak #
Migration Time (min)
FWHM (s)
MW observed
(kDa) Assignment
1 0.93 N/A N/A neutral contaminant
2 1.35 0.222 26.7 ?
3 1.36 0.299 61.2 ?
4 1.37 0.288 15.7 ?
5 1.39 0.327 46.8 enolase
6 1.40 0.356 46.7 enolase
7 1.43 0.581 ? phosphorylase b
8 1.49 0.429 17.0 and 13.7 myoglobin and ribonuclease A 9 1.52 0.721 12.4 and 66.4 cytochrome c and BSA
33
While we strongly advocate quantifying CE separation performance using the efficiency coefficient metric, the molecular complexity of intact proteins presents an added complication to such an approach. For such molecules, a CE band may include a population of species
possessing slight differences in electrophoretic mobility (due to heterogeneity in the folding structure, or the presence of minor chemical variants). So, the variance of a protein peak may be indicative of the molecules within the band and not the quality of the surface coating. Future work will be directed at evaluating intact protein separations more thoroughly. While the efficiency of the intact protein separations reported here compares favorably to other literature reports,15-17, 53-57 the resolution could be further improved by lowering the electroosmotic flow rate or by using longer separation channels and a higher separation voltage.
2.4 Conclusions
Chemical vapor deposition of aminopropyl silanes is an excellent method for coating microfluidic CE-ESI devices. The method is simple, fast, and well-suited to bulk processing of multiple devices. Stable surface coatings were produced with excellent device-to-device
reproducibility. The coated devices exhibited strong anodic EOF and exceptional electrophoretic separation efficiency for a range of neutral and cationic analytes. Coating stability was sufficient for storage over at least a 1-week period and coatings have exhibited stable performance in acidic BGE for days to weeks without reconditioning. The CE-LIF method used to evaluate the performance of the coating is capable of accurately measuring electroosmotic mobility and band broadening within the separation column. The efficiency coefficient () is introduced to clearly indicate the efficiency of a separation relative to the theoretical optimum. This approach
34
35 2.5 References
1. Ramautar, R., Heemskerk, A. A. M., Hensbergen, P. J., Deelder, A. M., Busnel, J.-M., Mayboroda, O. A., J. Proteomics 2012, 75.
2. Bonvin, G., Veuthey, J. L., Rudaz, S., Schappler, J., Electrophoresis 2012, 33. 552-562. 3. Figeys, D., vanOostveen, I., Ducret, A., Aebersold, R., Anal. Chem. 1996, 68. 1822-1828. 4. Janini, G. M., Conrads, T. P., Wilkens, K. L., Issaq, H. J., Veenstra, T. D., Anal. Chem.
2003, 75. 1615-1619.
5. Mellors, J. S., Gorbounov, V., Ramsey, R. S., Ramsey, J. M., Anal. Chem. 2008, 80. 6881-6887.
6. Moini, M., Anal. Chem. 2001, 73. 3497-3501.
7. Samskog, J., Wetterhall, M., Jacobsson, S., Markides, K., J. Mass Spectrom. 2000, 35. 919-924.
8. Pioch, M., Bunz, S.-C., Neusuess, C., Electrophoresis 2012, 33.
9. Huhn, C., Ramautar, R., Wuhrer, M., Somsen, G. W., Anal. Bioanal. Chem. 2010, 396. 297-314.
10. Elhamili, A., Wetterhall, M., Arvidsson, B., Sebastiano, R., Righetti, P. G., Bergquist, J., Electrophoresis 2008, 29. 1619-1625.
11. Faserl, K., Sarg, B., Kremser, L., Lindner, H., Anal. Chem. 2011, 83. 7297-7305. 12. Feldmann, A., Claussnitzer, U., Otto, M., J. Chromatogr., B 2004, 803. 149-157. 13. Ghosal, S., Anal. Chem. 2002, 74. 4198-4203.
14. Hardenborg, E., Zuberovic, A., Ullsten, S., Soderberg, L., Heldin, E., Markides, K. E., J. Chromatogr., A 2003, 1003. 217-221.
15. Haselberg, R., de Jong, G. J., Somsen, G. W., Electrophoresis 2011, 32. 66-82.
16. Haselberg, R., Brinks, V., Hawe, A., de Jong, G. J., Somsen, G. W., Anal. and Bioanal. Chem. 2011, 400. 295-303.
17. Haselberg, R., de Jong, G. J., Somsen, G. W., J. Sep. Sci. 2009, 32. 2408-2415.
36
19. Monton, M. R. N., Tomita, M., Soga, T., Ishihama, Y., Anal. Chem. 2007, 79. 7838-7844.
20. Ramautar, R., Mayboroda, O. A., Derks, R. J. E., van Nieuwkoop, C., van Dissel, J. T., Sornsen, G. W., Deelder, A. M., de Jong, G. J., Electrophoresis 2008, 29. 2714-2722. 21. Ullsten, S., Zuberovic, A., Wetterhall, M., Hardenborg, E., Markides, K. E., Bergquist, J.,
Electrophoresis 2004, 25. 2090-2099.
22. Jorgenson, J. W., Lukacs, K. D., Anal. Chem. 1981, 53. 1298-1302. 23. Jorgenson, J. W., Lukacs, K. D., J. Chromatogr. 1981, 218. 209-216. 24. Jorgenson, J. W., Lukacs, K. D., Clin. Chem. 1981, 27. 1551-1553.
25. Oda, R. P., Landers, J. P., in Hand Book of Capillary Electrophoresis, ed. J. P. Landers. CRC Press: Boca Raton, Second edn., 1997, pp 2-20.
26. Petersen, N. J., Nikolajsen, R. P. H., Mogensen, K. B., Kutter, J. P., Electrophoresis 2004, 25. 253-269.
27. Datta, S., Ghosal, S., Phys. Fluids 2008, 20.
28. Squires, T. M., Quake, S. R., Rev. Mod. Phys. 2005, 77. 977-1026. 29. Jorgenson, J. W., Lukacs, K. D., Science 1983, 222. 266-272.
30. Chambers, A. G., Mellors, J. S., Henley, W. H., Ramsey, J. M., Anal. Chem. 2011, 83. 842-849.
31. Mellors, J. S., Jorabchi, K., Smith, L. M., Ramsey, J. M., Anal. Chem. 2010, 82. 967-973. 32. Pattky, M., Huhn, C., Anal. Bioanal. Chem. 2013, 405. 225-237.
33. Chen, Z., Ghosal, S., Bull. Math. Biol. 2012, 74. 346-355.
34. Datta, S., Ghosal, S., Patankar, N. A., Electrophoresis 2006, 27. 611-619. 35. Ghosal, S., Electrophoresis 2004, 25. 214-228.
36. Ghosal, S., J. Fluid Mech. 2002, 459. 103-128.
37
38. Zhang, F., Sautter, K., Larsen, A. M., Findley, D. A., Davis, R. C., Samha, H., Linford, M. R., Langmuir 2010, 26. 14648-14654.
39. Pang, I., Kim, S., Lee, J., Surf. Coat. Technol. 2007, 201. 9426-9431. 40. Shirahata, N., Hozumi, A., J. Nanosci. Nanotechnol. 2006, 6. 1695-1700.
41. Popat, K. C., Robert, R. W., Desai, T. A., Surf. Coat. Technol. 2002, 154. 253-261. 42. Culbertson, C. T., Jacobson, S. C., Ramsey, J. M., Anal. Chem. 1998, 70. 3781-3789. 43. Jacobson, S. C., Hergenroder, R., Koutny, L. B., Warmack, R. J., Ramsey, J. M., Anal.
Chem. 1994, 66. 1107-1113.
44. Jacobson, S. C., Hergenroder, R., Koutny, L. B., Ramsey, J. M., Anal. Chem. 1994, 66. 1114-1118.
45. Thorsteinsdottir, M., Isaksson, R., Westerlund, D., Electrophoresis 1995, 16. 557-563. 46. Anderson, A. S., Dattelbaum, A. M., Montano, G. A., Price, D. N., Schmidt, J. G.,
Martinez, J. S., Grace, W. K., Grace, K. M., Swanson, B. I., Langmuir 2008, 24. 2240-2247.
47. Zhu, M. J., Lerum, M. Z., Chen, W., Langmuir 2012, 28. 416-423.
48. Waterval, J. C. M., Hommels, G., Bestebreurtje, P., Versluis, C., Heck, A. J. R., Bult, A., Lingeman, H., Underberg, W. J. M., Electrophoresis 2001, 22. 2709-2716.
49. Cao, P., Moini, M., J. Am. Soc. Mass Spectrom. 1998, 9. 1081-1088.
50. MacDonald, A. M., Bahnasy, M. F., Lucy, C. A., J. Chromatogr., A 2011, 1218. 178-184. 51. Mellors, J. S., Black, W. A., Chambers, A. G., Starkey, J. A., Lacher, N. A., Ramsey, J.
M., Analytical Chemistry 2013, 85. 4100-4106.
52. Whitmore, C. D., Gennaro, L. A., Electrophoresis 2012, 33. 1550-1556.
53. Haselberg, R., de Jong, G. J., Somsen, G. W., Anal. Chim. Acta 2010, 678. 128-134. 54. Haselberg, R., Ratnayake, C. K., de Jong, G. J., Somsen, G. W., J. Chromatogr., A 2010,
1217. 7605-7611.
55. Jurcic, K., Yeung, K. K. C., Electrophoresis 2009, 30. 1817-1827.
38
57. Sebastiano, R., Mendieta, M. E., Contiello, N., Citterio, A., Righetti, P. G., Electrophoresis 2009, 30. 2313-2320.
CHAPTER 3: AMINOPROPYL SILANE-POLYETHYLENE GLYCOL SURFACE COATINGS FOR MODULATING THE EOF OF HIGHLY EFFICIENT CE-ESI-MS
3.1 Introduction
CE has tremendous potential for the separation of biological molecules and is capable of producing highly efficient separations with short analysis times.1-8 To maximize the utility of CE for many biological applications it must be compatible with mass spectrometry (MS) due to the inherent complexity of biological samples and the information-rich nature of MS. For
bioanalytical applications surface coatings play a vital role in analyte-wall interaction inhibition as well as dictating the magnitude and direction of the electroosmotic flow (EOF).9-11 The
inhibition of analyte-wall interactions is paramount for realizing the potential time and efficiency benefits of CE and EOF control is necessary for resolving complex mixtures.8 Efficient CE requires that surface coatings be highly uniform because nonuniform coatings lead to excessive band broadening.8, 12 For electrospray ionization (ESI)-MS surface coatings must also be static. Methods that use dynamic coatings as opposed to static coatings or rely on buffer additives such as salts lead to elevated MS background signal and ionization suppression.9 For similar reasons it is preferable that static coatings be covalently attached to the surface.13-15 Many surface coating methods exist but few approach the theoretical separative performance maximum of CE.8 What is needed is a surface coating method that produces highly efficient separations without the use of buffer additives enabling stable and sensitive ESI-MS. Additionally, a range of EOF
40
In the literature, it is common to find CE surface coatings that either yield a strong EOF relative to the electrophoretic mobility (ep) of biological analytes or a near-zero EOF.9 Highly
efficient, ESI-MS compatible surface coatings that offer intermediate values of EOF are missing from the available coating technology. The benefit of having many EOF magnitudes available is apparent when considering the resolution equation for CE:
( ) [ ̅
] ⁄
(3.1) From eq 1 it is evident that resolution in CE is theoretically maximized when the EOF ( ) is equal in magnitude and opposite in direction to the average analyte electrophoretic mobility ( ̅ ) regardless of the voltage applied ( ) or the analyte diffusivity ( ). Though this condition results in maximum resolution, by considering eq 2, it is apparent that this condition also results in average migration times ( ̅) that approach infinity regardless of the separation channel length ( ) or electric field strength ( ).
̅ ̅ (3.2)
41
maintaining high separation efficiency. For biological analytes, MS compatibility of the coating and background electrolyte (BGE) is imperative.
Our lab has recently published work describing covalent, cationic surface coatings achieved by chemical vapor deposition (CVD) of aminopropyl silane (APS) reagents.8 The CVD method produced a uniform surface of primary amines inside microfluidic channels, resulting in an anodic EOF. The magnitude of this EOF was 4x-5x greater than - ̅ for the intended analytes resulting in separations that were heavily dominated by . These coatings were used in
conjunction with CE-ESI microchips coupled to MS to separate mixtures of peptides and proteins. The separation efficiency was found to be exceptional, resulting in near diffusion-limited performance.8 However, it would be desirable to have coatings that maintain this high level of efficiency while offering a range of EOF magnitudes for improved resolution according to eq 1. The APS coatings are an excellent base layer for subsequent covalent modification due to the uniform layer of reactive primary amines. Polyethylene glycol (PEG)-based surface coatings are attractive for CE due to their hydrophilic nature, which has been shown to reduce adsorption of biological species.23-24 A series of NHS-PEG reagents with varying chain lengths are commercially available for improving protein solubility and are designed to target the primary amines located on protein surfaces. Therefore NHS-PEG is a well-suited reagent for the modification of our APS CVD coatings and offers a series of reagents for the generation of a range of EOF.25 Wang and coworkers published a PEG-based coating method that used a (3-aminopropyl)triethoxysilane (APTES) base layer, administered in the liquid phase and an n-hydroxy succinimide ester of PEG (NHS-PEG) to modify this layer for CE.25 Results from the Wang report showed that PEGylation reduced analyte adsorption though the separative
42
surface coatings for CE have been published.15, 26 Methods for PEG-based coatings have been developed which lead to good separation efficiencies27 or are MS-compatible14 but not both.
In this work we describe a coating method for CE-ESI-MS of biological analytes that produces efficient separations while offering multiple EOF magnitudes. Devices coated with (3-aminopropyl)di-isopropylethoxysilane (APDIPES) via CVD were subsequently treated with NHS-PEG of varying chain lengths to produce a broad range of EOF magnitudes. To determine the relationship between EOF and PEG chain length, CE separations were performed using laser induced fluorescence (LIF) experiments. Additionally, microfluidic chips with integrated ESI emitters28 were coated and used to perform CE-ESI-MS of peptide and protein mixtures. A peptide mixture was separated using an APDIPES-PEG surface coating with intermediate EOF. A mixture of intact proteins was separated using an APDIPES-PEG surface coating with a near-zero EOF.
3.2 Experimental
3.2.1 Reagents and materials.