Isotemporal Analysis of the Association of Objectively Measured
Physical Activity With Depressive Symptoms: Results From
Hispanic Community Health Study/Study of Latinos (HCHS/SOL)
Chad D. Rethorst,
Center for Depression Research and Clinical Care, Dept of Psychiatry, University of Texas Southwestern Medical Center, Dallas, TX
Ashley E. Moncrieft,
Dept of Psychology, University of Miami, Coral Gables, FL
Marc D. Gellman,
Dept of Psychology, University of Miami, Coral Gables, FL
Elva M. Arredondo,
Institute of Behavioral and Community Health, Graduate School of Public Health, San Diego State University, San Diego CA
Christina Buelna,
Institute of Behavioral and Community Health, Graduate School of Public Health, San Diego State University, San Diego CA
Shelia F. Castañeda,
Institute of Behavioral and Community Health, Graduate School of Public Health, San Diego State University, San Diego CA
Martha L. Daviglus,
Institute of Minority Health Research, University of Illinois at Chicago, Chicago, IL
Unab I. Khan,
Dept of Pediatrics and Family & Social Medicine, Albert Einstein College of Medicine, Bronx, NY
Krista M. Perreira,
Collaborative Studies Coordinating Center, Dept of Biostatistics Gillings School of Global Public Health, University of North Carolina at Chapel Hill, NC
Daniela Sotres-Alvarez, and
Collaborative Studies Coordinating Center, Dept of Biostatistics Gillings School of Global Public Health, University of North Carolina at Chapel Hill, NC
Mark Stoutenberg
Dept of Public Health Sciences, Miller School of Medicine, University of Miami, Miami, FL
Abstract
HHS Public Access
Author manuscript
J Phys Act Health
. Author manuscript; available in PMC 2018 February 01.Published in final edited form as:
J Phys Act Health. 2017 September ; 14(9): 733–739. doi:10.1123/jpah.2016-0648.
A
uthor Man
uscr
ipt
A
uthor Man
uscr
ipt
A
uthor Man
uscr
ipt
A
uthor Man
uscr
Background—The burden of depression among Hispanics/Latinos indicates the need to identify factors related to depressive symptoms. This paper examines the relationship of physical activity (PA) and sedentary behavior (SB) with depressive symptoms in Hispanic/Latinos.
Methods—The Hispanic Community Health Study / Study of Latinos (HCHS/SOL) is a population-based, cohort study of Hispanic/Latinos in 4 United States metropolitan areas. Objectively measured PA was coded into: sedentary behavior (SB), light-intensity (LPA), moderate-intensity (MPA), and vigorous-intensity (VPA); and the Center for Epidemiological Studies Depression Scale-10 assessed depressive symptoms. Multiple regression analysis utilizing isotemporal substitution, adjusted for relevant covariates, examined PA as predictors of depressive symptoms.
Results—Substitution of 1 hour of SB with VPA resulted in a significant decrease in depressive symptoms (β = −1.215, P = .021). Similar decreases were observed when VPA replaced LPA (β = −1.212, P = .021) and MPA (β = −1.50 P = .034). MPA and LPA were not associated with lower depressive symptoms.
Conclusions—Previous research has focused on the relationship of MVPA on depressive symptoms. Our results suggest these constructs should be examined separately as they may have unique relationships with depressive symptoms. The association of SB with greater depressive symptoms confirms previous reports.
Keywords
exercise; depression
Depressive disorders affect approximately 10% of the population in the United States annually, with a lifetime prevalence of 10% in men and 15% in women.1 The prevalence of depressive disorders may be even greater among the United States Hispanic/ Latino population, and appears to vary across Hispanic/Latino backgrounds.1–7 Major Depressive Disorder (MDD) is related to poor physical health outcomes8 including increased rates of type II diabetes and cardiovascular disease, which are both major health concerns among Hispanic/Latinos.9,10 Even among individuals who do not meet diagnostic criteria for a depressive disorder, subsyndromal depressive symptoms have negative influences on health as they are associated with functional impairment,11,12 higher rates of disability,13 increased social dysfunction,12,14 and an increased risk of future depressive disorders.15
Inadequate access to health care further exacerbates the negative health consequences of depressive disorders in Hispanic/Latinos. Among Hispanics/Latinos, MDD is under-diagnosed, less likely to be treated, and more likely to have treatment discontinued.16–19 These factors highlight the need to more clearly identify factors associated with the depressive disorders in the Hispanic/Latino population. In addition, lifestyle factors are known to be associated with the prevalence and incidence of depressive disorders. For example, previous epidemiological studies report a beneficial association of physical activity with depressive disorders.20–23
Despite this evidence, gaps in the knowledge base remain. Many of these previous studies relied on self-reported PA, which may bias the reported associations.24 Another unanswered
A
uthor Man
uscr
ipt
A
uthor Man
uscr
ipt
A
uthor Man
uscr
ipt
A
uthor Man
uscr
question is how specific physical activity intensities are related to depressive symptoms. Recent research has described the detrimental effects of sedentary behavior (SB) on a variety of disease outcomes;25 however, only 1 prior population-based study has examined the concurrent associations of PA and SB with depressive symptoms.26 Previous research has also failed to account for the interrelationships between PA intensities, namely the fact that an increase in time spent in one intensity of PA requires a simultaneous reduction in another. Finally, no population-based studies have been conducted in a Hispanic/Latino sample.
The Hispanic Community Health Study / Study of Latinos (HCHS/SOL), a prospective, population-based, cohort study of 16,415 Hispanic/Latinos in the United States, provides a unique opportunity to further examine the relationship between PA and depressive
symptoms. This paper examines the relationship of objectively measured PA with depressive symptoms in a diverse Hispanic/Latino sample. We used isotemporal substitution
models27,28 to concurrently evaluate all intensities of activity (sedentary behavior [SB], light [LPA], moderate [MPA], and vigorous [VPA]). We hypothesized that substitution of SB with LPA, MPA, and VPA would be associated with lower depressive symptoms. Furthermore, we examined age and body mass index (BMI) as potential moderators of this relationship given that these factors have been associated with higher depressive symptoms29,30 and the relationship of PA/SB with depressive symptoms may differ as a function of these factors.
Methods
HCHS/SOL Overview
HCHS/SOL participants were Hispanic/Latino men and women, age 18 to 74 years at time of recruitment. Participants were enrolled between 2008 and 2011 from 4 metropolitan areas in the United States (Miami, FL; Bronx, NY; Chicago, IL; San Diego, CA). Recruitment was implemented through a 2-stage area probability design utilizing probability sampling within the selected census tracts. Participants provided written informed consent using IRB approved documents, completed interviewer administered questionnaires, and underwent a clinical examination at their respective field centers, which lasted approximately 6.5 hours. A comprehensive description of the study design, cohort selection, and assessment schedule can be found elsewhere.31,32
Outcome Measures
Depressive Symptoms—Depressive symptoms were assessed using the Center for Epidemiological Studies Depression Scale 10 [CES-D-10].33 Scores on this 10-item scale range from 0 to 30 with higher scores indicating greater severity of depressive symptoms. The CES-D-10 has shown excellent criterion validity and reliability in diverse samples34,35 including the HCHS/SOL sample.36
Physical Activity—Objectively measured PA was assessed using the Actical B-1 version accelerometer (model 198-0200-03; Respironics Co. Inc., Bend, Oregon). Prior studies have shown the Actical to have acceptable technical reliability.37,38 Participants were instructed to undertake usual activities for 7 days while wearing the monitor, and to remove it only for swimming, showering, and sleeping. Nonwear time, determined using the Choi algorithm,39
A
uthor Man
uscr
ipt
A
uthor Man
uscr
ipt
A
uthor Man
uscr
ipt
A
uthor Man
uscr
was defined as at least 90 consecutive minutes of zero counts, with allowance of 1 or 2 minutes of nonzero counts if no counts were detected in a 30 minute window upstream and downstream of the 90 minute period. Minute-by-minute activity counts were coded into 4 categories: SB (<100 cts/min), LPA (100–1534 cts/min), MPA (1535–3961 cts/min), and VPA (≥3962 cts/min), based on previously used accelerometer cut-points.40,41
Accelerometer data were only included for participants who provide 3 adherent days of data (defined as at least 10 hours of wear time) and accelerometer data were excluded from the analysis for participants who averaged greater than 20 hours of wear time per day. Weekend days were not included as a requirement as the majority of the sample (88%) provided at least 1 weekend day and there was no difference in PA level between weekend and weekdays.42 Of the 16,415 HCHS/SOL participants, 91.6% (N = 15,153) returned the accelerometer, and 67.7% (N = 11,116) provided analyzable data, defined as at least 3 adherent days with 10 or more hours of wear time and less than 20 hours of average daily wear time.
Additional Covariates
Demographic covariates included: age, sex, Hispanic background group (Cuban, Mexican, Puerto Rican, Dominican, Central American, and South American), BMI, household income level, and education level. Additional covariates included recruitment site, physical health assessed by the SF-12,43 general familial social support (defined as regular contact with immediate family and the number of extended family members with whom they feel close) assessed by a modified version of the Social Network Index,44 and acculturation assessed by the social and language subscales of the Short Acculturation Scale for Hispanic/Latinos.45 These covariates were selected as they have been associated with depressive symptoms.
Statistical Analysis
Multiple regression analyses were conducted with depressive symptoms as the outcome and time spent engaging at each PA intensity as predictors to examine the associations between PA and depressive symptoms. For all models, PA and SB variables were divided by 60. Results are therefore interpreted as unit change in CES-D-10 score per 60-minute change in activity. To aid interpretation, continuous covariates were mean-centered; SB and LPA were centered at 8-hours per day and wear-time was centered at 16-hours per day. All statistical models were adjusted for age, sex, Hispanic/Latino background group, recruitment site, BMI, income, education, acculturation, social support, and physical health. All analyses accounted for stratification, clustering, and sampling weights using complex survey
procedures in SAS v9.3 or Mplus version 7.1 (Muthen & Muthen, 1998–2003). Missing data were handled using full information maximum likelihood, allowing the entire study sample to be included in the analysis, regardless of missing data.46
Associations between each PA intensity and depressive symptoms were examined in 3 linear regression models. Model 1, the single-factor model, examined the association between each individual PA intensity (sedentary, light, moderate or vigorous) and depressive symptoms, controlling for total wear-time and covariates. Model 2, the partition model, examined the effect of time spent engaging in each intensity while holding time spent in other intensities constant and controlling for covariates, but did not adjust for total wear-time. Regression
A
uthor Man
uscr
ipt
A
uthor Man
uscr
ipt
A
uthor Man
uscr
ipt
A
uthor Man
uscr
coefficients (betas) for each intensity correspond to the effect of a 60-minute increase in that intensity (and total wear-time) while holding time at other intensities constant.
Model 3, the isotemporal model, examined the effect of substituting time spent at one intensity for time spent at other intensities while holding total wear-time constant. Because total time is held constant, increased time at one intensity simultaneously implies a decrease of an equivalent amount of time at a different intensity. In isotemporal models, the intensity being displaced or decreased is omitted, and is represented by the total wear-time variable. The coefficient for each included intensity corresponds to the effect of substituting 60-minutes of that intensity for 60-60-minutes of the omitted intensity while holding total time constant. Isotemporal models allow for the examination of heterogenous associations of PA intensities with depressive symptoms that vary according to the intensity being displaced.
Moderation analyses were also conducted to determine if associations varied as a function of BMI or age (both examined as continuous variables), in the single variable and partition models. Significance of the association of each domain of PA with depressive symptoms was evaluated with a criterion of P < .05. To control for the potential effects of multiple testing, interaction terms were evaluated with a criterion of P < .01.
Results
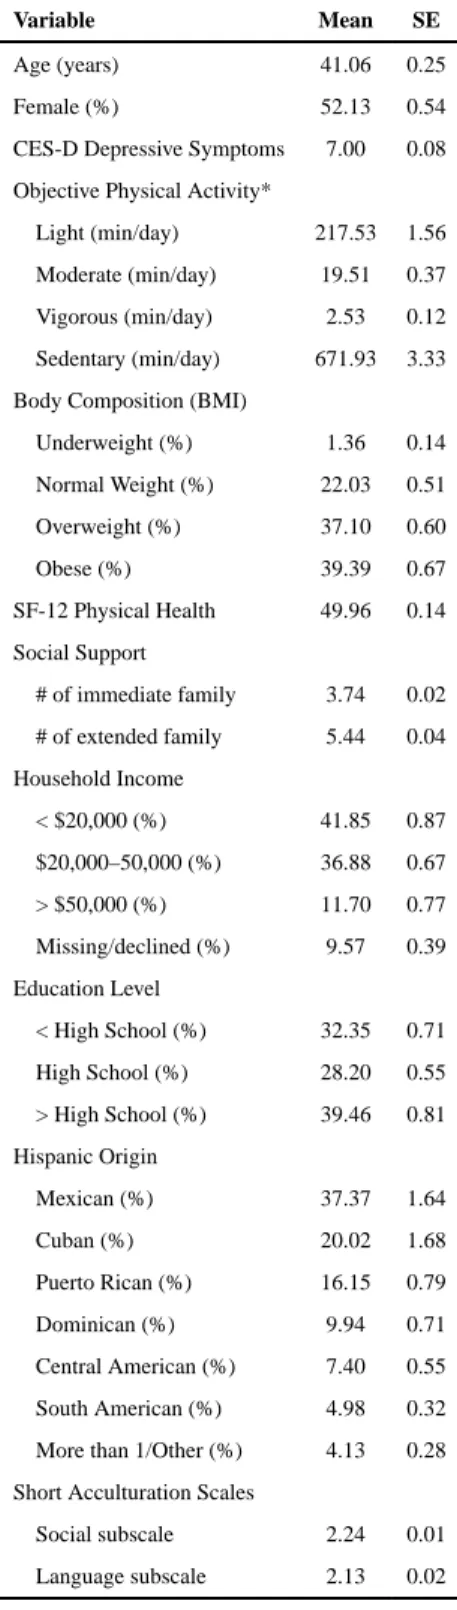
Descriptive characteristics, weighted to represent the 2010 Hispanic/ Latino target population, are presented in Table 1.
Table 2 presents the results from the single variable and partition models. In the single variable model, only vigorous PA was associated with depressive symptoms (β = −0.936, P = .041). In the partition model, vigorous PA (β = −1.095, P = .038) and sedentary time (β = 0.12, P = .003) were associated with depressive symptoms. Moderating effects of BMI and age were evaluated in the single variable and partition models. None of these analyses were significant at the predetermined P < .01 level.
In the isotemporal models (Table 3), replacing SB with VPA resulted in a significant decrease in depressive symptoms (β = −1.215, P = .021). Similar effects were observed when VPA replaces LPA (β = −1.212, P = .021) and MPA (β = −1.50 P = .034).
Discussion
This paper represents the first use of isotemporal substitution models to examine the relationship of PA with depressive symptoms. Our results indicate a consistent relationship between VPA and lower depressive symptoms among Hispanic/Latino adults supporting our initial hypothesis. Also consistent with our initial hypothesis, SB was associated with greater depressive symptoms in the partition model. However, results of the isotemporal analysis indicate that SB is only associated with increased depressive symptoms when it replaces VPA. In contrast to our initial hypothesis, LPA and MPA were not associated with lower depressive symptoms. In fact, in the isotemporal models replacement of LPA or MPA with VPA was associated with lower depressive symptoms, while replacement of SB with LPA or MPA did not result in significantly different depressive symptoms.
A
uthor Man
uscr
ipt
A
uthor Man
uscr
ipt
A
uthor Man
uscr
ipt
A
uthor Man
uscr
In the only previous population-based examination of objectively measured PA and depressive symptoms, Vallance et al26 report a significant inverse relationship of MVPA with depressive symptoms in an examination of the 2005–2006 National Health and Nutrition Examination Survey (NHANES). Our approach differed by separating MPA and VPA and our results support this distinction, as VPA was significantly associated with lower depressive symptoms while no association was observed with MPA. While the difference in analytic approach is likely the primary reason for the differing results, alternative
explanations are plausible. Classification of activity intensity using objective measurement includes some margin of error. Variations in activity classification have been identified when comparing normal-weight and overweight individuals.47,48 This may be particularly relevant to our analysis, as over 75% of our sample was either overweight or obese. Similarly, Hooker et al48 identified an optimal cut-point of 1065 (vs. the 1535 used in our analysis) to distinguish between LPA and MPA in middle-aged and older adults. Another consideration in examining the relationship between PA and depressive symptoms is the context in which PA occurs. Previous research suggests that PA context (ie, leisure vs. occupational) may influence the psychological effects of the activity.49 Bustamante et al50 report higher levels of household PA was associated with higher depressive symptoms among Hispanic older adults. Therefore, the objectively measured MPA in our analysis may reflect different activities, such as occupational activity, that negatively impact depressive symptoms. Finally, our study also examined the relationship between PA and depressive symptoms in a solely Hispanic/Latino sample, whereas Vallance et al used a representative sample of the entire U.S. population.
The relationship of SB with greater depressive symptoms has been observed with self-reported SB in a sample of Latinos51 and with objectively measured SB in a nationally-representative sample.26 Our reported positive association of objectively measured SB with depressive symptoms in the partition model is in agreement with similar models reported by Vallance et al.26 However, our isotemporal analyses revealed that SB was only related to depressive symptoms when it was replacing VPA. Furthermore, Vallance et al observed that this relationship was moderated by BMI such that the positive relationship between SB and depression was present only in those who were overweight/obese. The interaction between SB and BMI was not significant in our analyses indicating the relationship between SB and depressive symptoms is consistent across BMI groups in our sample.
Conclusions drawn from these findings must take into consideration the study’s limitations and strengths. The cross-sectional nature of the data does not allow for determination of causality. We cannot conclude whether engaging in VPA results in a decrease in depressive symptoms or, conversely, if the presence of depressive symptoms results in less engagement in VPA. The observed relationship between PA and depressive symptoms may also be influenced by other unassessed factors. For example, DeMoor et al52 suggest associations between PA and depressive symptoms may be due to common genetic factors. The CES-D-10 is frequently used to assess the presence and severity of depressive symptoms in population-based studies; however, it is not a diagnostic tool and therefore unable to identify true cases of depressive disorders. While high scores on the CES-D-10 are often related to a depressive disorder, they can also be related to medical illnesses that contribute to the somatic symptoms often observed in depressive disorders. We address this concern by
A
uthor Man
uscr
ipt
A
uthor Man
uscr
ipt
A
uthor Man
uscr
ipt
A
uthor Man
uscr
including physical health as a covariate in our analyses. Finally, the use of psychoactive medications was not included as a covariate in the current analysis. These limitations are balanced by several strengths in the study design. The analysis utilizes a large sample, representative of the Hispanic/Latino population in the 4 major U.S metropolitan areas. Furthermore, the use of accelerometers allowed for examination of the association of objectively measure PA with depressive symptoms. Finally, our analysis is the first to use the isotemporal approach to assess how the relationship of each intensity of PA with depressive symptoms is influenced by other PA intensities.
It is important to distinguish our results and previous cross-sectional analyses from those of randomized controlled trials (RCTs) examining the antidepressant effect of an exercise intervention. RCTs consistently demonstrate reductions in depressive symptoms in individuals with significant baseline levels of depressive symptoms following an intervention of moderate or vigorous aerobic exercise.53 Additionally, evidence suggests benefits to physical activity prior and during other depression treatment.54 One interpretation of our results is that the PA-depression relationship might differ in Hispanic/Latinos
compared with other ethnic groups. Prior research has noted ethnic differences in
physiological response to exercise;55,56 however, none of the RCTs conducted to date have examined exercise as a treatment of depression in a Hispanic/Latino sample. Therefore, the potential moderating effect of ethnicity needs to be explored in future RCTs of exercise for the treatment of depression.
In summary, our findings highlight a significant relationship of VPA with depressive symptoms, which is consistent with previous work across race/ethnic groups and study methodologies. Our findings differ from previous research, as we found no significant association of objectively measured MPA with depressive symptoms. While previous research has focused on the relationship of MVPA on depressive symptoms, our results suggest that these constructs should be examined separately as they may have unique impacts on depressive symptoms. Further research is also needed to determine whether our findings are the result of differing methodologies or if these findings represent a unique difference related to Hispanic/Latino ethnicity.
Acknowledgments
The authors thank the staff and participants of HCHS/SOL for their important contributions. (http://
www.cscc.unc.edu/hchs/). Results of the study are presented clearly, honestly, and without fabrication falsification,
or inappropriate data manipulation. Results do not constitute endorsement by ACSM. The Hispanic Community Health Study/Study of Latinos was carried out as a collaborative study supported by contracts from the National Heart, Lung, and Blood Institute (NHLBI) to the University of North Carolina (N01-HC65233), University of Miami HC65234), Albert Einstein College of Medicine HC65235), Northwestern University (N01-HC65236), and San Diego State University (N01- HC65237). The following Institutes/ Centers/Offices contribute to the HCHS/SOL through a transfer of funds to the NHLBI: National Center on Minority Health and Health Disparities, the National Institute of Deafness and Other Communications Disorders, the National Institute of Dental and Craniofacial Research, the National Institute of Diabetes and Digestive and Kidney Diseases, the National Institute of Neurological Disorders and Stroke, and the Office of Dietary Supplements. Chad D. Rethorst is supported by NIMH K01MH097847.
A
uthor Man
uscr
ipt
A
uthor Man
uscr
ipt
A
uthor Man
uscr
ipt
A
uthor Man
uscr
References
1. Blazer DG, Kessler RC, McGonagle KA, Swartz MS. The prevalence and distribution of major depression in a national community sample: the National Comorbidity Survey. Am J Psychiatry. 1994; 151(7):979–986. DOI: 10.1176/ajp.151.7.979 [PubMed: 8010383]
2. Mikolajczyk RT, Bredehorst M, Khelaifat N, Maier C, Maxwell AE. Correlates of depressive symptoms among Latino and Non-Latino White adolescents: findings from the 2003 California Health Interview Survey. BMC Public Health. 2007; 7:21.doi: 10.1186/1471-2458-7-21 [PubMed: 17313675]
3. Bromberger JT, Harlow S, Avis N, Kravitz HM, Cordal A. Racial/ ethnic differences in the prevalence of depressive symptoms among middle-aged women: The Study of Women’s Health Across the Nation (SWAN). Am J Public Health. 2004; 94(8):1378–1385. DOI: 10.2105/AJPH. 94.8.1378 [PubMed: 15284047]
4. Gonzalez HM, Tarraf W, Whitfield KE, Vega WA. The epidemiology of major depression and ethnicity in the United States. J Psychiatr Res. 2010; 44(15):1043–1051. DOI: 10.1016/j.jpsychires. 2010.03.017 [PubMed: 20537350]
5. Alegria M, Canino G, Shrout PE, et al. Prevalence of mental illness in immigrant and non-immigrant U.S. Latino groups. Am J Psychiatry. 2008; 165(3):359–369. DOI: 10.1176/appi.ajp. 2007.07040704 [PubMed: 18245178]
6. Alegria M, Mulvaney-Day N, Torres M, Polo A, Cao Z, Canino G. Prevalence of psychiatric disorders across Latino subgroups in the United States. Am J Public Health. 2007; 97(1):68–75. DOI: 10.2105/AJPH.2006.087205 [PubMed: 17138910]
7. Menselson T, Rehkopf DH, Kubzansky LD. Depression among Latinos in the United States: a meta-analytic review. J Consult Clin Psychol. 2008; 76(3):355–366. DOI: 10.1037/0022-006X.76.3.355 [PubMed: 18540730]
8. Falcon LM, Tucker KL. Prevalence and correlates of depressive symptoms among Hispanic elders in Massachusetts. J Gerontol B Psychol Sci Soc Sci. 2000; 55(2):S108–S116. DOI: 10.1093/geronb/ 55.2.S108 [PubMed: 10794195]
9. Harris MI, Flegal KM, Cowie CC, et al. Prevalence of diabetes, impaired fasting glucose, and impaired glucose tolerance in US adults - The Third National Health and Nutrition Examination Survey, 1988–1994. Diabetes Care. 1998; 21(4):518–524. DOI: 10.2337/diacare.21.4.518 [PubMed: 9571335]
10. Daviglus ML, Talavera GA, Aviles-Santa ML, et al. Prevalence of major cardiovascular risk factors and cardiovascular diseases among Hispanic/Latino individuals of diverse backgrounds in the United States. JAMA. 2012; 308(17):1775–1784. DOI: 10.1001/jama.2012.14517 [PubMed: 23117778]
11. Lyness JM, Kim J, Tang W, et al. The clinical significance of subsyndromal depression in older primary care patients. Am J Geriatr Psychiatry. 2007; 15(3):214–223. DOI: 10.1097/01.JGP. 0000235763.50230.83 [PubMed: 17213374]
12. Judd LL, Paulus MP, Wells KB, Rapaport MH. Socioeconomic burden of subsyndromal depressive symptoms and major depression in a sample of the general population. Am J Psychiatry. 1996; 153(11):1411–1417. DOI: 10.1176/ajp.153.11.1411 [PubMed: 8890673]
13. Broadhead WE, Blazer DG, George LK, Tse CK. Depression, disability days, and days lost from work in a prospective epidemiologic survey. JAMA. 1990; 264(19):2524–2528. DOI: 10.1001/ jama.1990.03450190056028 [PubMed: 2146410]
14. Judd LL, Rapaport MH, Paulus MP, Brown JL. Subsyndromal symptomatic depression: a new mood disorder? J Clin Psychiatry. 1994; 55(Suppl):18–28.
15. Horwath E, Johnson J, Klerman GL, Weissman MM. Depressive symptoms as relative and attributable risk factors for first-onset major depression. Arch Gen Psychiatry. 1992; 49:817–823. DOI: 10.1001/archpsyc.1992.01820100061011 [PubMed: 1417435]
16. Simpson SM, Krishnan LL, Kunik ME, Ruiz P. Racial disparities in diagnosis and treatment of depression: a literature review. Psychiatr Q. 2007; 78(1):3–14. DOI: 10.1007/s11126-006-9022-y [PubMed: 17102936]
A
uthor Man
uscr
ipt
A
uthor Man
uscr
ipt
A
uthor Man
uscr
ipt
A
uthor Man
uscr
17. Olfson M, Marcus SC, Druss B, Elinson L, Tanielian T, Pincus HA. National trends in the outpatient treatment of depression. JAMA. 2002; 287(2):203–209. DOI: 10.1001/jama.287.2.203 [PubMed: 11779262]
18. Olfson M, Marcus SC, Tedeschi M, Wan GJ. Continuity of antidepressant treatment for adults with depression in the United States. Am J Psychiatry. 2006; 163(1):101–108. DOI: 10.1176/appi.ajp. 163.1.101 [PubMed: 16390896]
19. Pinto-Meza A, Fernandez A, Serrano-Blanco A, Haro JM. Adequacy of antidepressant treatment in Spanish primary care: a naturalistic six-month follow-up study. Psychiatr Serv. 2008; 59(1):78–83. DOI: 10.1176/ps.2008.59.1.78 [PubMed: 18182543]
20. Farmer ME, Locke BZ, Moscicki EK, Dannenberg AL, Larson DB, Radloff LS. Physical activity and depressive symptoms: the NHANES I Epidemiologic Follow-up Study. Am J Epidemiol. 1988; 128(6):1340–1351. DOI: 10.1093/oxfordjournals.aje.a115087 [PubMed: 3264110] 21. Camacho TC, Roberts RE, Lazarus NB, Kaplan GA, Cohen RD. Physical activity and depression:
evidence from the Alameda County Study. Am J Epidemiol. 1991; 134(2):220–231. DOI: 10.1093/ oxfordjournals.aje.a116074 [PubMed: 1862805]
22. Paffenbarger R Jr, Lee IM, Leung R. Physical activity and personal characteristics associated with depression and suicide in American college men. Acta Psychiatr Scand. 1994; 89:16–22. DOI: 10.1111/j.1600-0447.1994.tb05796.x
23. Galper DI, Trivedi MH, Barlow CE, Dunn AL, Kampert JB. Inverse association between physical inactivity and mental health in men and women. Med Sci Sports Exerc. 2006; 38(1):173–178. DOI: 10.1249/01.mss.0000180883.32116.28 [PubMed: 16394971]
24. Prince SA, Adamo KB, Hamel ME, Hardt J, Connor Gorber S, Tremblay M. A comparison of direct versus self-report measures for assessing physical activity in adults: a systematic review. Int J Behav Nutr Phys Act. 2008; 5:56.doi: 10.1186/1479-5868-5-56 [PubMed: 18990237]
25. Owen N, Healy GN, Matthews CE, Dunstan DW. Too much sitting: the population health science of sedentary behavior. Exerc Sport Sci Rev. 2010; 38(3):105–113. DOI: 10.1097/JES.
0b013e3181e373a2 [PubMed: 20577058]
26. Vallance JK, Winkler EA, Gardiner PA, Healy GN, Lynch BM, Owen N. Associations of
objectively-assessed physical activity and sedentary time with depression: NHANES (2005–2006). Prev Med. 2011; 53(4–5):284–288. DOI: 10.1016/j.ypmed.2011.07.013 [PubMed: 21820466] 27. Mekary RA, Willett WC, Hu FB, Ding EL. Isotemporal substitution paradigm for physical activity
epidemiology and weight change. Am J Epidemiol. 2009; 170(4):519–527. DOI: 10.1093/aje/ kwp163 [PubMed: 19584129]
28. Stamatakis E, Rogers K, Ding D, et al. All-cause mortality effects of replacing sedentary time with physical activity and sleeping using an isotemporal substitution model: a prospective study of 201,129 mid-aged and older adults. Int J Behav Nutr Phys Act. 2015; 12:121.doi: 10.1186/ s12966-015-0280-7 [PubMed: 26419654]
29. Faith MS, Matz PE, Jorge MA. Obesity-depression associations in the population. J Psychosom Res. 2002; 53(4):935–942. DOI: 10.1016/S0022-3999(02)00308-2 [PubMed: 12377306] 30. Kessler RC, Foster C, Webster PS, House JS. The relationship between age and depressive
symptoms in two national surveys. Psychol Aging. 1992; 7(1):119.doi: 10.1037/0882-7974.7.1.119 [PubMed: 1558696]
31. Lavange LM, Kalsbeek WD, Sorlie PD, et al. Sample design and cohort selection in the Hispanic Community Health Study/Study of Latinos. Ann Epidemiol. 2010; 20(8):642–649. DOI: 10.1016/ j.annepidem.2010.05.006 [PubMed: 20609344]
32. Sorlie PD, Aviles-Santa LM, Wassertheil-Smoller S, et al. Design and implementation of the Hispanic Community Health Study/Study of Latinos. Ann Epidemiol. 2010; 20(8):629–641. DOI: 10.1016/j.annepidem.2010.03.015 [PubMed: 20609343]
33. Radloff LS. The CES-D scale a self-report depression scale for research in the general population. Appl Psychol Meas. 1977; 1(3):385–401. DOI: 10.1177/014662167700100306
34. Irwin M, Artin KH, Oxman MN. Screening for depression in the older adult: criterion validity of the 10-item Center for Epidemiological Studies Depression Scale (CES-D). Arch Intern Med. 1999; 159(15):1701–1704. DOI: 10.1001/archinte.159.15.1701 [PubMed: 10448771]
A
uthor Man
uscr
ipt
A
uthor Man
uscr
ipt
A
uthor Man
uscr
ipt
A
uthor Man
uscr
35. Kohout FJ, Berkman LF, Evans DA, Cornoni-Huntley J. Two shorter forms of the CES-D (Center for Epidemiological Studies Depression) depression symptoms index. J Aging Health. 1993; 5(2): 179–193. DOI: 10.1177/089826439300500202 [PubMed: 10125443]
36. Gonzalez P, Nunez A, Merz E, et al. Measurement Properties of the Center for Epidemiologic Studies Depression Scale (CES-D 10): Findings From HCHS/SOL. Psychol Assess. 2017; 29(4): 372–381. [PubMed: 27295022]
37. Esliger DW, Tremblay MS. Technical reliability assessment of three accelerometer models in a mechanical setup. Med Sci Sports Exerc. 2006; 38(12):2173–2181. DOI: 10.1249/01.mss. 0000239394.55461.08 [PubMed: 17146326]
38. Welk GJ, Schaben JA, Morrow JR Jr. Reliability of accelerometry-based activity monitors: a generalizability study. Med Sci Sports Exerc. 2004; 36(9):1637–1645. [PubMed: 15354049] 39. Choi L, Liu Z, Matthews CE, Buchowski MS. Validation of accelerometer wear and nonwear time
classification algorithm. Med Sci Sports Exerc. 2011; 43(2):357–364. DOI: 10.1249/MSS. 0b013e3181ed61a3 [PubMed: 20581716]
40. Wong SL, Colley R, Connor Gorber S, Tremblay M. Actical accelerometer sedentary activity thresholds for adults. J Phys Act Health. 2011; 8(4):587–591. DOI: 10.1123/jpah.8.4.587 [PubMed: 21597132]
41. Colley RC, Garriguet D, Janssen I, Craig CL, Clarke J, Tremblay MS. Physical activity of Canadian adults: accelerometer results from the 2007 to 2009 Canadian Health Measures Survey. Health Rep. 2011; 22(1):7–14.
42. Evenson KR, Sotres-Alvarez D, Deng YU, et al. Accelerometer adherence and performance in a cohort study of US Hispanic adults. Med Sci Sports Exerc. 2015; 47(4):725–734. DOI: 10.1249/ MSS.0000000000000478 [PubMed: 25137369]
43. Jenkinson C, Layte R, Jenkinson D, et al. A shorter form health survey: can the SF-12 replicate results from the SF-36 in longitudinal studies? J Public Health Med. 1997; 19(2):179–186. DOI: 10.1093/oxfordjournals.pubmed.a024606 [PubMed: 9243433]
44. Berkman LF, Syme SL. Social networks, host resistance, and mortality: a nine-year follow-up study of Alameda County residents. Am J Epidemiol. 1979; 109(2):186–204. DOI: 10.1093/ oxfordjournals.aje.a112674 [PubMed: 425958]
45. Marin G, Sabogal F, Marin BV, Oterosabogal R, Perezstable EJ. Development of a short acculturation scale for Hispanics. Hisp J Behav Sci. 1987; 9(2):183–205. DOI: 10.1177/07399863870092005
46. Enders CK. The performance of the full information maximum likelihood estimator in multiple regression models with missing data. Educ Psychol Meas. 2001; 61(5):713–740. DOI: 10.1177/0013164401615001
47. Giffuni J, McMurray RG, Schwartz T, Berry D. Actical accelerometry cut-points for quantifying levels of exertion: comparing normal and overweight adults. Int J Exerc Sci. 2012; 5(2):9. 48. Hooker SP, Feeney A, Hutto B, et al. Validation of the actical activity monitor in middle-aged and
older adults. J Phys Act Health. 2011; 8(3):372–381. DOI: 10.1123/jpah.8.3.372 [PubMed: 21487136]
49. Chen LJ, Stevinson C, Ku PW, Chang YK, Chu DC. Relationships of leisure-time and non-leisure-time physical activity with depressive symptoms: a population-based study of Taiwanese older adults. Int J Behav Nutr Phys Act. 2012; 9:28.doi: 10.1186/1479-5868-9-28 [PubMed: 22413813] 50. Bustamante EE, Wilbur E, Marquez DX, Fogg L, Staffileno BA, Manning A. Physical activity
characteristics and depressive symptoms in older Latino adults. Ment Health Phys Act. 2013; 6(2): 69–77. DOI: 10.1016/j.mhpa.2013.05.001
51. Arredondo EM, Lemus H, Elder JP, et al. The relationship between sedentary behavior and depression among Latinos. Ment Health Phys Act. 2013; 6(1):3–9. DOI: 10.1016/j.mhpa. 2012.10.005
52. De Moor MH, Beem AL, Stubbe JH, Boomsma DI, De Geus EJ. Regular exercise, anxiety, depression and personality: a population-based study. Prev Med. 2006; 42(4):273–279. DOI: 10.1016/j.ypmed.2005.12.002 [PubMed: 16439008]
A
uthor Man
uscr
ipt
A
uthor Man
uscr
ipt
A
uthor Man
uscr
ipt
A
uthor Man
uscr
53. Rethorst CD, Wipfli BM, Landers DM. The antidepressive effects of exercise: a meta-analysis of randomized trials. Sports Med. 2009; 39(6):491–511. DOI: 10.2165/00007256-200939060-00004 [PubMed: 19453207]
54. Hallgren M, Nakitanda OA, Ekblom O, et al. Habitual physical activity levels predict treatment outcomes in depressed adults: A prospective cohort study. Prev Med. 2016; 88:53–58. DOI: 10.1016/j.ypmed.2016.03.021 [PubMed: 27061876]
55. Basavarajaiah S, Boraita A, Whyte G, et al. Ethnic differences in left ventricular remodeling in highly-trained athletes relevance to differentiating physiologic left ventricular hypertrophy from hypertrophic cardiomyopathy. J Am Coll Cardiol. 2008; 51(23):2256–2262. DOI: 10.1016/j.jacc. 2007.12.061 [PubMed: 18534273]
56. Whelton SP, Chin A, Xin X, He J. Effect of aerobic exercise on blood pressure: a meta-analysis of randomized, controlled trials. Ann Intern Med. 2002; 136(7):493–503. DOI:
10.7326/0003-4819-136-7-200204020-00006 [PubMed: 11926784]
A
uthor Man
uscr
ipt
A
uthor Man
uscr
ipt
A
uthor Man
uscr
ipt
A
uthor Man
uscr
A
uthor Man
uscr
ipt
A
uthor Man
uscr
ipt
A
uthor Man
uscr
ipt
A
uthor Man
uscr
ipt
Table 1
Weighted Sample Characteristics
Variable Mean SE
Age (years) 41.06 0.25 Female (%) 52.13 0.54 CES-D Depressive Symptoms 7.00 0.08 Objective Physical Activity*
Light (min/day) 217.53 1.56 Moderate (min/day) 19.51 0.37 Vigorous (min/day) 2.53 0.12 Sedentary (min/day) 671.93 3.33 Body Composition (BMI)
Underweight (%) 1.36 0.14 Normal Weight (%) 22.03 0.51 Overweight (%) 37.10 0.60 Obese (%) 39.39 0.67 SF-12 Physical Health 49.96 0.14 Social Support
# of immediate family 3.74 0.02 # of extended family 5.44 0.04 Household Income
< $20,000 (%) 41.85 0.87 $20,000–50,000 (%) 36.88 0.67 > $50,000 (%) 11.70 0.77 Missing/declined (%) 9.57 0.39 Education Level
< High School (%) 32.35 0.71 High School (%) 28.20 0.55 > High School (%) 39.46 0.81 Hispanic Origin
Mexican (%) 37.37 1.64 Cuban (%) 20.02 1.68 Puerto Rican (%) 16.15 0.79 Dominican (%) 9.94 0.71 Central American (%) 7.40 0.55 South American (%) 4.98 0.32 More than 1/Other (%) 4.13 0.28 Short Acculturation Scales
A
uthor Man
uscr
ipt
A
uthor Man
uscr
ipt
A
uthor Man
uscr
ipt
A
uthor Man
uscr
ipt
T ab le 2 Correlations W ith Depressi ve Symptoms and P
A Intensity Minutes/Day
P
earson corr
elations of continuous co
v ariates CES-D Sedentary LP A MP A VP A Age 0.072 0.098 − 0.126 − 0.203 − 0.106 BMI 0.074 0.062 − 0.066 − 0.142 − 0.100 SF-12 Ph ysical Health − 0.245 − 0.154 0.119 0.144 0.090
Social Support (Extended F
amily) −0.018 − 0.056 0.100 − 0.180 − 0.005
SASH Social subscale
−0.001
0.092
−0.012
0.073
0.057
SASH language subscale
0.031 0.099 − 0.037 0.112 0.095 Spearmen corr
elations of categorical co
v ariates CES-D Sedentary LP A MP A VP A Se x 0.155 −0.006 − 0.092 − 0.275 − 0.296 Household Income − 0.013 − 0.034 0.015 0.012 0.055 Education − 0.102 − 0.073 − 0.044 0.008 0.057
Social Support (contact with immediate f
amily) − 0.026 − 0.073 0.042 0.008 0.020
* Correlations in bold are signif
icant at
P
A
uthor Man
uscr
ipt
A
uthor Man
uscr
ipt
A
uthor Man
uscr
ipt
A
uthor Man
uscr
ipt
T
ab
le 3
Single V
ariable and P
artition Models of Ph
ysical Acti
vity (P
A) Predicting Depressi
v
e Symptoms
Single v
ariable models
P
artition models
β
95% CI
P
β
95% CI
P
Sedentary
−0.001
−0.093
0.091
0.978
0.12
0.042
0.198
0.003
Light P
A
0.008
−0.096
0.112
0.882
0.117
−0.003
0.237
0.055
Moderate P
A
0.053
−0.415
0.521
0.824
0.405
−0.152
0.962
0.155
V
igorous P
A
−0.936
−1.83
−0.040
0.041
−1.095
−2.130
−0.060
A
uthor Man
uscr
ipt
A
uthor Man
uscr
ipt
A
uthor Man
uscr
ipt
A
uthor Man
uscr
ipt
T ab le 4Isotemporal Models of Ph
ysical Acti
vity (P
A) Intensities Predicting Depressi
v e Symptoms Sedentary Beha vior Light P A Moderate P A V igor ous P A β 95% CI P β 95% CI P β 95% CI P β 95% CI P Replacing sedentary Dropped −0.003 −0.113 0.107 0.955 0.285 −0.264 0.834 0.308 −1.215 −2.250 −0.180 0.021
Replacing light P
A 0.003 −0.011 0.113 0.955 Dropped 0.288 −0.304 0.880 0.34 −1.212 −2.244 −0.179 0.021
Replacing moderate P
A −0.285 −0.834 0.264 0.308 −0.288 −0.880 0.304 0.34 Dropped −1.5 −2.883 −0.116 0.034
Replacing vigorous P