IP Traceback-based Intelligent Packet Filtering: A Novel Technique for
Defending Against Internet DDoS Attacks
Minho Sung and Jun Xu
College of Computing
Georgia Institute of Technology
Atlanta, GA 30332-0280
f
mhsung,jx
g@cc.gatech.edu
Abstract
Distributed Denial of Service (DDoS) is one of the most difficult security problems to address. While many existing techniques (e.g., IP traceback) focus on tracking the loca-tion of the attackers after-the-fact, little is done to mitigate the effect of an attack while it is raging on. In this pa-per, we present a novel technique that can effectively filter out the majority of DDoS traffic, thus improving the overall throughput of the legitimate traffic. The proposed scheme leverages on and generalizes the IP traceback schemes to obtain the information concerning whether a network edge is on the attacking path of an attacker (“infected”) or not (“clean”). We observe that while an attacker will have all the edges on its path marked as “infected”, edges on the path of a legitimate client will mostly be “clean”. By pref-erentially filtering out packets that are inscribed with the marks of “infected” edges, the proposed scheme removes most of the DDoS traffic while affecting legitimate traffic only slightly. Simulation results based on real-world net-work topologies (e.g., Skitter) all demonstrate that the pro-posed technique can improve the throughput of legitimate traffic by 3 to 7 times during DDoS attacks.
1. Introduction
Distributed Denial of Service (DDoS) attacks against high-profile web sites such as Yahoo, CNN, Amazon and E*Trade in early 2000 [11] demonstrate how damaging DDoS attacks are, and how defenseless the Internet is under such attacks. The services of these web sites were unavail-able for hours or even days as a result of the attacks. New instances of DDoS attacks continue to be reported.
Unfortunately, today’s Internet is not equipped with proper defense mechanisms against DDoS attacks1. Even
This work is supported in part by the National Science Foundation under grant ITR/SY 0113933.
1Although many routers haveingress filteringcapabilities, they are
usu-tracing the perpetrators of an attack proves a daunting task, since the source IP address of a packet can easily be spoofed. To allow for effective attack origin tracing in the future Internet, a large number of IP traceback schemes [5, 8, 19, 22, 9, 21] have been proposed. These schemes (except [5, 21]) all require intermediate routers to inscribe a mark into the packet header that encodes the identity of an intermediate router or edge. After collecting a sufficient number of such marks, the victim will be able to reconstruct the network paths leading to the attackers. While IP trace-back techniques allow the victim to infer the origins of the attack after the fact, they are in general not able to mitigate the effect of a DDoS attack while it is raging on.
In this paper, we propose aprotocol-independentDDoS defense scheme that is able to dramatically improve the throughput of legitimate traffic during a DDoS attack. It works by performing “smart filtering”: dropping DDoS traffic with high probability while allowing most of the le-gitimate traffic to go through. This clearly requires the vic-tim to be able to statistically distinguish legivic-timate traffic from DDoS traffic. The proposed scheme leverages on and extends IP traceback techniques to gather “intelligence”: in-formation such as whether or not a network edge is on the path from an attacker (“infected”). By preferentially filter-ing out packets that are inscribed with the mark (identity) of an “infected” edge, the proposed scheme filters out most of the traffic from attackers, since each and every edge on an attacker’s path to the victim is infected. Packets from a legitimate client, on the other hand, with high probability will not be filtered out, since typically most of the edges on the client’s path to the victim are not infected. To evalu-ate its effectiveness in defending against DDoS attacks, the proposed scheme is simulated on real-world Internet topolo-gies with varying operating parameters. Simulation results demonstrate that the throughput of the legitimate traffic can be increased by 3 to 7 times. To the best of our knowledge, this is the first research that leverages on IP traceback for
automaticDDoS response. What makes this approach more
ally not turned on due to their nonnegligible overhead on router perfor-mance.
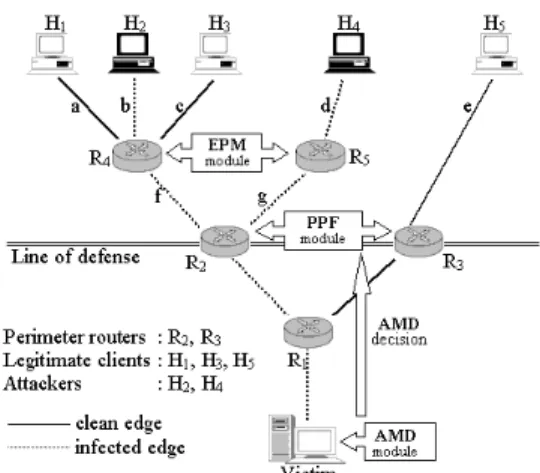
Figure 1. The Perimeter router model
appealing is that the operations required of routers (proba-bilistic marking) are fully in line with the operations of IP traceback.
The rest of the paper is organized as follows. In the next section, we present the system model and the overview of the proposed scheme. Sections 3 and 4 present the algorith-mic components of the scheme in detail. Its performance is evaluated in Section 5 through simulation studies. Section 6 discusses the potential applications of the proposed scheme. Section 7 surveys the related work and Section 8 concludes the paper.
2. System Model and Overview
The proposed scheme extends and leverages on existing IP traceback schemes [8, 19, 22, 9, 3]. IP traceback allows the victim to infer the paths that packets from the attackers have traversed. The proposed scheme uses this information to preferentially filter out packets that are more likely to come from the attackers. Here we first discuss where in the network the filtering will actually take place.
2.1. System Model
It was first observed in [17] that, when a DDoS attack oc-curs, most of the traffic is dropped by the upstream routers even before it reaches the victim. In this case, nothing can be done by the victim to improve the throughput of the legit-imate traffic. To mitigate the attack, proper action needs to be taken at upstream routers. Therefore, we adopt a similar system model to [17], shown in Fig. 1. The protected net-work is connected to the wide area netnet-work (WAN) through a gateway access control device (i.e., a firewall). A set of upstream routers will form a “line of defense”, referred to asa perimeterin the sequel. The routers on the perimeter, referred to asperimeter routers, will collaboratively inspect packets going through them. For simplicity of discussion, we assume that all perimeter routers are of the same dis-tance (referred to as perimeter radius) away from the vic-tim2.
2In situations where the upstream routers are not bottlenecked, this
fil-tering process may happen at the gateway access control device (firewall).
Figure 2. Example network as seen from the victim
2.2. Overview of the Proposed Scheme
The proposed scheme improves the throughput of legiti-mate traffic during a DDoS attack, by preferentially filtering out traffic that is more likely to come from an attacker than a legitimate host. To make this distinction, it leverages on and extends IP traceback techniques to infer whether or not a network edge is on the path from an attacker. The scheme can be viewed as a distributed algorithm that consists of the following three modules. The coupling of these mod-ules with the actual physical devices and the interactions between these modules are shown in Fig. 2.
Enhanced Probabilistic Marking (EPM) module. This module is an extension of the probabilistic marking module in IP traceback schemes. Thislight-weightmodule is run-ning on each participating Internet router, whether or not there are DDoS attacks. Recall that in IP traceback, each Internet router needs to inscribe, with a certain probability, a mark into infrequently-used IP header fields (e.g., fields used for IP fragmentation) [19]. Our scheme further splits such marks into two types. Packets of the first type are used by the AMD module below for IP traceback and packets of the second type are used by the PPF module below for intelligent filtering.
Attack Mitigation Decision-making (AMD) module. Running on the victim or the border gateway device (e.g., firewall) of the victim site, this module implements two functions: (a) reconstructing attack paths using existing IP traceback algorithms based on information contained in the aforementioned marks of the first type once an attack is de-tected, and (b) making algorithmic decisions as to packets inscribed with what type of marks should be passed with what probability, based on the results from (a). The deci-sions from (b) will be conveyed to the perimeter routers to
be carried out. We will show that there is little communica-tion overhead in transporting such informacommunica-tion.
Preferential Packet Filtering (PPF) module. This mod-ule is running on every perimeter router. These modmod-ules will differentially filter packets (destined for the victim) that contains the aforementioned marks of the first type, based on the instructions issued to them from the AMD module, once an attack is detected. We will show that little pro-cessing overhead is incurred at the perimeter routers: each filter/pass decision requires only the computation of a hash value and a table lookup.
In the following two sections, we describe the design of the three aforementioned modules in detail.
3. Design of the Enhanced Probabilistic
Mod-ule (EPM)
The proposed scheme extends and leverages on existing IP traceback schemes [8, 19, 22, 9]. In IP traceback, each Internet router inscribes, in a probabilistic way, a mark into a low-entropy IP header field (called “mark field” hereafter) set aside for this purpose. These markscollectivelyallow the victim to reconstruct the “attack graph”, which consists of the network edges that the packets from the attackers have traversed. We can view the marked fields inscribed at the packet headers by IP traceback schemes as a commu-nication channel. IP traceback uses this channel for only one purpose: to convey the encoded information about the “attack graph”. Our scheme, on the other hand, splits this channel into the following two subchannels.
One subchannel, called thesignaling subchannel, will continue to carry the same information needed for IP trace-back. It occupies about 5% of the channel bandwidth, i.e., only 5% of the marks are signaling marks. This implies that the reconstruction of the whole attack graph will be 20 times slower than in the underlying IP traceback scheme. Fortu-nately, the preferential filtering becomes very effective in improving the throughput of legitimate traffic as soon as a critical portion of the attack graph is reconstructed. As we will show, the nature of the probabilistic marking used in IP traceback determines that it takes much less (less than 10% of the latter) packets/time to obtain this critical portion than obtaining the whole attack graph.
The other subchannel, called thedata subchannel, will consume the remaining 95% of the channel bandwidth. In-formation contained in the data subchannel, combined with the “attack graph” reconstructed from the signaling sub-channel, will allow the perimeter routers to infer whether the packet is more likely to come from an attacker or a le-gitimate host. A packet will be preferentially filtered out or passed by the perimeter routers if it is determined to be more likely to come from the attackers or legitimate hosts, respectively.
1.for each packet pkt 2. u := uniform(0,1) 3. if (u < q) then 4. v := uniform(0,1) 5. if (v < r) then
6. encode mark in a way suitable for IP traceback 7. set flag to 1 to indicate signaling subchannel 8. pkt.hopcount := 0
9. else
10. encode mark in a way suitable for filtering 11. set flag to 0 to indicate data subchannel 12. else
13. if (flag == 1) pkt.hopcount++
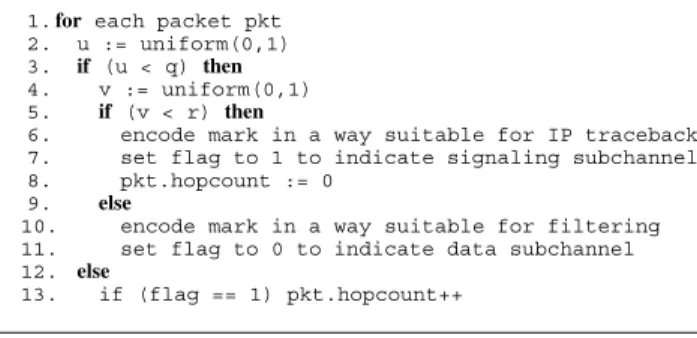
Figure 3. Marking procedure at an upstream router
Signaling mark format
flag=1 distance value depends on the IP traceback scheme
Data mark format
flag=0 hash value of the IP addresses of an edge or node
5 bits
1 bit 11 bits
Figure 4. Mark format for signaling and data subchannels
The marks contained in packet headers will correspond-ingly be split into two types, namely, signaling marks and data marks. They carry signaling and data subchannel in-formation respectively. The enhanced marking algorithm that performs such splitting is shown in Fig. 3. When a packet pkt arrives at a router, the router decides whether it will overwrite the current mark with marking probabil-ityq. If it decides to overwrite the mark, the router then decides whether this mark should be a signaling mark or a data mark, with probabilityror1 r, respectively. For a signaling mark, the hop count is maintained in same way as in IP traceback; it will be reset to 0 if the router overwrites the mark or simply incremented by 1 otherwise. For a data mark, there is no hop count field.
3.1. Encodings for Data and Signaling Marks
Fig. 4 shows the data formats of signaling and data marks. A mark, for both subchannels, will consist of 17 bits, one more bit than current IP traceback schemes [19, 22]. The first bit is a flag that indicates whether the mark is a sig-naling or a data mark. For a data mark, the remaining 16 bits will be the hash value of an edge or node. For a signaling mark, the remaining part will be further split into two parts. The first five bits encode thehop count, the distance in num-ber of hops from the router where the mark is inscribed to the victim, provided that the mark is not overwritten on its way to the victim. The encoding for the remaining 11 bits
varies from one IP traceback scheme to another. Note that the format for control marks follows the same convention as in IP traceback schemes [19, 22] for backward compati-bility.
This 17-bit-long mark can be encoded into two IP header fields: the IP fragmentation field (as suggested in [19] and also used by others [22]) and an unused bit next to the DF (Don’t Fragment) bit. Note that we use one bit more than IP traceback for backward compatibility3. This encoding is
described in [23] in detail.
Since, to certain a degree, both data and signaling sub-channels convey the information as to what edges a packet has traversed, a careful comparison is necessary. As the mark field is in generally small (typically 16 bits), it is not enough for holding the pair of IP addresses (that of two ver-tices) needed to represent a network edge. In the signaling subchannel, such an address pair needs to be broken down into several pieces using various coding techniques. For ex-ample, an infected edgeXmay be broken down into mark valuesa,b,c, andd, while a clean edge/nodeY could be broken down to valuesa, b,e, andf. Such a breakdown brings accuracy to the traceback schemes (i.e., fewer false positives) [22], but it also introduces the following ambigu-ity for preferential filtering purposes. When a packet with mark valueaorbarrives, it could come through eitherXor Y, making it hard to determine whether the packet should be passed (if fromY) or filtered out (if fromX).
Therefore, the 16-bit field in the data subchannel encod-ing needs to “summarize” the whole identity of a network edge rather than a portion in order to eliminate such am-biguity. In our scheme, encoding using a hash function is used: v := H (e). HereHis a public uniform hash func-tion, used by all Internet routers participating in the pro-posed scheme. erepresents the edge “summarized” by the hash valuev. Compared with perfect encoding of an edge (using the full 64 bits for encoding the IP address pair), such hash encoding causes only negligible loss of accuracy due to hash function collision, as shown by our simulation study.
3.2. Choice of the Underlying IP Traceback Scheme
Although the proposed scheme may leverage on any of the existing IP traceback schemes [5, 8, 19, 22, 9, 21], in this paper, we show how it builds on the Advanced Marking Scheme (AMS) proposed by Song and Perrig [22]. The ad-vantage of the AMS is that it provides faster reconstruction and higher accuracy (hence fewer false positives in identify-ing attackers) than other IP traceback schemes, when there are more than one attackers. However, it assumes that the victim is able to obtain a map of upstream routers, which is a stronger (arguably less practical) assumption than used in 3It is possible to squeeze everything into 16 bits, at the cost of less
ac-curacy in traceback and preferential filtering. The level of deterioration is dependent on parameters such as the number of attackers and the network topology.
other IP traceback schemes4. Our future research will study how our scheme works with other IP traceback techniques. AMS [22] employs a technique similar to the Bloom fil-ter [4] as follows. It uses 8 independent hash functions fH
i g
1i8to encode network edges. When a packet goes through an edge e and the identity of the edge is to be marked,iwill be chosen uniformly between 1 and 8, and the markijjH
i
(e)is written into the IP header of the packet (jj representing concatenation). The reconstruction algo-rithm determines that an attacker has eon its path, if and only if, the algorithm has received attacking packets with at leastkout of the 8 mark valuesfH
i (e)g
1i8. The tunable parameterkis between 6 and 8; largerkresults in longer “attack graph” reconstruction time but fewer false positives when identifying infected edges. We view this as a vari-ant of Bloom filter since all the edges that an attacker has traversed can be viewed as a set, and it is represented by a bit array indexed by the values generated by these hash functions.
In the rest of paper, we assume that AMS [22] is used as the underlying IP traceback scheme. In [22], trace-driven simulation is used to estimate the average number of pack-ets that needs to be received by the victim in order to recon-struct the attack graph. However, results obtained through such simulation do not explain how this value changes when the parameters such as the network topology and the num-ber of attackers vary. We derive the exact closed-form math-ematical formula for calculating a closely-related metric: the average number of marks (denoted asn
l) that needs to be received from an attackerlhops away for the victim in order to reconstruct the attack path from this attacker. This metric is more accurate since it is independent of the topol-ogy of the network and the sending rate of other attackers. The formula for n
l is characterized by the following the-orem. Its proof is omitted here due to space limitations, which can be found in [23].
Theorem 1 Letqbe the probability of writing a mark into
the IP header by an upstream router andrbe the probability
for the mark to be a signaling mark. Lethbe the number
of independent hash functionsH 0 i
sused in [22] andk be
the number ofH i
(e) 0
sto “convict” an edgee. Then, the
average number of packetsn
lthat needs to be received for
the victim to reconstruct a path of length l(in number of
hops) is:
n l
= 1 r Z
1
0 2 4 1
l Y
i=0 0 @
h X
j=k
h j
(1 e
i
t )
j e
i
t(h j) 1 A 3 5
dt (1)
where i
= q(1 q)
i h
;i=0;1;;l
4The practical issues in constructing and maintaining such a map are
discussed in [22], based on the techniques proposed by Cheswick et al. [7].
1000 10000 100000 1e+06 1e+07
0 5 10 15 20 25
Number of required packets
Path length (hops) (a) h = 8, k = 8, r = 0.05 q=0.05
q=0.10 q=0.15 q=0.20 q=0.25
1000 10000 100000 1e+06 1e+07
0 5 10 15 20 25
Required packets
Path length (hops) (b) h = 8, k = 6, r = 0.05 q=0.05
q=0.10 q=0.15 q=0.20 q=0.25
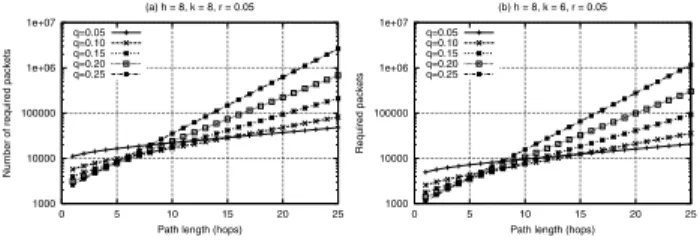
Figure 5. Expected number of marks (Y-axis) needed for reconstructing a path of certain length (X-axis)
3.3. On Tuning the Parameter
rThe parameterr(the percentage of marks being signal-ing marks) is set at a small number (5%) since, for the rea-son of “ambiguity” explained above, packets containing sig-naling marks generally cannot beselectively filtered outto improve the throughput of legitimate traffic. Therefore, for our scheme to work, the majority of packets should bear data marks.
In Fig. 5, we show the expected number of packets (Y axis is in log scale) that needs to be received for reconstruct-ing an attack path of lengthl(X axis), with parameterkset to 8 and 6, respectively. Recall that an edge is convicted if kmarks out of the set fH
i g
1i8 (here
his 8) are found in DDoS packets. It was shown in [22] that when the num-ber of attackers is no more than a few thousands, the false positive percentage is low enough even whenkis 6, and im-proves whenkis bigger. In each figure, there are five curves corresponding to differentqparameters. It can be seen that, other parameters being equal,n
lincreases with the
kvalue. So a curve in Fig. 5a is always higher than the correspond-ing curve (with the sameqvalue) in Fig. 5b. This represents the tradeoff between the false positives and n
l. However, the differences between these curves are small in the multi-plicative sense. In the same figure, largerqvalues usually result in largern
lvalues when the hop counts are reasonably large. This is because, whenqbecomes larger, it becomes harder to gather marks that are close to the attackers, since they are far away from the victim5.
Our simulation results (shown in Section 5.2) indicate that the scheme works best when theq value is set to be-tween 0.15 and 0.2. Whenq =0:15, we can see from Fig. 5 that it would take between 92972 (k = 6) and 210911 (k = 8) packets to reconstruct a path of length 25. For a host attacking at 300 Kbps (considered typical broadband speed) sending 300 packets per second and 1000 bits per packet, this would take at least 300 to 700 seconds to gather all the marks needed for “attack graph” reconstruction. For-tunately, we do not need to construct the whole path to bene-5The converse is true when the hop count is very small (e.g., less than
8), since it becomes harder to gather marks that are close to the victim. This explains why the curves are pairwisely intersecting each other.
Task I (executed continuously in the background) 1. Incrementally reconstruct the attack graph
2. Measure incoming rates at the border gateway device
Task II (executed periodically) 1. From Task I
2. Obtain an attack graph ‘snapshot’ and current incoming rates
3. Based on this information 4. Construct the hash bitmap
5. Evaluate Asig naling, Aclean, and Aunsur e
6. Send the results obtained from steps 3--5 to perimeter routers
Figure 6. Attack Mitigation Decision-making (AMD) algorithm
fit tremendously from the preferential filtering scheme. Our simulation results also show (see Section 5.2) that as long as most of the infected edges that are within 15 hops from the victim are reconstructed, the proposed scheme can achieve the vast majority (over 98%) of the performance improve-ment. To construct a path of length 15 when q = 0:15, only between 18312 and 41531 packets from an attacker are needed. This will reduce the delay to between 60 and 140 seconds! In summary, when qis set to 0.15, it takes very little time for the victim to construct this critical por-tion of the attack graph for our preferential filtering scheme to achieve most of the performance improvement.
4. Design of the AMD and PPF Modules
The function of the AMD (Attack Mitigation Decision) module is to leverage on an underlying IP traceback scheme to reconstruct the attack graph, once a DDoS attack has been detected. Based on this information, it makes the decision as to how the packets should be preferentially filtered at the perimeter routers. This decision will be transported to the perimeter routers, to be carried out by the PPF modules run-ning on them. The functionality of the AMD module and the PPF module will be discussed in detail in Sections 4.1 and 4.2, respectively.
4.1. Design of the AMD Module
AMD modules are executed at the victim or the border gateway device on behalf of the victim. As shown in Fig. 6, the AMD module consists two tasks:
Task I:This task is continuously executed in the back-ground after a DDoS attack has been detected. It employs an existing IP traceback scheme such as [22] to reconstruct the attack graph, based on the signaling marks they have re-ceived. It also measures the current incoming rates to the victim during two probe periods (discussed in detail in Sec-tion 4.1.1), which will be used to adjust parameters for fil-tering.
Task II: This task is executed periodically after the DDoS attack has been detected. At the beginning of each period, the most recent “snapshot” of the attack graph and the incoming rates during the previous period will be ob-tained from the task I. Based on this information, it decides with which probability packets containing a certain type of mark should be passed. Note these probabilities will change when the attack graph evolves and when the incoming rates changes. This decision will then be sent to the perimeter routers implementing PPF modules to be carried out. This task will be discussed in detail in Section 4.1.2.
4.1.1 Details of Task I
In Task I, the signaling marks will be processed by the un-derlying IP traceback scheme [22] to reconstruct the attack graph. Such a recent snapshot of the attack graph will be periodically probed and used by the Task II. In other words, the filtering can happen in parallel with the reconstruction process, and the benefit of filtering increases as the attack graph evolves. We will show through simulation that when all edges on the attack graph within perimeter 15 are recov-ered, 98% of the potential performance improvement can be achieved. As we have discussed in Section 3.3, it takes only 60 to 140 seconds to reconstruct this critical portion.
As we will show, adjusting the filtering parameters in Task II require the measurement of the incoming traffic rates. The measured values will be reset and recalculated periodically by Task I, after it is probed by Task II.
4.1.2 Details of Task II
Task II decides the probabilities with which packets carry-ing various “mark types” are passed. The marks contained in the packets are classified into the following three types: (I) Signaling marks that carry information for IP traceback. (II) Data marks that corresponds to the hash value of a “clean” edge.
(III) Data marks that correspond to the hash value of an “in-fected” edge6 or are left empty (all-zero). The latter
hap-pens when no router on the path inscribes a mark on the packet due to the probabilistic nature of the marking algo-rithm7.
Corresponding to these three mark types, the following three probability values are computed:
A
signaling: the probability of passing packets with type I marks.
6Hash collisions may happen, but as we have discussed, they make
negligible differences on the metrics we are interested in.
7This happens very rarely when the path is reasonably long. In the real
Internet topology, the percentage of such packets is about 1% to 2% when the marking probability is set to 0.15.
A
clean: the probability of passing packets with type II marks
A
unsure: the probability of passing packets with type III marks.
The following Knapsack algorithm is executed to decide these three probabilities:
1. At the beginning of the attack, a target bandwidth of B
signaling (initially set to 50% of the available bandwidth at the victim) is set to allow packets bearing type I marks to pass. This allows the “attack graph” to be reconstructed (by Task I) as quickly as possible. As more and more edges of the attack graph are reconstructed, this percent-age can be gradually reduced to 20% of the victim band-width. The value of A
signaling should be set such that, when each perimeter router passes packets bearing type I marks with probabilityA
signaling, the total incoming traf-fic bearing type I marks is equal toB
signaling. A
signaling is set to 100% when no such value exists.
2. Like in the last step, set the target rate for the packets with marks of type II to the remaining bandwidth (50% at the beginning and eventually becomes 80%) at the victim. The value ofA
cleanshould be set such that either this target bandwidth is exactly reached orA
clean
=100%.
3. If there are still bandwidths left after steps 1 and 2, set parameterA
unsureso that the remaining bandwidth can be filled by packets bearing marks of type III.
The scheme needs to adapt to the changes in attack inten-sity and the availability of new information such as the evo-lution of the “attack graph”. This is done through the fol-lowing iterative algorithm ((1)–(3)) that is executed periodi-cally. Task I periodically measures the incoming rates of the traffic bearing the aforementioned three types of marks, de-noted as ~
R
signaling, ~ R
clean, and ~ R
unsure, respectively. All these three probabilities A
signaling, A
clean, and A
unsure are initially set to 100%. Based on the values (A
prev ) mea-sured during the previous time period, the values to be set during the new time period (A
next ) are:
(1)A next sig naling
=min(1;A pr ev sig naling
B sig naling
= ~ R
sig naling )
(2)A next clean
=min(1;A pr ev clean
B clean
= ~ R
clean )
(3)A next unsur e
=min(1;(1+)A pr ev unsur e
;A pr ev unsur e
Bunsur e= ~ Runsur e) Note that in iterations (1)–(3), the parameter values are probabilities and therefore should never exceed 1. These iterations allow the parameters quickly adapt to a resource allocation “point” where the victim bandwidth is fully uti-lized and this bandwidth is partitioned among perimeter routers according to the knapsack-filling priority as speci-fied above. In (3),is a small positive constant (e.g., 0.05), which ensures that A
unsure is incremented by no more than a percentage per iteration. This prevents the adversary from causing severe system oscillation by varying the value
~ R
1.for each packet pkt
2. if pkt contains a signaling mark then 3. pass pkt with probability A
sig naling
4. else /*pkt contains a data mark*/ 5. index:=H(pkt.src IP)
6. if (bitmap[index] == CLEAN) then 7. pass pkt with probability Aclean
8. else
9. pass pkt with probability A unsur e
Figure 7. Preferential Packet Filtering (PPF) algorithm
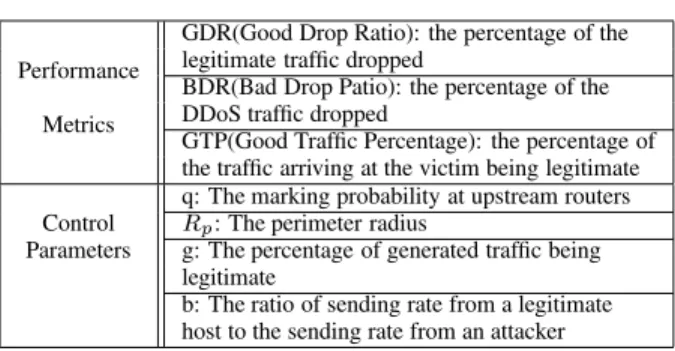
GDR(Good Drop Ratio): the percentage of the legitimate traffic dropped
Performance
BDR(Bad Drop Patio): the percentage of the DDoS traffic dropped
Metrics
GTP(Good Traffic Percentage): the percentage of the traffic arriving at the victim being legitimate q: The marking probability at upstream routers Control Rp: The perimeter radius
Parameters g: The percentage of generated traffic being legitimate
b: The ratio of sending rate from a legitimate host to the sending rate from an attacker
Table 1. Performance Metrics and Control Pa-rameters
In addition, the AMD module needs to compute a hash bitmapMof 64K entries (corresponding to 16 bit hash val-ues), which encodes the “attack graph”, as follows. LetS be the set of edges that are known to be infected so far (ob-tained in Task I). ThenM[i]:=1ifi2fH (e)je2Sg, and M[i]:= 0otherwise. Note that more entries ofMare set to 1 when the attack graph evolves.
The new parameters calculated from iterations (1)–(3) and the hash bitmap will then be transported to the perime-ter rouperime-ters to be used for preferential packet filperime-tering. Clearly, a communication protocol is needed to disseminate such information to perimeter routers securely. A protocol similar to those proposed in [17] may be adapted for this purpose. This is an important issue to be addressed in our future research. It is, however, outside the scope of this pa-per.
4.2. Design of the Preferential Packet Filtering
(PPF) Module
Preferential packet filtering is carried out at the perime-ter rouperime-ters based on the filperime-tering parameperime-ters (A
signaling, A
clean, and A
unsure) and the hash bitmap received from the AMD module. Figure 7 presents the filtering algorithm in detail. Its operation is straightforward: passing packets with type I, II, and III marks with probabilitiesA
signaling, A
clean, and A
unsure, respectively. Note that the execu-tion of the algorithm incurs negligible overhead at perime-ter rouperime-ters: one hash function computation plus one table
lookup.
5. Performance Evaluation
Extensive simulation studies have been conducted on five real-world network topologies (one from [7] and four from [2]) to evaluate the effectiveness of the proposed scheme in improving the throughput of the legitimate traffic. Simulation results demonstrate that such throughput can be improved by three to seven times during an attack. In this paper, we only present the simulation results on two of them due to space limitations.
5.1. Simulation Set-up: Topologies and Metrics
Simulation results from the following two topologies are presented in this paper.
Cheswick’s Internet topology dataset – Cheswick et al. [7] have designed a software tool to construct the routes from an origin host to other hosts across the Internet. The results are recorded in six Internet topology databases. In our simulation, we merged them into one and trimmed out incomplete routes (in which end hosts have not been reached). The final data has the complete routes from an origin (a Bell Labs host) to 86,813 other hosts.
Skitter data I (aroot.paths.20011128) – Using the soft-ware tool designed by Cheswick et al. [7], CAIDA (Co-operative Association for Internet Data Analysis) has col-lected topology originated from a CAIDA-owned host (a-root.skitter.caida.org) on 11/28/2001 [2]. This data contains the traceroute data from this server to 192,900 destinations. The data collection process is a part of CAIDA’s Skitter project [2].
Note that all topologies are routes from a single origin to multiple hosts on the Internet. In our simulations, we assume that this origin is the victim and the attackers and legitimate clients are randomly distributed among the des-tination hosts in the topologies. We fix the number of le-gitimate clients to 250, and the number of attackers vary as other parameters vary.
Since it will be clear that the simulated metric of our scheme is not dependent on the actual values of the param-eters concerning bandwidth and data rates but rather on their relative ratios, we will use abstract “units” for characteriz-ing these parameters instead of the actual rates. We assume that each legitimate user sends at the rate of 1 unit per sec-ond. The bandwidth of the victim site is set to 250 units so that it is 100% utilized by legitimate traffic when there is no attack. For performance evaluation purposes, we also as-sume that each attacker attacks at the same rate (not needed for the correctness of our scheme). The number of attack-ers will be a function of the severity of the attack and the bandwidth per attacker, to be discussed later.
0.05 0.1 0.15 0.2 0.25 0.3 0.35 0.4 0.45 0.5 0.55 0.6
0 0.05 0.1 0.15 0.2 0.25
GTP
Marking probability q (a) Cheswick’s dataset
g=20% g=10% g=05% 0.1 0.15 0.2 0.25 0.3 0.35 0.4 0.45 0.5 0.55 0.6
0 0.05 0.1 0.15 0.2 0.25
GTP
Marking probability q (b) Skitter 1
g=20% g=10% g=05%
Figure 8. GTP (Good Traffic Percentage)
0.45 0.5 0.55 0.6 0.65 0.7 0.75 0.8 0.85 0.9 0.95
0 0.05 0.1 0.15 0.2 0.25
GDR
Marking probability q (a) Cheswick’s dataset
g=20% g=10% g=05% 0.4 0.45 0.5 0.55 0.6 0.65 0.7 0.75 0.8 0.85 0.9 0.95
0 0.05 0.1 0.15 0.2 0.25
GDR
Marking probability q (b) Skitter 1
g=20% g=10% g=05%
Figure 9. GDR (Good Drop Ratio)
Table 1 shows the performance metrics and control pa-rameters used in our simulation. The good traffic percent-age (GTP) is the metric we would like to improve, which is the arrival rate of the legitimate traffic at the victim di-vided by the victim bandwidth. GDR and BDR represent the percentage of legitimate traffic and DDoS traffic that are dropped by the PPF module, respectively. Note that when there is no protection, GDR is equal to BDR since upstream routers would have to drop legitimate and DDoS traffic in-discriminately.
Among the control parameters, q denotes the marking probability at upstream routers. R
p is the perimeter ra-dius (the distance from each router on the perimeter to the victim). The parameterg represents the percentage of in-coming traffic being legitimate andbis the ratio of the rate of an attacker over the rate of a legitimate host. Note that whengandbare set, the number of attackers is calculated as 250(1 g)
bg
(recall that there are 250 legitimate hosts).
5.2. Simulation Results
Figures 8(a) and (b) shows GTP as a function of the marking probability q, under the two aforementioned In-ternet topologies. Here perimeter radiusR
pis set to 2, and bis set to 20. There are three curves in each figure, corre-sponding to three differentg values (5%, 10% and 20%). In other words, if there is no DDoS defense mechanism, the throughput of the legitimate traffic would only be 5%, 10% and 20% of the total victim bandwidth, respectively. In these three situations, the rate of DDoS traffic is 4750, 2250 and 1000 units per second, respectively. Sinceb = 20, it can be computed that the number of attackers in these three situations are 237, 112 and 50, respectively. All figures in-dicate that the best improvement on the legitimate traffic
0.8 0.82 0.84 0.86 0.88 0.9 0.92 0.94 0.96 0.98
0 0.05 0.1 0.15 0.2 0.25
BDR
Marking probability q (a) Cheswick’s dataset
g=20% g=10% g=05% 0.8 0.82 0.84 0.86 0.88 0.9 0.92 0.94 0.96 0.98
0 0.05 0.1 0.15 0.2 0.25
BDR
Marking probability q (b) Skitter 1
g=20% g=10% g=05%
Figure 10. BDR (Bad Drop Ratio)
0.25 0.3 0.35 0.4 0.45 0.5 0.55 0.6 0.65
0 0.05 0.1 0.15 0.2 0.25
GTP
Marking probability q (a) Cheswick’s dataset
b=50 b=20 b=10 0.25 0.3 0.35 0.4 0.45 0.5 0.55 0.6 0.65 0.7
0 0.05 0.1 0.15 0.2 0.25
GTP
Marking probability q (b) Skitter 1
b=50 b=20 b=10
Figure 11. GTP (Good traffic Percentage) by varying parameter b
throughput is achieved whenqis set to between 0.15 and 0.2. We can see from Fig. 8(a) that whenq=0:15,GTPis improved from 5%, 10%, and 20%, to 32.4%, 42.4% and 54.6%, respectively. This represents an improvement of three to seven times. Fig. 8(b) demonstrate improvements of similar magnitudes, under the other topology. Note that in all figures, the GTP results have accounted for the hash collisions (hence the false positives) in the data mark field.
The reason behind such an improvement is illustrated in Figures 9(a,b) and Figures 10(a,b), which show the corre-sponding GDR and BDR values respectively. In Fig. 9a, we can see whenqis set to 0.15, the percentages of legitimate traffic being filtered are 68.3%, 58.5%, and 46.5% respec-tively, whereas these percentages would be 95%, 90%, 80% if there were no DDoS defense. Also, in Fig. 10a, we can see that the percentages of DDoS traffic being filtered are higher than if there were no defense, at 96.4%, 93.5% and 88.4%, respectively. Fig. 9(b) and Fig. 10(b) tell similar stories. Since a much higher percentage of the DDoS traffic is dropped than legitimate traffic, the resulting traffic mix contains a much higher percentage of legitimate traffic.
Figures 11(a,b) show howGTP varies as the parame-terbvaries. Recall thatbrepresents the ratio of the send-ing rate of an attacker over that of a legitimate host. Here, the perimeter radiusR
p is set to 2 like above and g is set to 20% (i.e.,GTP would be 20% if there is no DDoS de-fense). The three curves in each figure represents theGTP values when the parameterbis 10, 20 and 50, respectively. We can see thatGTPcurve is lower whenbis lower. This is because, whenbis lower, the number of attackers (asgis fixed) becomes larger and these attackers are more densely distributed in the topology. This increases the average
per-0.05 0.1 0.15 0.2 0.25 0.3 0.35 0.4 0.45 0.5 0.55
0 5 10 15 20 25
GTP
Number of hops reconstructed (a) Cheswick’s dataset
g=20% g=10% g=05%
0 0.1 0.2 0.3 0.4 0.5 0.6
0 5 10 15 20 25
GTP
Number of hops reconstructed (b) Skitter 1
g=20% g=10% g=05%
Figure 12. GTP (Good Traffic Percentage) with incremental path reconstruction
0.25 0.3 0.35 0.4 0.45 0.5 0.55 0.6 0.65
0 0.05 0.1 0.15 0.2 0.25
GTP
Marking probability q (a) Cheswick’s dataset
radius=0 radius=1 radius=2 radius=3
0.25 0.3 0.35 0.4 0.45 0.5 0.55 0.6 0.65 0.7
0 0.05 0.1 0.15 0.2 0.25
GTP
Marking probability q (b) Skitter 1
radius=0 radius=1 radius=2 radius=3
Figure 13. GTP (Good traffic Percentage) by increasing perimeter radius
centage of edges on a legitimate host’s path to be infected, resulting in the increasing percentage of the legitimate traf-fic to be filtered out due to “guilt by association” (sharing part of a path with an attacker).
Figures 12(a,b) show how GTP improves when “in-fected edges” within a given radius are reconstructed. Here R
p and
qare set to 2 and 0.15, respectively. We can see that in all figures, the curves (corresponding to threeg set-tings) become almost flat after the radius reaches 15. This confirms the claim we have made in Section 3.3 that the vast majority (over 98%) of the performance improvement is attained when infected edges within radius 15 are recon-structed.
Figures 13(a,b) show how GTP improves when the perimeter radius R
p increases. In Fig. 13a, when q is set to 0.15 as above and g is set to 20%, GTP values are 45.8%, 49.7%, 54.6%, and 59.1% respectively, when the perimeter radius size is set to 0, 1, 2, and 3, respec-tively. The other figure also shows that GTP values increase when the perimeter radius becomes larger. Our explana-tion for this is the following. When perimeter radius be-comes larger, all edges become “closer” to the victim, and for each clean edge, there is a higher probability for its mark to go through. Much better results can be obtained when the perimeter radius becomes even higher. However, the num-ber of routers on a perimeter increases dramatically with the size of perimeter radius (shown in [23]). Therefore, there is a tradeoff between the performance improvement and the amount of coordination between the victim and the perime-ter rouperime-ters. We find that a perimeperime-ter size of 2 or 3 represents a reasonable tradeoff between these two factors.
6. Potential Applications of the Proposed
Scheme
While the proposed scheme is able to dramatically im-prove the throughput of legitimate traffic, a high percentage of legitimate traffic may still have to be dropped as “collat-eral damage”. At such a high packet loss probability, the performance of a TCP flow will suffer considerably. Never-theless, when coupled with other DDoS defense techniques, such an improvement can be very important and useful:
Under a DDoS attack, a web server may be able to for-ward the service of a legitimate client to a remote web server that is not directly affected by the attack. Such service redi-rections have been used extensively in content distribution networks (e.g., Akamai [1]). Even at such a high packet loss probability, this short redirection process (taking a couple of packets) can be finished before the client gives up the web transaction.
One of our companion work on DDoS defense is a web-server-based DDoS mitigation scheme [24]. By employing a cryptographic cookie-based [16] HTTP redirection tech-nique, it is able to provide service to a large percentage of legitimate clients, even during severe DDoS attacks. The technique is able to protect almost all the traffic in a le-gitimate web transaction from DDoS attacks, except for its very first TCP SYN packet. As shown in [24], the effec-tiveness of the technique is constrained by (i.e., as an in-creasing function of) the “success rate” of this SYN packet. Since the proposed scheme is able to significantly enhance this success rate, it can further improve the effectiveness of the web-server-based mitigation technique considerably.
In summary, although the proposed scheme alone may not be sufficient for maintaining normal quality of service during heavy attacks, it becomes very effective when used in combination with other DDoS defense techniques.
7. Related Work
Internet Denial of service incidents started to be reported frequently after 1996 [12]. The most popular type of DoS attack is the TCP SYN flood attack [6], and cryptographic [16, 14] and noncryptographic [20, 13] solutions have been proposed. Recent large-scale distributed DoS attacks have drawn considerable attention [11]. Most of the proposed so-lutions focus on IP traceback [3, 5, 8, 19, 22, 9, 21], that is, to trace the origin(s) of an attack. Their common approach (except [5, 21]) is to require upstream routers to write, with a certain probability, a mark into a very-infrequently-used IP header field. The mark is an encoding of the identity of an intermediate router or edge. Upon the receipt of the packets from attackers, the victim decodes the marks to re-construct the node/edges that the packets have traversed. While the traceback schemes are valuable in finding the ex-act location of the attacker and (hopefully) punishing the
hacker after the attack, they are in general not able to miti-gate the effect of a DoS attack while it is raging on.
Techniques to mitigate the effect of distributed DoS at-tacks have been proposed in [17], [15], and [25]. The type of DDoS attacks targeted in [15] is that attackers send bogus traffic aggressively using their real IP addresses. Their tech-nique is to isolate traffic sent by aggressive IP addresses, from other traffic sources. However, this scheme is vul-nerable to the forms of DDoS attacks in which source IP addresses are spoofed. Schemes in both [17] and [25] use router throttles to allocate the victim bandwidth equally (in [17]) or in a min-max fashion ([25]) among perime-ter rouperime-ters. The drawback of these schemes is that since none of them can distinguish between traffic from legitimate clients and DDoS traffic, the improvement in the through-put of legitimate traffic may be small when the DDoS traf-fic “contaminates” the incoming traftraf-fic mix at the perimeter routers evenly. In comparison, the proposed scheme will perform much better, given the same topology and perime-ter radius8, than these schemes, since it is able to make such
a distinction.
Other proposals attack the DoS problem by calling for the tightening of “global security.” Ingress filtering [10] at every ISP is recommended to detect and drop packets sent using spoofed IP addresses. It is unclear whether these schemes are likely to be practical in the near future since they require global cooperation. Park [18] proposes to in-stall packet filters at autonomous systems in the Internet to filter packets traveling between them. It is shown in [18] that when 20% of strategically chosen autonomous systems install such filters, most of the packets with randomly gener-ated IP address (usual sense of IP spoofing) can be dropped. However, this requires the cooperation of thousands of au-tonomous systems, every ingress/egress router of which has to install the filter. Nevertheless, the attacker can still spoof IP addresses, albeit within a much smaller domain (e.g., a few autonomous systems).
8. Conclusions
This paper presents IP-traceback-based preferential packet filtering, a novel scheme to defend against Internet DDoS attacks. It leverages on the “attack graph” tion obtained through IP traceback, and uses such informa-tion to preferentially filter out packets that are more likely to come from attackers. Our simulation studies based on real-world Internet topologies demonstrate that the scheme is very effective in improving the throughput of legitimate traffic during DDoS attacks. The operations required of routers (probabilistic marking) are fully in line with the op-erations of IP traceback, making the scheme as practically deployable as possible.
8Note that the perimeter radius size for the scheme proposed in [25] for
the scheme to be effective is much larger (e.g., 8) than the typical radius for our scheme to be effective (e.g., 1+)
References
[1] Akamai technologies inc. http://www.akamai.com/.
[2] CAIDA’s Skitter project web page. Available at http://www.caida.org/Tools/Skitter/.
[3] S. Bellovin. Internet Draft: ICMP Traceback Messages. Technical report, Network Working Group, Mar. 2000.
[4] B. Bloom. Space/time trade-offs in hash coding with allowable er-rors.Communications of the Association for Computing Machinery, 13(7):422–426, 1970.
[5] H. Burch and B. Cheswick. Tracing anonymous packets to their approximate source. InProc. Usenix LISA 2000, Dec. 2000. [6] CERT. TCP SYN flooding and IP spoofing attacks. Advisory
CA-96.21, Sept. 1996.
[7] B. Cheswick. Internet Mapping. Available at http://cm.bell-labs.com/who/ches/map/dbs/index.html, 1999.
[8] D. Dean, M. Franklin, and A. Stubblefield. An algebraic approach to ip traceback. InProc. NDSS 2001, pages 3–12, Feb. 2001. [9] T. Doeppner, P. Klein, and A. Koyfman. Using router stamping to
identify the source of IP packets. InProc. ACM CCS-7, pages 184– 189, Nov. 2000.
[10] P. Ferguson.Network Ingress Filtering: Defeating Denial of Service Attacks Which Employ IP Source Address Spoofing. RFC 2267, Jan. 1998.
[11] L. Garber. Denial-of-Service attacks rip the Internet. IEEE Com-puter, 33(4):12–17, Apr. 2000.
[12] J. Howard. An Analysis of Security Incidents on the Internet. PhD thesis, Carnegie Mellon University, Aug. 1998.
[13] C. Inc. TCP SYN Flooding Attack and the FireWall-1 SYNDe-fender. Available at http://www.checkpoint.com/products/firewall-1/syndefender.html, 1997.
[14] A. Juels and J. Brainard. Client puzzles: A cryptographic counter-measure against connection depletion attacks. InProc. of NDSS’99. Internet Society, Mar. 1999.
[15] F. Kargl, J. Maier, S. Schlott, and M. Weber. Protecting Web Servers from Distributed Denial of Service Attacks. InWWW-10, May 2001.
[16] P. Karn and W. Simpson. Photuris: Session-Key Management Pro-tocol. IETF RFC 2522, Mar. 1999.
[17] R. Mahajan, S. Bellovin, S. Floyd, J. Ioannidis, V. Paxson, and S. Shenker. Controlling high bandwidth aggregates in the network. Technical report, ACIRI and AT&T Labs Research, Feb. 2001. [18] K. Park and H. Lee. On the Effectiveness of Route-Based Packet
Filtering for Distributed DoS Attack Prevention in Power-Law In-ternets. InProc. ACM Sigcomm’2001, Aug. 2001.
[19] S. Savage, D. Wetherall, A. Karlin, and T. Anderson. Practical net-work support for IP traceback. InProc. ACM SIGCOMM 2000, pages 295–306, Aug. 2000.
[20] C. Schuba et al. Analysis of a Denial of Service Attack on TCP. In
Proceedings of the 1997 IEEE Symposium on Security and Privacy. IEEE Computer Society Press, 1997.
[21] A. Snoeren, C. Partridge, et al. Hash-Based IP Traceback. InProc. ACM Sigcomm’2001, Aug. 2001.
[22] D. Song and A. Perrig. Advanced and Authenticated Marking Schemes for IP Traceback. InProc. Infocom 2001, Apr. 2001. [23] M. Sung and J. Xu. Ip traceback-based intelligent packet filtering: A
novel technique for defending against internet ddos attacks. Techni-cal Report GIT-CC-02-44, College of Computing, Georgia Institute of Technology, Aug. 2002.
[24] J. Xu and W. Lee. Sustaining Availability of Web Services under Severe Denial of Service Attacks.IEEE Transaction on Computers, special issue on Reliable Distributed Systems, Feb. 2003. to appear. [25] D. K. Yau, J. C. Lui, and F. Liang. Defending Against Distributed Denial-of-Service Attacks with Max-min Fair Server-centric Router Throttles. InProc. of IEEE IWQoS, May 2002.