Michael E. Brown. Examining Possible Relationships Between Sense of Community, Community Attachment, and Information Sharing Within an Urban Neighborhood. A Master’s Paper for the M.S. in IS degree. March, 2011. 77 pages. Advisor: Deborah Barreau
A survey of an urban neighborhood in Durham, NC, attempted to discern the residents’ current information sharing and receiving preferences and investigate possible
associations in terms of their self-reported sense of connectedness to the community. Direct contacts with neighbors were found to be the most-used channels for receiving and sharing information, with the neighborhood listserv the next most-used, confirming findings from previous everyday life information-seeking (ELIS) studies. One of the findings showed that residents who scored highly on the Brief Sense of Community Scale (BSCS) were more willing to share and receive community-related information and participate in community activities, whereas the community attachment measure was inconclusive.
Headings:
Community informatics
Community resources – Information services Information retrieval – Social aspects
INFORMATION SHARING WITHIN AN URBAN NEIGHBORHOOD.
by
Michael E. Brown
A Master’s paper submitted to the faculty of the School of Information and Library Science of the University of North Carolina at Chapel Hill
in partial fulfillment of the requirements for the degree of Master of Science in
Information Science.
Chapel Hill, North Carolina March 2010
Approved by
Table of Contents
Introduction... 3!
Background of study ... 5!
Literature Review... 8!
Overview... 8!
Sense of Community (SOC) ... 8!
Community Attachment... 12!
Information Sharing ... 15!
Conclusion ... 18!
Method ... 21!
General Description and Justification... 21!
Study Population... 23!
Data Collection Instrument ... 25!
Procedure ... 29!
Ethical issues... 31!
Results... 32!
Participation ... 32!
Information Sources and Sharing... 32!
Community Attachment... 39!
Bondedness ... 39!
Rootedness ... 41!
Sense of Community... 44!
Community Measures and Information Sharing... 50!
Qualitative Comments ... 54!
Discussion ... 57!
Information Channels and Sharing Information ... 57!
Community Attachment... 61!
Sense of Community... 63!
Other Results... 64!
Limitations of Study ... 66!
Future Research ... 68!
References... 70!
Appendix A: Survey Instrument ... 73!
List of Tables
Table 1. Riger and Lavarkas’s community attachment typology... 14!
Table 2. Interest in receiving or sharing neighborhood information... 32!
Table 3. Channels for receiving neighborhood information... 34!
Table 4. Count of information sources respondents use... 35!
Table 5. Channels used by respondents to share information... 36!
Table 6. Count of channels used to share information... 37!
Table 7. Attendance at community events in the previous 2 years... 37!
Table 8. Do you receive the neighborhood newsletter... 38!
Table 9. If you receive the newsletter, do you read it... 38!
Table 10. Does your household include a computer... 39!
Table 11. Does your household have Internet or broadband access... 39!
Table 12. Is it easy or difficult to identify strangers from residents... 40!
Table 13. Do you feel a part of the neighborhood... 41!
Table 14. Length of residence in the community... 42!
Table 15. Own or rent... 43!
Table 16. Do you expect to live in the neighborhood two years from now... 44!
Table 17. Summary responses to the BSCS items... 49!
Table 18. SOC measures, grouped... 50!
Table 19. Summary table showing means of SOC values for each of the Question 2 responses... 53!
Table 20. Analysis of variant result test showing SOC and responses to willingness to share information... 53!
Table 21. Comparison of SOC by Information Interest (Scheffe)... 54!
List of Figures Figure 1. Morehead Hill district, lightly shaded within the dotted lines. ... 6!
Figure 2. Morehead Hill boundaries from Durham City Neighborhood Improvement Services. ... 24!
Figure 3. Channels for receiving neighborhood information... 33!
Figure 4. Number of sources respondents use to gather neighborhood information ... 35!
Figure 5. Channels used by respondents to share information ... 36!
Figure 6. Length of residence in the community ... 42!
Figure 7. Sense of Community—Needs Fulfillment ... 45!
Figure 8. Sense of Community—Membership ... 46!
Figure 9. Sense of Community—Influence ... 47!
Figure 10. Sense of Community—Emotional Connection ... 48!
Figure 11. Graph of SOC measures ... 50!
Figure 12. Length of residence fitted to SOC measurement... 51!
Figure 13. Those who attend community events tend to have higher SOC scores... 51!
Introduction
The fields of sociology and community psychology employ a measure of sense of
community (SOC) to gauge the residents’ or members’ feelings of belonging or
attachment to a community, whether that community is virtual (an online forum) or
geographic (a neighborhood, an office). However, SOC is not a common feature of
information science (IS) research. Likewise, although IS has pioneered the idea of
everyday-life information seeking in a variety of contexts, researchers in other fields do
not tend to study information sharing as an explicit behavior in networks or communities.
Many journals and published articles related to community and belonging arise
from the fields of community informatics, community psychology, sociology, and even
criminology. Much of the literature surveyed for this study originated from the
community studies and community psychology fields. The concerns there include such
issues as community satisfaction, the sense of community at both individual and group
levels, and similar issues that gauge a resident’s “sense of belonging” to a neighborhood
and how that variable affects such aspects of life and psychology as well-being, security,
social control, political activity, and many other effects.
For its part, the IS community has conducted research on how individuals and
communities (both spatial and virtual) seek information; research by Wellman et al.
(1988) on personal networks and information seeking is a primary source for ways in
However, there is little published research on how information is shared as a
primary activity throughout a physical neighborhood. The study by Wellman et al. (1988)
started with a neighborhood but redefined community toward the idea of a “personal
network,” thus eschewing geography. Information and knowledge sharing have been
explicitly studied in specific communities (such as workplace studies), but the mechanics
and attitudes that encourage information sharing in neighborhoods have not been
examined in detail in IS or community studies. The field of community informatics has
some relevance to social and cultural development within communities, however its
predominant feature is the use of information and communication technologies to support
that development, and this aspect of community informatics was not a primary concern
for the current study.
The study’s primary research question, primarily a descriptive one, asked how
residents choose to seek or share neighborhood-based information within a
geographically-delimited community. The secondary research question asked whether
there is an association between an individual’s sense of connectedness to their
community and their behavior in seeking or sharing that information. The study used
accepted instruments to measure SOC and community attachment, and compared those
measures to answers on multiple-choice questions related to information sharing and
community involvement.
An assumption of this study was that residents with a strong sense of connection
to their neighborhood would want to know more information about the neighborhood,
thus exhibiting a higher level of community involvement. This involvement could be
An important conceptualization for this study is the idea of “community.”
Wellman et al. (1988) redefined community for the purposes of their study from a
place-based idea to one of “personal networks,” and Kasarda and Janowitz (1974) also opted to
define community as “an ongoing system of social networks” (p. 330). These meanings
adhere to the relational idea of community, as defined by Gusfield (1975), wherein
relations and similarities are more important than geographical location. Gusfield (1975)
also defined the territorial idea of community, as in neighborhoods, but held that the
relational dimension must also be present. The researcher chose to define the community
under study geographically, as the Morehead Hill neighborhood district, and then
attempted to survey, albeit at a high level, the relational aspects that dwell within it.
Background of study
The study was prompted by a series of burglaries that hit the Morehead Hill
neighborhood of Durham, North Carolina, in the spring of 2008. A series of historic
neighborhoods rings downtown Durham, with Morehead Hill situated to the south and
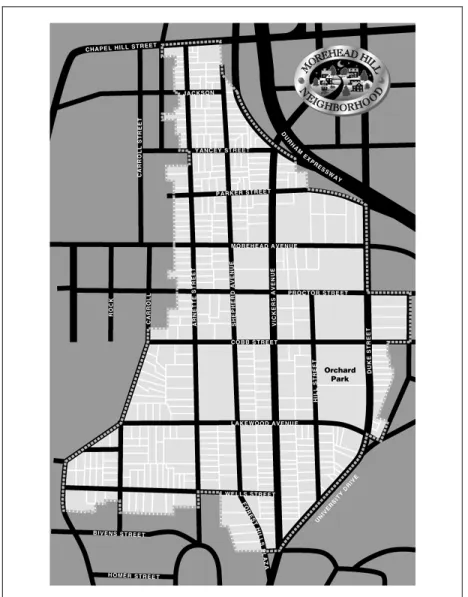
slight east of downtown, about a mile from the city’s center. Figure 1 shows a map of the
neighborhood and its boundary lines; the MHNA board provided the map.
What made the crimes particularly disturbing to the residents was their daring—
many of the burglaries occurred during the daylight hours with the residents in the house.
As a result, residents feared for their families’ safety and sought ways to communicate
with the police and with each other about unusual occurrences. Strangers and unfamiliar
vehicles that residents observed in the neighborhood were reported via the neighborhood
listserv—a Yahoo Groups mailing list (http://groups.yahoo.com/group/moreheadhill/)—
(http://groups.yahoo.com/group/pac3), which communicates with all neighborhoods in
the PAC 3 area.
Figure 1. Morehead Hill district, lightly shaded within the dotted lines.
However, a problem faced by the neighborhood was that, for immediate news
dissemination, the Yahoo Groups mailing list did not prove sufficient. According to the
Morehead Hill Neighborhood Association (MHNA) board, there were 455 households
officially designated as falling within the Morehead Hill district. As of February 2009,
there were about 80 email addresses on the list; in February 2011, there were 183
number of households represented on the listserv, because many households are
represented more than once—for example, in the cases of spouses and roommates.
Clearly, if emergency news needed to be disseminated to the community quickly, the
email list was not enough as it only reached a fraction of the community.
The MHNA board, on which the researcher sits as an at-large member, wanted to
know how residents shared information of community interest and how residents
preferred to receive that information. It was from this impulse that the current study was
Literature Review
Overview
Several concepts are key to the design of this study. Chief among them are sense
of community (SOC) and community attachment, two indicators of social capital and
cohesion. They are frequently used in such research areas as community psychology,
criminology, urban and rural studies, health and human services delivery, and so on. Both
concepts have a long history marked by strong theoretical models that have spurred
further research and empirical studies to prove both the validity and reliability of both the
theoretical models and the instruments used to measure them. SOC and community
attachment are deployed as variables to test their relationship to a variety of other
variables, such as environmental awareness, social control, crime prevention, and
psychological well-being.
Clarifying these ideas’ conceptualizations and especially how they can be
operationalized in a reliable and valid way remains a constantly evolving research topic.
Because these conceptual measures anchor the study by serving as the chief independent
variables, understanding the ongoing debate and research over what they mean and what
they measure is crucial.
Sense of Community (SOC)
The theoretical foundation for SOC was laid down by McMillan and Chavis
(1986) and has remained a common starting point for SOC measures and considerations.
McMillan and Chavis (1986) offered a one-sentence definition of the concept: “Sense of
to one another and to the group, and a shared faith that members’ needs will be met
through their commitment to be together” (Wright, 2004). They also proposed that SOC
was composed of four dimensions:
• Membership
• Bidirectional influence (the individual can influence the community and vice
versa)
• Integration and fulfillment of needs • Shared emotional connection
Despite the four underlying dimensions, SOC is typically measured and analyzed
as a single calculated number. Townley and Kloos (2009) summarized the studies in
which SOC has been associated with the following characteristics: length of residence,
neighboring, and community satisfaction; political participation; safety; loneliness; life
satisfaction; and mental health symptoms.
A theory behind SOC is that shared emotions, interests, and concerns can spur
residents to participate in both formal planning and informal neighboring behaviors (Xu
et al., 2010). “Neighboring behaviors” are defined as “informal mutual assistance and
information sharing among neighbors” (Perkins and Long, 2002).
Several measures grew out of the McMillan and Chavis (1986) research: the
Sense of Community Index (SCI) designed by Chavis, Hogge, McMillan, and
Wandersman (1986), the Brief SCI (BSCI) by Long and Perkins (2003), and the Brief
Sense of Community Scale (BSCS) by Peterson, Speer, and McMillan (2008). The goal
of each measurement instrument has been to create a compact, well-validated tool that
could be used quickly, conveniently, and unambiguously in a variety of settings and
environments. However, aligning each instrument’s sets of questions and responses to the
It is perhaps startling to note that, until the Peterson et al. (2008) study, the SOC’s
underlying model of dimensionality—despite its ongoing use and popularity—had never
been empirically confirmed. In fact, the latter study suggested that the underlying
dimensionality did exist and so could be measured, but that problems identified in
previous studies were due to poor measurement. Nevertheless, theoretical differences still
persist. Mannarini and Fedi (2009) summarized several conflicting impressions of SOC
based on their literature review: that the SOC is a multidimensional construct whose
dimensions are still unknown, that it should be considered a continuum rather than a
state, that it should be considered in light of such factors as community size and location,
and so on. Even with its underlying four dimensions, the SOC has prevailed largely as a
unidimensional instrument, best used for measuring overall SOC but with untested
validity beyond that (Peterson et al., 2008).
The Sense of Community Index (SCI) instrument was designed by Chavis (n.d.)
to evaluate an individual’s sense of community. It consisted of 12 true or false statements
aligned along the four dimensions. A sample question would be “I think my [block] is a
good place to live.” The instructions to the SCI recommended replacing “block” with
school, church, workplace, or any other specific referent, except “community” (Chavis,
n.d.). The SCI as a SOC measurement underwent consistent critique and revision in an
effort to yield a consistent and reliable instrument that reflected all of the dimensions of
the still-influential McMillan and Chavis (1986) model. Long and Perkins (2003)
analyzed the data from which the original SCI was developed and concluded that the SCI
did not accurately reflect SOC’s underlying dimensions. They found poor fit for both
Clearly, although the SOC remained a powerful and pervasive concept, its
operationalization also remained an ongoing source of frustration and debate. In
response, Long and Perkins (2003) created their own Brief SCI (BSCI), reducing the
number of questions from 12 to eight and the number of dimensions from four to three
(community values, social connections, and mutual concerns). A further suggested
improvement was replacing the true/false format with a 5-point Likert-type scale to
improve response. Although the BSCI yielded favorable results, its disadvantage was the
shift from four to three dimensions, thus losing adherence to the underlying SOC model.
Peterson et al. (2008) worked with McMillan (principal author of the SOC
theoretical model) to define a new Brief Sense of Community Scale (BSCS) to better
represent the four-dimension model and to empirically test its efficacy against other
independent measures of the underlying dimensions. The researchers created eight
positively worded items (such as “I belong in this neighborhood”) and used a 5-point
Likert-type format ranging from “strongly agree” to “strongly disagree.” The study used
confirmatory factor analysis to “provide empirical support for the BSCS and its
underlying multidimensional theory of SOC” (Peterson et al., 2008, p. 61). They
concluded that previous researchers’ difficulties with SOC and SCI were based on
measurement problems rather than theory.
The conclusions of this latter study and the BSCS itself proved simple enough to
make the BSCS the essential measurement tool for the current study. It should be noted,
however, that Peterson et al. (2008) recommended further testing of the BSCS to
establish its efficacy and also “assert that specific operational definitions of SOC will
Midwestern neighborhood residents, the study authors recommended modifying the
BSCS to suit the test population, such as for specifically elderly or young populations in
other parts of the country or countries. For the Morehead Hill study, all but one of the
BSCS items were unchanged (see “Data Collection Instrument” on page 25 for more
information on the study instrument).
Community Attachment
Akin to SOC is the idea of “community attachment”—an individual’s feeling that
he or she “belongs” to a community—and it shares with SOC a history of constant
redefinition of its concept and measures. Although the BSCS provides a measurement
tool for the current study, community attachment provides a supporting or alternative
measure of validity and reliability.
The classic study on community attachment is by Kasarda and Janowitz (1974), in
which they assessed attachment by the measures of “feel at home,” “interest in the
community,” and “sorry to leave” (Cross, 2004, p. 3). As with the SOC, there is ongoing
research into what these concepts mean and how they can be reliably measured.
Kasarda and Janowitz (1974) used secondary data that measured community
attitudes and sentiments, local friendship and kinship bonds, and respondents’ activity in
local community associations. Length of residence was considered a quasi-independent
variable, along with population density, socioeconomic category, and other criteria.
While the researchers did not suggest that length of residence was the only variable
affecting attachment, they concluded that it is “the key exogenous factor influencing local
community attachment” and that “whether a personal feels a sense of community is
clearly a function of length of residence” (Kasarda and Janowitz, 1974, pp. 334-335). It is
the SOC model did not include such a stark quantitative measure among its
multidimensional elements.
Length of residence as an indicator could be affected by such factors as income
(higher-income individuals tended to view the community as a real home more than
low-income), education (less educated individuals tended to view the community as a real
home more than highly educated), and age (younger individuals start with low attachment
and gain it quickly over the years, whereas older individuals started with a higher
attachment that increased more slowly) (Theodori, 2004).
Kasarda and Janowitz (1974) defined a local community systemically as “an
ongoing system of social networks into which new generations and new residents are
assimilated, while the community itself passes through it own life-cycle” (p. 330). The
Morehead Hill neighborhood would fit this description of a “local community” and the
question “How long have you lived in the neighborhood” served as the simplest and most
straightforward measure of community attachment, as defined in this way, in the survey
instrument.
Riger and Lavrakas (1981), also writing before McMillan and Chavis (1986),
investigated the impact of neighborhood crime on residents. Their secondary factor
analysis of previously collected survey data indicated that rootedness in the neighborhood
and social bonding were the two factors under investigation. The “rooted” questions
asked how many years the respondent had lived in the neighborhood, did they own or
rent, and did they expect to live there two years from now. The “bonded” questions asked
and could respondents identify neighborhood children by name (along a scale of all,
some, hardly any, or none).
From these results, the researchers posited four classes of residents, including
their likely attitudinal and behavioral preferences, which are summarized in Table 1.
Table 1. Riger and Lavarkas’s community attachment typology
High-Bonded Low-Bonded
High-Rooted
Established Participants—Older adults with children at home, more active in neighborhood than Isolates. Likely chosen to
permanently reside in their home.
Isolates—Older adults, less likely to have children, low or no involvement in the neighborhood.
Low-Rooted Young Participants—Less educated young adults with families. Likely to be permanent residents. More likely to pay attention to neighborhood problems.
Young Mobiles—Well-educated young adults without families. Temporary residents rather than permanent. Least likely to pay attention to neighborhood problems.
Although Riger and Lavrakas (1981) do not provide direction on how to
implement the six questions (as their study was a secondary analysis), values could
perhaps be intuited. For example, a respondent who can easily identify a stranger, know
children’s names, has lived in the neighborhood for 20 years, and owns their own home
could be expected to fall into the high-rooted and high-bonded category. Given the
simplicity of the questions and their usefulness in determining rooted and bonded
tendencies, these questions (with one exception) were included in the Morehead Hill
survey.
As with the SOC concept and measures, there are similar frustrations with the
community attachment conceptualization and there is a desire to make its measure
multidimensional and not bound solely to the length of residence. A multidimensional
no such measure has emerged in common use among researchers, and so the standard
unidimensional measure of community attachment has persisted.
Despite the ongoing debate over two such widely used and respected—yet still
evolving—concepts as SOC and community attachment, the studies agree that their
measures offer good reliability and validity. While the simpler measures of community
attachment may not express rich data, they proved acceptable for the Morehead Hill
study. For this study, the BSCS served as the SOC measure and the length of years
residence in Morehead Hill served as the community attachment measure. The Riger and
Lavrakas (1981) items were also used: the questions were simple and direct, were
relatively easy to score, and provided another method of gathering more data on the
respondents’ sense of community life in their neighborhood.
Information Sharing
An assumption of this study was that a sense of community or attachment in a
neighborhood would make a resident more inclined to receive and share information of
local interest. This assumes that each person has his or her own personal network or
networks of friends or neighbors on whom they can call, which leads to the information
science concept of everyday life information seeking (ELIS). Agosto and Hughes-Hassell
(2005) noted that participants in previous ELIS studies “turned first to human sources
when seeking everyday life information” (p. 143), and this was confirmed in their study
of urban teenagers’ ELIS behavior.
The articles describing the East York neighborhood studies (Wellman et al., 1988;
Wellman and Wortley, 1990) decoupled the idea of community from neighborhood,
given that modern communication and transportation had eliminated geography as a
Their studies focused, within an individual’s “personal communities,” on the “informal
links of companionship and aid between individuals” (Wellman, et al., 1988). Because
people had the resources to live anywhere yet still maintain their social ties, relationships
could instead be based on “affinity, not proximity” (Riger and Lavrakas, 1981, p. 56).
Given that the prompt for the Morehead Hill study was a crime wave and a perceived
need to share information with residents across the entire geographical spread of the
neighborhood, then understanding how aid is given—in the form of information sent and
received—is an area of interest for both community and information studies.
Fisher, Naumer, Durrance, Stromski, and Christiansen (2005) found that although
people still referred to other people as their primary information source, Internet use was
increasing, especially among younger people, men, and higher-income individuals. The
Morehead Hill’s Yahoo listserv under-represents the number of households in the
neighborhood as membership is limited to those who have a computer and internet
access, whether at home, work, or some other location. Messages on the Morehead Hill
listserv have indicated that some posts are made for neighbors who do not have or use a
computer, so in those cases, primary contact with a neighbor to receive or share
information is important.
During the multi-year East York studies of a residential neighborhood in the heart
of Toronto, the researchers eventually realized that, even though residents did not meet in
public places or front porches, they still had an active network of informal links that
offered companionship and help when called upon. The researchers reframed the concept
of community from a place-based idea (as in the community attachment studies) to one of
households into social structures” independent of geography (Wellman et al., 1988, p.
131).
The study began with a random, closed-ended questionnaire/survey of 845 East
Yorkers in 1968. The researchers refocused in 1978 on a subsample of 33 and conducted
extensive, 10-hour+ interviews. In terms of length of residence, it should be noted that
the 33 people interviewed in 1978 had moved out of East York. Because the researchers
were more interested in the subjects’ network ties to their personally identified
communities (through kin and friendship, for example), neither sense of community nor
community attachment appear as variables of interest.
However, while neighbors made up the majority of subjects’ “routine ties,” they
were not “intimate” relationships. Neighbor relationships tended to be woman-to-woman
or couple-to-couple, with about 10 of the subjects isolated from their neighbors “to
preserve privacy and autonomy” (Wellman et al., 1988, p. 143). This finding appeared to
echo the Riger and Lavrakas (1981) typology of residents characterized as “established
participants” and “isolates.”
On giving and receiving aid, the researchers observed that “East Yorkers who do
not receive much aid also do not give out much of it” and “East Yorkers who are active
senders of aid also tend to be active receivers” (Wellman et al., 1988, p. 171). For the
latter group, such Golden rule behavior was considered “a central moral tenet” (Wellman
et al., 1988, p. 171). In any case, the researchers concluded that the residents maintained
specialized networks for specialized support. Bondedness, then, rather than rootedness,
still exist but were relegated to “networks of necessity” (Riger and Lavrakas, 1981, p.
56).
If the presence of personal communities is assumed, how then do people find
information when they need it? One source of research on this question can be found in
the ELIS literature. Agosto and Hughes-Hassell (2005), in their review of the primary
studies up to that time, made the point that several studies showed “human sources of
information to dominate ELIS patterns” (p. 143). Their study confirmed that, for urban
teenagers, people are their “preferred information source” (Agosto and Hughes-Hassell,
2005, p. 162).
Further information on people’s ELIS behaviors was reported by Fisher et al.
(2005), who studied the information habits of over 600 residents of East King County,
Washington, as part of a United Way telephone survey to gauge health and human
services needs. Of the approximately 50 questions, seven dealt with information habits.
The study found that most people turned either to someone with whom they had a strong
relationship or the Internet, with younger people, men, and higher-income individuals
favoring the Internet. The study’s data indicated that the Internet “is displacing the
long-standing tradition of the strong-tie, interpersonal source” (Fisher et al., 2005).
Conclusion
Despite ongoing debate about the concepts that lie behind them, SOC and
community attachment remain powerful and useful constructs. For SOC, particularly, the
measuring instrument is simple to implement and has proven reliable in many studies and
across different environments and audiences. The BSCS is the preferred instrument and
Lavrakas (1981) study of community ties, which carry with them dimensions of
bondedness and rootedness.
Because SOC has been frequently used to find associations with other individual
and community behaviors, it seemed reasonable to use the concept to inquire about a
neighborhood’s information-sharing behavior.
The personal communities studies showed that networks probably already exist in
the Morehead Hill neighborhood, that there might be more activity happening than is
visible on the surface, and that those networks can exist effectively even without strong
social bondedness or physical rootedness. The concept of “personal communities”
indicated that a resident can have many different kinds of relationships, each tuned to a
special need. An implication for this study, then, was that a resident could have
corresponding and varying “senses of community” for each type of community they
participate in. Crime information, for example, may be passed along through a different
type of network than would an invitation to a block party, for example. The current study,
unfortunately, did not delve into that level of detail, which may have affected responses.
It is tempting to draw a line from the East York personal network studies to ELIS
studies indicating that people remain primary information resources. But just as the East
York studies sit uneasily beside place-based theories like community attachment, they
also sit uneasily beside ELIS, particularly the Fisher et al. (2005) information grounds
model. The information grounds concept is a place-based theory, while the Wellman et
al. (1988) personal network studies eschew the geographically delimited idea of a
community requiring a physical location beyond one’s private home. In other respects,
Golden Rule of information exchange has potential to align with the Riger and Lavrakas
Method
General Description and Justification
The study surveyed all Morehead Hill neighborhood residents. The survey was
delivered on paper to each home in the district and was self-administered by the
respondents. All questions were closed-ended, except for the last question, which was
open-ended.
Babbie (2007) described survey research as “probably the best method” for
gathering data from a population “too large to observe directly” and that surveys are
“excellent vehicles for measuring attitudes and orientations in a large population” (p.
244). In the case of the Morehead Hill community, given its size and geographic spread, a
self-administered questionnaire seemed the most economical and fair way to poll
residents on their beliefs and behaviors. The cost and time expenses of interviewing the
members of each dwelling individually, either in-person or via a telephone survey, would
have been prohibitive.
Given the ease of use of online surveys, it is reasonable to ask why an online
survey or a combination of online/paper was not implemented. In the case of an online
survey, a basic requirement would be that the respondent have, or have access to, a
computer and an Internet connection. Morehead Hill is an economically heterogeneous
neighborhood and there was no guarantee or solid knowledge that the majority of
households had access to a computer or Internet services; implementing an online-only
have a computer and Internet access, it was not certain that they knew whether the
neighborhood listserv existed, which is how prospective subjects would have been
contacted. For these reasons, an online-only approach was rejected.
In the case of a combined online/paper survey, that choice was discarded
following a consultation with Teresa Edwards of the Odum Institute for Social Science
Research in September 2010. Edwards pointed to research conducted by Messer and
Dillman (2010), which showed survey response declined when both online and paper
options were offered, but response rose when only one method (either online or paper)
was used. Based on this reasoning, the researcher opted for a paper-only questionnaire.
Fisher et al. (2005) reviewed the literature regarding surveys and questionnaires
and noted that there are fewer large-scale (over 500 respondents) surveys than in the late
1970s through the early 1990s, implying that those survey results are also aging and
perhaps growing dated. The Morehead Hill study did not pretend to achieve the coverage
of a fully planned and funded large-scale study; however it did attempt to a modestly
scaled study that could be economically administered by a single researcher.
Current information behavior research goes deep with qualitative methods rather
than broad, while large-scale surveys sacrifice “the ability or opportunity to focus
in-depth and explore emergent phenomena” (Fisher et al., 2005). The Morehead Hill study
was weighted more heavily perhaps to the quantitative, with its blend of SOC and
community attachment measures, than the qualitative.
The suggestions by Babbie (2007) for item wording and layout—items should be
short, positively worded, relevant, and attractively laid out to reduce ambiguity and
self-administered questionnaires, he recommended beginning with “the most interesting set of
items” and then finishing up with the more mundane demographic items (Babbie, 2007,
p. 256). Teresa Edwards of Odum and the MHNA board were consulted about the
instrument and made several suggestions on questions to include/exclude, wording, and
layout. Members of the MHNA board particularly stressed the need to keep the survey
brief and able to be completed in 10-15 minutes.
Completion rates for surveys seemed to be higher when a research worker
hand-delivered the questionnaire or picked up the completed questionnaire than when the
survey was mailed (Babbie, 2007). For this study, the researcher hand-delivered the
questionnaires to all residences identified as being within the Morehead Hill boundary
lines. Self-addressed envelopes with prepaid postage were included in the survey package
so that respondents could complete and return the surveys at their convenience. The
researcher investigated the efficacy of mailing lists, but they were either too expensive or
incomplete (a mailing list received from the City of Durham’s Neighborhood
Improvement Services did not contain the researcher’s home address).
The study design was reviewed and approved by the IRB Committee (Study #
10-1914) in October 2010.
Study Population
The sampling frame included all households and apartments within the Morehead
Hill district, excepting places of business and vacant structures. Survey packages were
not delivered to homes where it was obvious that the house was vacant (for example, no
curtains on the window and empty rooms visible).
The researcher depended on two maps of the district to guide deliveries: one
the Durham City Neighborhood Improvement Services (Figure 2). Other information on
the neighborhood boundaries was obtained from its application for historic district status.
Figure 2. Morehead Hill boundaries from Durham City Neighborhood Improvement Services.
Although the two maps generally agreed as to the boundaries, the shaded area
within the Neighborhood Improvement Services map did not include the researcher’s
own home on the west side of Arnette Avenue. Therefore, the map created by the resident
was used as its shading included homes on both sides of streets, where applicable.
used as it clearly marked property boundaries along the street and enabled the researcher
to check off properties that had been visited.
Another issue related to the survey was the unit of analysis. The researcher could
count the number of packages distributed, which could indicate the number of potential
households that constituted the study sample. However, to count each household as the
unit of analysis could raise the issue of who in the household should respond to the
survey, or whether the questionnaire would represent the household’s combined opinion
or only a single opinion. Odum’s Teresa Edwards recommended that the unit of analysis
be the individual rather than the household; this allowed spouses, roommates, or partners
to answer the questionnaire individually and so possibly reflect different community and
information-sharing attitudes. In the researcher’s own household, for example, his wife
checks the neighborhood listserv messages daily, while he relies on his wife and emails
from other members of the association board to alert him to any pressing news. As a
result, the survey package included two copies of the questionnaire that could be
completed by more than one member of the household, such as spouses or roommates,
who may hold different attitudes toward community and information sharing.
Data Collection Instrument
The questionnaire (see Appendix A) contained 22 questions printed on one
letter-sized page, front-and-back. Its contents were a mix of established instruments, along with
questions contributed by the MHNA board and the researcher.
Consultation with Teresa Edwards of Odum and members of the MHNA board
led to the decision to keep the survey succinct and able to be completed in less than 10-15
room would be available for the study’s measurement instruments and for questions
inserted at the board’s request.
The researcher received approval from the MHNA to allow its letterhead to be
used on the survey and other materials; its inclusion imparted a sense of authenticity to
the survey request. Respondents were informed via the information sheet that, although
the MHNA did not solicit and was not responsible for the survey, the final results would
be shared with the MHNA board.
Questions 1 and 3 were discovery questions to discern the channels respondents
use to receive (#1) and share (#3) information about the community. Question 1 lists the
most common methods that a resident could receive information on the neighborhood,
while the shorter list for Question 3 reflects the channels a resident could use to share
information with others. Respondents could select as many sources or channels as they
wished.
Question 2 was invented by the researcher and asked if people were interested in
sharing information of neighborhood interest. The question is directed at the heart of the
study and provided a simple indicator of self-reported interests. Possible answers were
Yes, No, or Sometimes.
Questions 4-6 were suggested by Edwards (2010) as indicators of community
involvement that were more measurable than information sharing. Question 4 asked
whether the respondent had attended—yes or no—any community events in the previous
two years. Questions 5 and 6 were requested for inclusion by the MHNA board. The
questions asked whether the respondent has ever received the MHNA newsletter and, if
is hand-delivered by volunteers when a new issue is printed; however, some residents
have reported to the board in the past that they had not received any newsletters.
A footnote to Question 4, given that this survey was prompted by a crime wave,
was a finding that “the percentage of neighborhood residents who get together once a
year or more is the most powerful predictor of local crime rates,” more powerful than
even more frequent interactions (weekly or monthly) (Bellair, 1997, p. 692).
Questions 7 and 8 were drawn from the Riger and Lavrakas (1981) community
attachment instrument and they indicate social bondedness. Question 7 asked whether it
is easy or difficult for a resident to identify a stranger in the neighborhood; Question 8
asked whether the resident feels they are a part of the neighborhood or whether it is just a
place to live. “Easy” and “I feel I’m part of Morehead Hill” would indicate strong
bondedness. A third question from the original instrument—whether a resident knows the
names of children in the neighborhood—was not included with this survey, following
consultation with the MHNA board.
Questions 9-16 reproduce the Peterson et al. (2008) BSCS items to elicit a
combined SOC measure. The items were positively worded and aligned to the McMillan
and Chavis (1986) multidimensional concepts as follows:
• Questions 9-10: Needs Fulfillment • Questions 11-12: Membership • Questions 13-14: Influence
• Questions 15-16: Emotional Connection
A single change was made to one of the questions. For Question 14,
“communicating” replaced “influencing,” as communication seemed to be a key theme of
the study. However, this may have had the effect of unbalancing the question by
As recommended in the BSCS validation study, the items used a 5-point
Likert-type response format with options ranging from strongly disagree to strongly agree. Each
response was coded as follows:
Response Value
Strongly disagree 1
Disagree 2
Neither agree nor disagree 3
Agree 4
Strongly agree 5
Scores were averaged to create the SOC measure. A higher score indicated a
higher SOC.
Questions 17-19 reproduced the remaining Riger and Lavrakas (1981) community
ties questions. Where Questions 7-8 measured social bondedness, Questions 17-19
measured rootedness, by asking about the length of residence (in years and months),
owning (more rooted) versus renting (less rooted), and expectations of staying in the
neighborhood (more rooted if Yes, less rooted if No).
Question 17 generated a number that also related to community attachment. A
spreadsheet formula converted the years and months numbers into a single years variable.
As Kasarda and Janowitz (1974) noted, the length of residence in years is a key factor for
community attachment. However, while those researchers established length of residence
as an important variable, they never stated what they would consider to be a boundary
number, below or above which length of residence is a notable factor. As a result, the
final number would have to be considered relative to the other questions and the SOC
Questions 20 and 21 asked whether the respondent’s household included a
computer and Internet or broadband access. These questions were included at the request
of the MHNA board.
Question 22 was an open-ended question, offering the respondent an opportunity
to comment on any other feelings or thoughts they had about information sharing in
Morehead Hill or in response to the questionnaire. Selected excerpts from these responses
will be included as appropriate in the Results section.
Procedure
The overall goal for administering the survey was to make the process of
completing and mailing the questionnaire as easy as possible for the respondent. To that
end, the survey was succinct and composed primarily of closed-ended questions. Other
components of the process attempted to ensure that the survey was quickly and clearly
identified by potential respondents when it arrived at their doorstep and that their
completed survey could be mailed conveniently to the researcher.
A Carnegie Grant in the amount of $200 enabled the purchase of 500
business-sized #10 envelopes with pre-printed postage. The researcher then printed mailing labels
with his name and address and affixed the labels to both the sender and receiver locations
on the envelopes. The only thing respondents had to do after completing the survey was
put the completed questionnaire in the envelope, seal it, and mail it.
The survey was anonymous. The researcher was not able to link a completed
survey to a resident, except in those cases where the respondent wrote in their name,
address, or other identifying information. In those cases, the identifying information was
A survey package was assembled that included:
• A 9x12˝ manila envelope that held the following items.
• A cover sheet taped to the manila envelopes. The cover sheet included the
Morehead Hill logo, the text “Morehead Hill Neighborhood Survey,” and the due date, all in very large lettering.
• A business-sized #10 envelope with pre-printed postage. Each envelope bore a
sticker with the researcher’s name and address in both the addressee and sender locations.
• An information sheet describing the study, the respondent’s rights, and other
standard information. It also included the researcher’s name, address, and cell phone number.
• Two copies of the questionnaire.
The researcher assembled 400 survey packages. Using the Morehead Hill maps
provided, the researcher hand-delivered a survey package to each dwelling. The package
was inserted inside the front door or storm door, under a doormat, or was in some way
prominently placed where the resident would see it. For apartment dwellings, the
packages were delivered to the door, where possible; where this was not possible, the
packages were left near the apartments’ central mailboxes. It took 10 hours over two days
to deliver 362 survey packages.
Prior to delivery, the researcher posted an email to the neighborhood listserv
announcing the survey and encouraging participation.
The packages were delivered Nov. 8-9, with a due date of December 1. The intent
was to get the questionnaires into the hands of residents before the Thanksgiving and
Christmas holidays diverted their attention. The majority of responses were received in
the first two weeks following the questionnaire distribution, with some responses still
trickling in throughout December.
In January 2011, the questionnaires were entered into an Excel spreadsheet. A
codebook was developed to ensure consistency and to provide documentation. See
The statistical program Stata was used to analyze the data.
Ethical issues
The ethical issues related to this study primarily included protecting the privacy of
the participants involved. No identifiable information was collected as part of the survey.
However, some respondents did sign their names to the questionnaires; this information was
not included in the spreadsheet. The completed questionnaires will be destroyed after the
study and this paper have been completed.
The questions asked in the survey were not expected to engender any discomfort in
the participants; if this happened, though, the participants had the option to skip any question
Results
Participation
A total of 362 survey packages were hand-delivered to residences in the
Morehead Hill neighborhood district. Each package contained two blank questionnaires
and a return envelope. A total of 122 return envelopes were received, with some
envelopes containing two questionnaires. A total of 153 questionnaires were returned.
Following a review of the questionnaires, five were discarded because none of the
questionnaire items had been selected. A total of 148 wholly or partially completed
results were judged suitable for analysis.
Information Sources and Sharing
Of primary interest in this study was whether residents were inclined to share
information with the community. Question 2 asked whether residents were interested in
receiving or sharing information of neighborhood interest. Table 2 displays the summary
responses to this question.
Table 2. Interest in receiving or sharing neighborhood information
Information Interest Freq. %
No 9 6.16
Yes 90 61.64
Sometimes 47 32.19
Total 146 100.00
Of the responses received, only nine respondents (6.16%) answered that they
were not interested in information sharing, while almost a third of the respondents
(32.19%) indicated that they were sometimes interested in receiving or sharing
receiving or sharing information. Given the nature of the questionnaire, it is quite likely
that these respondents were over-represented in the survey.
Question 1 asked respondents to select all the sources of information they used
when searching for information about the neighborhood. Figure 3 summarizes the
responses, showing the total counts for each selection. For “Neighbor,” the item specified
“A neighbor, via phone, email, or face-to-face.”
Figure 3. Channels for receiving neighborhood information
A summary table with percentages is shown in Table 3. Personal contact of some
kind with a neighbor constituted a quarter of the responses (25.62%) with the
neighborhood listserv (18.16%) and the hardcopy neighborhood newsletter (11.19%) the
next most frequently accessed.
Several respondents circled the words “a neighbor,” along with one or more of
“phone,” “email,” and “face-to-face,” emphasizing their presumably preferred mode of
contact. For “Other,” two write-in responses cited a Durham area blog (“Bull City
drew a box labeled “None” and checked it, while another wrote “n/a—I don’t seek info
on [Morehead Hill].”
Another respondent wrote: “Our neighbor has a small group to whom she sends
relevant topics from MHNA, FHNA (Forest Hills Neighborhood Association), PAC3,
and others.” Other respondents reported they were previously unaware of some of the
Morehead Hill-only channels. An example:
The survey assumes residents know about communication pathways and the neighborhood association. I didn’t know about the [Facebook] page, website, and don’t know how to get onto the listserv.
One respondent wrote that they “just discovered the list service a few months ago
and have felt more connected by being part of it.”
Table 3. Channels for receiving neighborhood information
Source Sum %
Neighbor 103 25.62
Listserv 73 18.16
Newsletter 45 11.19
Newspaper 36 8.96
Search 32 7.96
Durham web sites 26 6.47
Web site 24 5.97
Facebook 19 4.73
TV 17 4.23
Radio 17 4.23
Other 10 2.49
Total 402 100.00
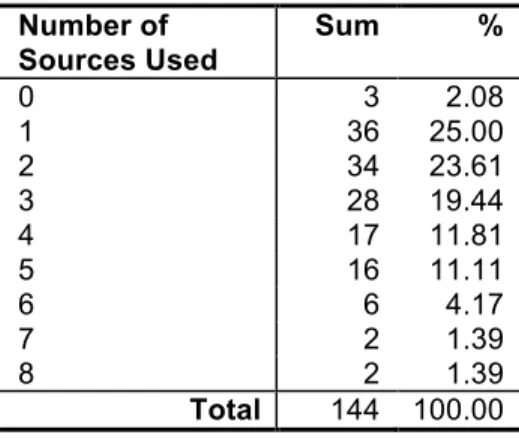
Respondents were able to choose more than one source. Figure 4 shows the
number of sources people used to gather neighborhood information. Table 4 presents this
information with percentages also. Nearly half of the respondents use one (25%) or two
(23.61%) sources to monitor or gather information of neighborhood interest, with a
sizable number (19.44%) monitoring three sources. Nearly the same number of
respondents used four or five sources (11.81% and 11.11%, respectively). Many fewer
accessing seven or eight sources (both at 1.39%). Three respondents (2.08%) left these
items blank.
Figure 4. Number of sources respondents use to gather neighborhood information
Table 4. Count of information sources respondents use
Number of Sources Used
Sum %
0 3 2.08
1 36 25.00
2 34 23.61
3 28 19.44
4 17 11.81
5 16 11.11
6 6 4.17
7 2 1.39
8 2 1.39
Total 144 100.00
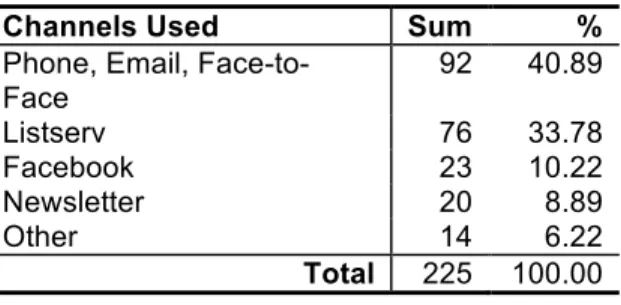
There are comparatively fewer channels for sending information: the items
provided were personal contact with neighbors (via phone, email, or face-to-face),
listserv, Facebook, newsletter, and other. Respondents could select more than one item.
Figure 5 presents this information as a graph, with Table 5 presenting sums and
Figure 5. Channels used by respondents to share information
Table 5. Channels used by respondents to share information
Channels Used Sum %
Phone, Email, Face-to-Face
92 40.89
Listserv 76 33.78
Facebook 23 10.22
Newsletter 20 8.89
Other 14 6.22
Total 225 100.00
As with sources used by respondents to gather information, personal contact with
neighbors (40.89%) (one respondent qualified this with “depends on the neighbor”) and
the listserv (33.78%) constituted the majority of the responses. The other channels used
to a much lower degree were Facebook (10.22%), Newsletter (8.89%), and Other
(6.22%).
Qualitative responses to this question echoed the concept of “personal
communities,” as some respondents revealed that their block or a group of neighbors had
their own listserv, phone tree, and so on. One respondent wrote: “My wife monitors the
Analogous to the count of information sources used, Table 6 shows the number of
channels used by respondents when sharing information. Over half of the respondents
(59.31%) used only one source to share information, while over a quarter of respondents
(29.66%) used two sources. Fewer respondents (a total of 10.35%) used more than two
sources when sharing information with fellow residents.
Table 6. Count of channels used to share information
Number of Channels Used
Sum %
0 1 .69
1 86 59.31
2 43 29.66
3 8 5.52
4 6 4.14
5 1 0.69
Total 145 100.00
Question 4, “Have you attended any community events in the last 2 years?” was a
relatively straightforward demographic question to measure participation in community
events, and is shown in Table 7. The majority of respondents (57.43%) reported not
attending community events. Some respondents lamented that they did not have time to
attend community events or requested that more evening events be sponsored.
Table 7. Attendance at community events in the previous 2 years
Attended Events
Freq. %
No 85 57.43
Yes 63 42.57
Total 148 100.00
Questions 5 and 6 were included to gauge penetration of the hardcopy newsletter
into the neighborhood. Given that the newsletter was the third-highest source of
neighborhood news (albeit far behind neighbor-to-neighbor and listserv
communications), it would seem to serve some purpose for dissemination of information
Table 8 shows that a majority of the respondents (65.52%) received the
newsletter, with fewer (21.38%) reporting that they did not receive it and even fewer
(19%) unsure of whether they received it. Table 9 indicates that over two-thirds (77.06%)
of respondents read the newsletter, with fewer reporting that they only read it
“sometimes” (16.51%) or do not read it (6.42%).
Table 8. Do you receive the neighborhood newsletter
Recv Newsletter Freq. %
No 31 21.38
Yes 95 65.52
Don’t Know 19 13.10
Total 145 100.00
Table 9. If you receive the newsletter, do you read it
Read Newsletter Freq. %
No 7 6.42
Yes 84 77.06
Sometimes 18 16.51
Total 109 100.00
Two other items, Questions 20-21, added by the MHNA board to the
questionnaire related to the availability of computers and Internet or broadband access
within the respondent’s residence. The intent of these questions was to determine the
extent to which the neighborhood residents could be reached via online means, such as
the listserv. Table 10 shows that the majority of respondents (96.60%) have a personal
computer in the home, with only five respondents (3.40%) reporting they did not. Related
to this, Table 11 shows that the majority of respondents (95.21%) also have Internet
access. One respondent marked both of these items as No, and wrote: “fortunately and
The disparity between those online and those offline was expressed by one
respondent as follows:
Unconnected neighbors are those without computers/internet which are a sizable portion of the neighborhood (economic class and cultural differences) -- also those left out are renters (they don't know or maybe care about the listserv)
Table 10. Does your household include a computer
Have PC Freq. %
No 5 3.40
Yes 142 96.60
Total 147 100.00
Table 11. Does your household have Internet or broadband access
Have Internet or Broadband
Freq. %
No 7 4.79
Yes 139 95.21
Total 146 100.00
Community Attachment Bondedness
Questions 7 and 8 refer to the community attachment dimensions of social
bondedness. For Question 8, over half the respondents (67.86%) agreed with the
statement “I feel I’m a part of Morehead Hill” while almost a third (32.14%) agreed with
the statement “Morehead Hill is just a place to live.” One respondent wrote in her own
item, “I am very close to my immediate neighbors,” and ticked that checkbox,
emphasizing closeness due to proximity rather than to the neighborhood as a whole.
Feeling oneself to be a part of the neighborhood indicates stronger social bondedness.
Several comments written in response to this question illustrate the range of
feelings:
I just moved in 2 months ago. I am renting and don't know how long I will be here. I hear most updates via neighbors in my building. [This respondent did not select either item for Question 8.]
discovered the list service a few months ago and have felt more connected by being part of it.
I identify with Durham as a place to live, but not really the neighborhood Regarding #8, although I feel a part of the neighborhood, I have 1) had the impression that renters are not necessarily included, and b) have long been
confused about where one neighborhood ends and another begins. And which one I'm in. I'm in Morehead Hill? (I have been at my address here for ~ 2 years) I'm a Duke grad student and feel busy w/ other social connections. I'd like to be a part of the neighborhood and be more connected but I didn't know about the newsletter, Yahoo group, or Facebook page until now. I know my immediate neighbors well and feel very connected to them. We do favors for each other and look out for each other. I don't know people personally beyond my street/block. I didn't know that some people include my neighborhood in "Morehead Hill." I consider the area from Chapel Hill Street to east side of Forest Hills Park to be my part of Durham -- broader then Morehead Hills.
As these last comments demonstrated, the border between Morehead Hill and the
adjacent Forest Hills neighborhood is fuzzy for some residents. One respondent wrote in
“Forest Hills” while another wrote in “MH + Forest Hills.” On the first day the researcher
distributed the survey packages, he received a phone call from a resident who rather hotly
disputed that her home was in Morehead Hill and insisted that her block considered itself
as belonging to Forest Hills. (It should be noted that one of the residents of her block is
an at-large member of the MHNA board.)
More ambiguous are the results for Question 7, “In general, is it easy or difficult
for you to tell a stranger in your neighborhood from somebody who lives there?” Here,
the results were nearly evenly divided, with those finding it difficult (51.06%) numbering
only slightly more than those who found it easy (48.94%). One respondent wrote in,
“depends proximity”; another commented, “Likert scale? Sometimes easy, sometimes
In general, inability to identify a stranger from a resident would indicate low
social bondedness. Having such an ambiguous response could mean that the question was
poorly phrased or misunderstood, or that there are other factors—such as isolated
residents, transient neighbors, or areas with high walk-through traffic from outside the
neighborhood—that prevent residents from easily identifying strangers in their
community.
Table 12. Is it easy or difficult to identify strangers from residents
Identify Strangers Freq. %
Easy 69 48.94
Difficult 72 51.06
Total 141 100.00
Table 13. Do you feel a part of the neighborhood
Feel Part of the Neighborhood Freq. %
I feel I'm a part of Morehead Hill 95 67.86 Morehead Hill is just a place to live 45 32.14
Total 140 100.00
Rootedness
Three of the questionnaire items—Questions 17-19—address the physical
rootedness dimension of community attachment.
Question 17 asked for the number of years and months the respondents had lived
in the neighborhood. For this question, the unit of measure was years. When entering the
years and months figures into a spreadsheet, the numbers were entered in separate
columns, with a formula in a third column calculating the total number of years lived in
the neighborhood.
Discounting those questionnaires that left this item blank, there were 143
responses.
Figure 6 shows the number of residents reporting the length of time, in years, that
Figure 6. Length of residence in the community
Table 14 presents this information grouped into 5-year periods. Almost half of the
respondents report living in the neighborhood for less than 5 years (49.65%), with the
next sizable groupings happening in the 5-10 year range (16.08%) and 10-15 year range
(10.49%).
Table 14. Length of residence in the community
Range Freq. %
0.00 to 5.00 71 49.65% 5.01 to 10.00 23 16.08% 10.01 to 15.00 15 10.49% 15.01 to 20.00 11 7.69% 20.01 to 25.00 6 4.20% 25.01 to 30.00 10 6.99% 30.01 to 35.00 2 1.40% 35.01 to 40.00 3 2.10% 40.01 to 45.00 1 0.70% 45.01 to 50.00 1 0.70%
Total 143 100.00%
For this variable, the mean is calculated at 9.56, with a median of 5 and a standard
deviation of 10.33. However, these results resemble a skewed rather than a normal
distribution, so the median figure should be regarded skeptically. To that end, the
the data by subtracting the 25th percentile from the 75th percentile. For the variable of
years lived in the neighborhood, the 25th percentile was 2.083333 and the 75th percentile
was 14.83333, yielding an interquartile range or middle value of 12.75.
Question 18 asked whether the respondents owned or rented their residence. Table
15 shows that over three-quarters of the respondents (76.55%) owning with slightly less
than a quarter of the respondents (23.45%) renting. According to Riger and Lavrakas
(1981), owning indicates stronger rootedness than renting. However, some respondents
who reported renting wrote that they felt left out of neighborhood communications
because they rent. As one comment to Question 8, previously mentioned, said, “I
have…had the impression that renters are not necessarily included.” Another commenter
felt differently:
I do very much appreciate very close-by neighbors on Arnette. I feel more of a sense of community as a renter now than I did in the home I own in Charlotte.
(On a personal note, the researcher lived in a rented home in the neighborhood for
seven years before buying a home a block and a half away.)
Table 15. Own or rent
Own or Rent Freq. %
Own 111 76.55
Rent 34 23.45
Total 145 100.00
Table 16 displays the results to Question 19, “Do you expect to be living in this
neighborhood two years from now?” A strong majority of respondents (85.42%) recorded
yes, while a far smaller number (14.58%) reported no. In general, an expectation of
Table 16. Do you expect to live in the neighborhood two years from now
Expect to Live Here 2 Years from Now
Freq. %
No 21 14.58
Yes 123 85.42
Total 144 100.00
Sense of Community
Questions 9-16 implement the BSCS instrument. Table 17 provides consolidated
counts and percentages for the individual items and will be referred to throughout this
section. The following summary of these results breaks the items down into their SOC
dimensions.
Questions 9-10 pertain to the dimension of Needs Fulfillment. Figure 7 presents
the data in bar graph form. For Question 9, “I can get what I need in this neighborhood,”
over half of the respondents strongly agreed (16.67%) or agreed (42.36%) with the
statement, while slightly over a quarter of the respondents (26.39%) were neutral on the
point. About 15% either disagreed or strongly disagreed with the statement. Similar
response levels were recorded for Question 10, “This neighborhood helps me fulfill my
needs.” Over 64% either strongly agreed (20%) or agreed (44.83%) with the statement,
while over a quarter of respondents (28.97%) were neutral and only about 6% registering
disagreement. The results seem to indicate that Morehead Hill appears to satisfy the
needs of the majority of respondents.
However, the wording of this question (unaltered from the standard BSCS
instrument) caused some consternation. One respondent wrote question marks by the