PRESCRIBING
PREP: A GUIDE TO
ORAL HIV
PROPHYLAXIS
A Guide to Oral HIV Prophylaxis
Alyse J. Moses-Lebron
University of North Carolina Physician Assistant Program
Background
Currently, the war on Human Immunodeficiency Virus (HIV) focuses on
prevention in the forms of condoms, abstinence, and status awareness. However, once an individual is diagnosed with HIV, the focus on prevention switches to treatment. A patient’s knowledge of personal HIV status, use of barrier methods during sexual activity, and adherence to Highly Active Antiretroviral Therapy (HAART) can help prevent new infections in the HIV negative population. An additional method to limit seroconversion and subsequent HIV infection from exposure is pre-exposure
prophylaxis (PrEP). Tenofovir disoproxil fumarate (TDF) is a commonly utilized PrEP agent; it is generally considered safe, however it is associated with renal, endocrine and bone toxicity1. This paper aims to address the risks of PrEP administration in HIV
negative patients.
Epidemiology
HIV is a worldwide epidemic. It is the fourth leading cause of death worldwide2.
Sixty-three percent of new infections occur in the men who have sex with men (MSM) population3. With almost two-thirds of new infections diagnosed in the MSM
population, the majority of research, prevention, testing and treatment efforts are centered on the MSM population. However, there are other populations that are at risk and will continue to grow at alarming rates if they are continued to be overlooked because they are not deemed a high-risk group. Twenty-five percent of new infections are in the heterosexual population3. In 2010, women accounted for two-thirds of new
HIV infections contracted through heterosexual sex3. Expanding prevention efforts in the heterosexual population, and more specifically in the female population, could decrease overall HIV transmissions.
Pathophysiology
The pathophysiology of HIV is complicated. There are two types of HIV
infections: HIV-1 and HIV-2. HIV-2 is found primarily in West Africa2. The majority of infections are HIV-1. This paper will focus on HIV-1.
HIV is a retrovirus that infects and kills helper (CD4) T cells and can infect other cells with CD4 surface proteins like macrophages2. The loss of CD4 T lymphocytes results in decreased cell-mediated immunity and leads to increased susceptibility to opportunistic infections2. How HIV enters a cell and replicates are key sites for treatment and prevention.
the nucleocapsid, RNA genome, and reverse transcriptase enters into the cytoplasm. Reverse transcriptase then transcribes the virus’ RNA genome into double-stranded DNA which migrates to the nucleus and integrates into the host cell DNA mediated by the virus encoded endonuclease called integrase. Using the host cell RNA polymerase, the viral mRNA is transcribed from the proviral DNA and translated into several large proteins. Viral protease cleaves the Gag and Pol polymerase. The Gag protein is cleaved to form the main core protein (p24), the matric protein (p17) and several smaller proteins. The Pol poly protein is cleaved to form the reverse transcriptase, integrase and protease. The
immature viron forms in the cytoplasm of the host cell and then is cleaved by viral protease as the viron buds from the cell membrane. The cleavage process results in a mature, infectious viron2.
The viral processes of entry into the cell, reverse transcription of the viral RNA by the viron’s reverse transcriptase to double-stranded DNA, integrase from the virus to integrate the viral DNA into the host DNA, and viral protease cleaving proteins to form infectious virons are targets of the management of HIV infection and the prevention of transmission.
The pathophysiology of HIV transmission and laboratory testing is important because the point of transmission is where PrEP is effective. Transmission occurs via three routes: sexual contact, blood, or perinatal2. In the perinatal period, transmission is from infected mother through the placenta, at birth, or via breast milk2. The majority of perinatal infections occur at birth2. However, maternal to fetal transmission is almost
HIV infections progress in stages: early/acute stage, a middle/latent stage, and a late/immunodeficiency stage2 (Figure 1). The acute phase usually occurs 2-4 weeks
after infection2. The symptoms of fever, lethargy, sore throat, generalized
lymphadenopathy, and maculopapular rash on the trunk, arms, and legs (sparing the palms and soles) can occur and then spontaneously resolve2. During the acute infection phase, the virus is rapidly copied within the host and viral load is high. HIV infected persons may not have seroconverted during this time and may test negative. Seroconversion occurs when an HIV infected person will test positive for the virus. Although HIV antibodies such as the Anti-gp120 antibodies and the anti-p24 antibodies typically appear 10-14 days after infection, routine serologic testing may be falsely negative during this time and the virus may only be detectable by PCR2. It is estimated that the majority of new infections occur from HIV positive patients who are in the early stages of the infection where there is a large viremia burden and they are unaware they are also infected.5
The next phase of infection, is considered to be the latent phase. Although the viral loads are lower than the acute phase, the virus is still replicating and destroying CD4 cells, but patients do not have any symptoms. With the destruction of CD4 T-cells, patients become more immunocompromised and are unable to protect
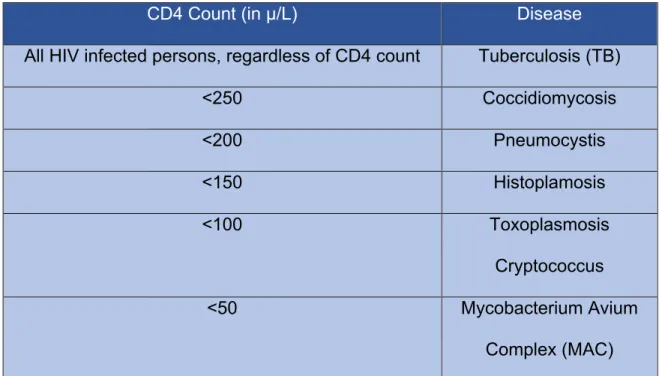
Without treatment, HIV will eventually progress to the final stage: AIDS. AIDS is defined as when the HIV infection has compromised the immune system severely, usually measured by the amount of CD4 cells (below 200µ/L2,6) or when an opportunistic
infection is diagnosed7. Opportunistic infections (Table 1) are distinguished as infections a
non-immunocompromised individual would be able to resolve without medical assistance. Opportunistic infections and malignancy occur that can result in death with the increased destruction of CD4 T-cells.
CD4 Count (in µ/L) Disease
All HIV infected persons, regardless of CD4 count Tuberculosis (TB)
<250 Coccidiomycosis
<200 Pneumocystis
<150 Histoplamosis
<100 Toxoplasmosis
Cryptococcus
<50 Mycobacterium Avium
Complex (MAC) Table 1 Opportunistic Infections based on CD4 counts8
Early/Acute Phase
Middle/Latent Phase
Late/Immunocompromised Phase (AIDS)
Management
To date, there is no definitive cure for HIV. To manage HIV infections, patients are prescribed highly active anti-retroviral therapy otherwise known as HAART. HAART utilizes 3-4 antiretroviral pharmacologic agents to work to reduce viral load, which helps reduce transmission, and increase the CD4 count to reduce opportunistic infections and AIDS related malignancies2.
Two of the drugs used to in the HAART regimen have been proven to reduce HIV infection. PrEP consists of reverse transcriptase inhibitors: tenofovir and emtricitabine. These drugs prevent the transcription of the viral RNA into double stranded DNA
effectively stopping its ability to replicate. Because of its efficacy in reducing HIV
transmission based on the available trial results, the FDA approved an indication for the use of Truvada (TDF/FC) in combination with safer sex practices for PrEP to reduce the risk of sexually acquired HIV-1 in adults at high risk in 20129. PrEP is widely recognized in the MSM population as a HIV transmission prevention tool. Daily use of PrEP
reduces the HIV transmission by greater than 90% in the MSM population and 70% in the IV drug user population10. Although long term use of HAART has some noted side
effects such as renal function decline, bone mineral density decline and also
gastrointestinal distress which will be reviewed later in greater detail, PrEP is deemed safe and effective.
Costs of Care
data reported the cost of HIV infection for a person who became infected at the age of 35 to be $326,500 with 29.5 years life expectancy12. The majority of the cost of HIV
treatment is for antiretroviral medications (60%), followed by chronic disease medication and for opportunistic infection prophylaxis and treatment medications (15%) and for non-medications costs (25%)12. It is estimated that the cost of avoiding a HIV infection based on current linkage and retention in HIV care is $229,800 12. PrEP is more costly than other interventions such as condoms and abstinence. However, it is another tool and its effectiveness should be explored in other populations. Schackmann et al
theorized that the costs to society of HIV infection extend well beyond the medical realm to include: social services, housing, patient time, lost productivity and physical and emotional distress to patients and their families12.
Methods
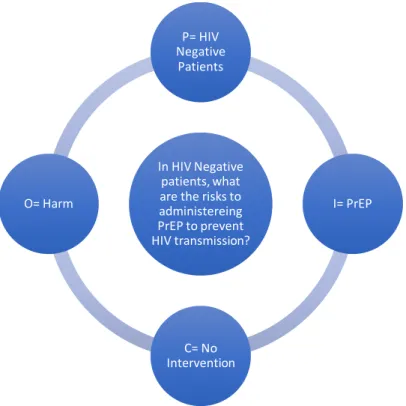
Figure 2 PICO question
An electronic search of PubMed for full text articles was performed. The PICO question used for the search was: In HIV negative patients, what are the risks to administering PrEP to prevent HIV transmission? (Figure 2). The terms HIV, PrEP, renal, liver, bone mass, gastrointestinal, and adherence were searched. Included in the results were clinical trials, randomized control trials, reviews, full text articles, and
published between the dates of 2012-2017. Case studies were excluded. Articles that focused on generic drugs, transgender drug interactions, HIV positive, drug comparison studies, mouse and other animal studies, hepatitis, uptake in tissue, and published in languages other than English were also excluded.
In HIV Negative patients, what are the risks to administereing PrEP to prevent HIV transmission?
P= HIV Negative
Patients
I= PrEP
Results
A total of forty-two articles were obtained from the search criteria. The first search terms: HIV, PrEP, and Renal revealed nineteen articles. The second set of search terms: HIV, PrEP, and Bone Mass revealed 15 articles, however, six articles were duplicated from the first search. The third search using the terms: HIV, PrEP, and Liver, returned fourteen articles. All hepatitis B specific articles were excluded as
relevant to the topic of PrEP and reduction in transmission. Humanized mice and mice only studies were also excluded. The fourth search with the terms: HIV, PrEP, and Gastrointestinal returned four articles with duplicates from previous searches.
Cohort studies were evaluated using STROBE (Appendix A). Meta-analyses and systematic reviews were evaluated using SORT Criteria (Appendix B). Randomized-control trials were evaluated using GRADE analysis (Appendix C).
As shown below, there are challenges to administering PrEP and baseline assessment of laboratory values and risk must be performed. Upon initiation of PrEP, various testing for pregnancy, HIV status and Hepatitis B status are necessary for proper use of PrEP. Given toxicity of the medication, monitoring of renal function, and risk/benefit discussion on GI side-effects and BMD loss should occur between the provider and the patient.
Renal Function
Although many patients tolerate PrEP without renal side-effects, some patients may experience renal toxicity. The intracellular mechanism which induces
nephrotoxicity is not well understood, but hypothesized to be a result of direct tubule-cytotoxicity effects mediated through mitochondrial DNA injury13. In HIV infected persons, acute tubular necrosis has been demonstrated with varying degrees of scarring suggesting a reason for the sub-optimal reversibility in a minority of cases. 13 However, other factors such as HIV infection itself can contribute to renal decline and cannot translate to the HIV negative population13. It has been difficult to accurately
ascertain the relationship between PrEP and renal function decline due to multiple studies having adherence issues. Studies that have examined a direct link between adherence rates and renal function have noted a renal decline associated with higher levels of adherence14. The decrease in renal function associated with the use of PrEP has been noted to be small and usually reversible upon discontinuation of PrEP13.
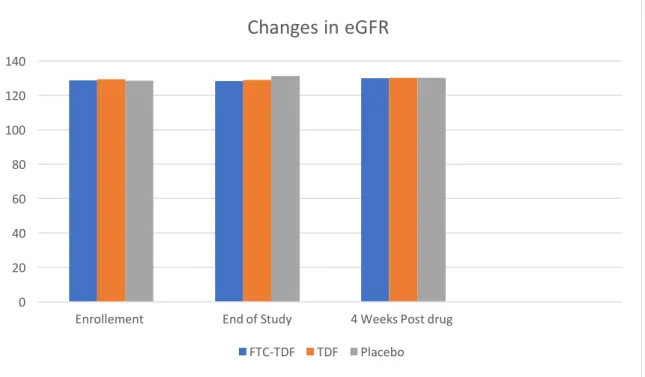
Mugwanya et al’s observational cohort study from the Partners PrEP randomized control trial demonstrated decline in renal function among the active limbs of the trial, but also showed that this decline is reversible (Figure 3). The average FTC-TDF group (n=1308) enrollment eGFR was 128.8 mL/min/1.73m2 (p=0.73, CI= 95%), minimally dropping to an average end of treatment eGFR of 128.3 mL/min/1.73m2 (p=<0.01).
Participants’ first post-drug follow-up eGFR averaged 130.0 mL/min/1.73m2 (p=0.80). Within 12 weeks of last on-study drug date, a 100% probability of >75% eGFR
Figure 3 Data demonstrating minimal change in eGFR and reversibility to baseline adapted from the observational cohort study from the Partners PrEP trial13
The TDF only group enrollment average eGFR was129.3 mL/min/1.73m2 (p=0.28, CI= 95%), end of treatment eGFR demonstrated a minute decrease to 129.0
mL/min/1.73m2 (p=<0.01). The TDF only participants’ first post-drug follow-up averaged
eGFR 130.1 mL/min/1.73m2 (p=0.00). Participants were also evaluated in four week intervals demonstrating a 100% probability of > 75% eGFR reversibility was met by 12 weeks (p=0.49, 95% CI). The majority of the participants in the TDF arm of the trial also met the threshold by last on-study drug date 4 and 8 week assessments as in the FDC-TDF group13.
The initial eGFR average of the placebo group enrollment was 128.6
mL/min/1.73m2, which actually increased to 131.3 mL/min/1.73m2 (p=<0.01) at the end
of treatment. However, the first post-drug follow-up average decreased to eGFR 130.1 mL/min/1.73m2 (p=0.99). By the 12 week mark, the probability for the placebo arm to
0 20 40 60 80 100 120 140
Enrollement End of Study 4 Weeks Post drug
Changes in eGFR
return to a eGFR of >75% of the initial eGFR was 100%, as in the FDC-TDF and TDF only arms of the trial13. This observational cohort study from Partners PrEP RCT
successfully demonstrated a minor decrease in eGFR for the duration of the drug as well as reversibility of eGFR to nearly the same value.
Likewise, as noted in an observational cohort study by Gandhi et al examined the long-term use of tenofovir-disoproxil-fumarate/ emtricitabine (TDF/FTC) on renal
function, using creatinine clearance (CrCl) as a measurement, in combination with adherence by testing levels of TDF/FTC in hair samples. The average decline in CrCl for all participants over the duration of the study was −2.9% (95% CI: −2.4% to −3.4%), p<0.0001. Declines in CrCl were significantly greater over time in participants who started PrEP at older ages: −2.6% decline (95% CI: −2.4% to −3.4%) in those with baseline age <40 years; versus a −4.2% (95% CI: −2.8% to −5.5%) decline for
participants with starting age 40–50 years (p<0.001 in comparison to <40 years); and −4.9% decline (95% CI: −3.1% to −6.8%) for participants with baseline age ≥50 years (p<0.001) when adjusted for baseline CrCl14.
There are some risk factors that have been linked to increased likelihood of renal function decline. Renal function normally deteriorates in individuals as age increases. Older age was noted to be a risk factor for decline while receiving PrEP14. While the studies differed on the age ranges for data collection, the outcome of increased age associated with decline in renal function was consistent.
rates of decline14. There was a +3.2% (+2.1 to +4.3) increase in those participants who started PrEP in the lowest quartile of baseline CrCl (56–100 ml/min). Participants in the 2nd quartile (a CrCl of 101-113ml/min) demonstrated a −2.0% (−3.1 to −0.9) decrease. Participants in the 3rd quartile of CrCl (114-128ml/min) displayed a decreased of −3.6% (−4.7 to −2.5). Participants in the highest quartile with a CrCl of 129-208ml/min
revealed a −10·0% (−11·2 to −8·8), p < 0·0001 decrease14.
Other factors associated with decreased renal function in the population which does not utilize PrEP such as hypertension and recent NSAID did not show an
association with increased risk for decline in renal function during use of PrEP14. Diabetes was associated with a borderline increased risk of renal function decline 14.
Current guidelines for renal function monitoring of PrEP users is to obtain eCrCL biannually 2,9 and PrEP should be discontinued if the CrCl falls to 60 ml/min9 or
below. For additional renal concerns, more frequent monitoring and additional tests such as urinalysis for proteinuria are recommended. Using clinical judgement to involve a nephrologist or evaluate for other renal concerns in patients with steadily declining GFRs, but still above the 60 mL/min withdrawal limit is also encouraged 9.
Bone Mineral Density and Management
Osteoporosis and fracture risk is increased in HIV-infected adults, and anti-retroviral therapy is associated with rapid bone loss15. PrEP users have a low absolute risk of fracture15, but concern with bone mineral density loss in an otherwise healthy
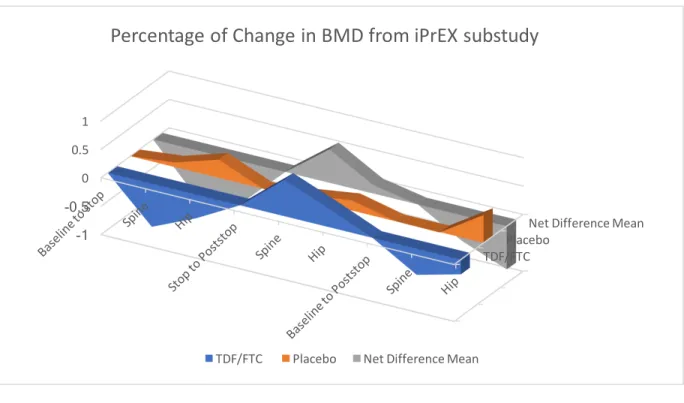
placebo-controlled trial of FTC/TDF PrEP demonstrated net differences in bone mineral density (BMD) were modest but consistently below zero, indicating greater BMD loss in the FTC/TDF group. Participants had a baseline BMD evaluation and then were followed in 24 week increments. Participants in the FDC/TDF group were found to have a change of −0.91% [95% CI, −1.44% to −.38%], P = .001 in BMD at week 24. After week 24, further net changes averaged −0.12% [95% CI −.36% to .12%] for each additional 24-week interval and were not statistically significant (P = .28)16.
Bone mineral density decrease is another concern regarding administering PrEP to healthy individuals. Currently, PrEP is widely used in the younger MSM population. While males are not considered to be a high-risk group for osteopenia and
Figure 4: Graphical representation of data adapted from iPrEX sub-study demonstrating BMD increasing after
cessation of PrEP use. Participants in this study were followed 24 weeks after cessation of PrEP use.
Additionally, bone mineral density recovery was the greatest in the < 25 years old population who had not reached peak bone mass yet after PrEP discontinuation15. HIV infection alone can be a cause for bone mineral density loss. Reassuringly, bone loss among highly adherent PrEP users was still less than that observed after starting combination ART for HIV infection16 . The exact mechanism for bone mineral density loss in HIV uninfected patients is unclear. Renal tubular damage with phosphate wasting may be a key factor in the bone toxicity associated with TDF1.
Evidence is divided as to adjunct calcium therapies to combat the effects of bone mineral density loss. According to Kasonde et all, some clinical trials found a positive effect of calcium supplementation on the bone mineral density in children and
adolescents19. This data could suggest that calcium supplementation in PrEP users
TDF/FTC Placebo
Net Difference Mean
-1 -0.5
0 0.5 1
Percentage of Change in BMD from iPrEX substudy
could be beneficial to reduce the decrease in bone mineral density in PrEP users. However, in a meta-analysis of randomized placebo controlled trials of calcium supplementation in healthy children not on PrEP, there was no effect of calcium
supplementation on bone mineral density at the femoral neck or at the lumbar spine at the end of trials19. For participants in the TDF2 sub-study placed on calcium
supplements for low BMD at baseline, there was no significant difference from the original model after controlling for supplementation19.
Another intervention to mitigate effects on bone mineral density is to remain on PrEP during high risk periods of contracting HIV and off of PrEP when the risk of acquiring HIV are low15 . Although with the previously found reversibility of bone mineral density loss upon discontinuation of PrEP, use of a cycling regimen warrants more thorough investigation to the possible effects on bone mineral density. This method would also need focused practitioners to assess the HIV acquisition risk and enable and educate participants to recognize their specific risk. With adherence being an essential component of PrEP success, a closer examination to cycling regimens and social factors needs further investigation.
depo-medroxyprogesterone acetate (DMPA)19. A randomized control trial examining effects of TDF on bone in HIV negative women in sub-Saharan Africa who may receive PrEP for several years during young adulthood and who may also may be concurrently impacted by other factors affecting bone density including contraception, pregnancy, and lactation demonstrated a decrease in bone mineral density during PrEP usage and also an increase in BMD at both the spine and the hip when stopping therapy18. This study demonstrated the reversibility of PrEP associated bone mineral density decrease which is similar to the results of other randomized control trials with male participants. Taking into account the type of contraception was a strong point of this study. Fifty-two percent of participants reported a history of DMPA use18. DMPA alone has also been associated with bone mineral density loss that is reversible when stopping therapy.
There is well documented evidence of reversibility of the effects of PrEP on bone mineral density. There are no guidelines for baseline DEXA scans or other bone
mineral density testing prior to initiating PrEP or during therapy9. The recommendation
is that any person being considered for PrEP who has a history of pathologic or fragility bone fractures or who has significant risk factors for osteoporosis should be referred for appropriate consultation and management 9.
Adherence
Adherence has proven to be a prevalent issue during PrEP trials. The iPrEX trial demonstrated that participants with detectable levels of PrEP had a reduction in
reduced by 92% (95% CI, p<0.001) among participants with detectable levels of
TDF/FTC when compared with participants without detectable levels20. However, in the
iPrEX trial, drug resistant virus developed in 2 people with unrecognized acute HIV infections at enrollment and for whom had TDF/FTC dispensed 9. This finding has increased concern that inconsistent PrEP users or those with decreased adherence could be at risk for drug-resistant HIV infection. Adherence is an important part of implementing PrEP as a successful intervention.
Studies that have revealed PrEP as an ineffectual tool in HIV prevention have been plagued by adherence issues. The study by Damme et all could not determine the effectiveness of PrEP among women due to low adherence levels21. Although
forgiving in rectal HIV exposure than with vaginal exposure potentially due to the differences in active metabolites in the rectal and vaginal tissues after oral
administration21.
The majority of new HIV infections are spread via vaginal and anal sexual
intercourse22 as opposed to IV drug use. With HIV infections growing rapidly among the
heterosexual female population, differences in the tissue concentrations of PrEP raises concern regarding the effectiveness of PrEP is its use in women. There are differences in the pharmacodynamics of PrEP in vaginal tissue and anal tissue. A recent study from Cottrell et al demonstrated median dose-adjusted AUC0–48h for TFV and TFVdp
were 10–45 times higher in colorectal tissue (38.5 µg*hr*g−1 and 2046.5 pmol*hr*g−1,
respectively), compared with female genital tract (FGT) tissue (0.83 µg*hr*g−1 and 188 pmol*hr*g−1, respectively)22. Although median dose-adjusted FTC AUC
0–48h was higher
in colorectal tissue (222.3 µg*hr*g−1) than FGT tissue (17.6 µg*hr*g−1), FTCtp values were 140 times higher in FGT tissue (15 094.3 pmol*hr*g−1) than colorectal tissue (108.2 pmol*hr*g−1)22. In colorectal tissue, the maximal proportion of the population
(100%) achieved target exposure for efficacy after 3 daily doses of the fixed-dose combination. In FGT tissue, the maximal proportion of the population (99%) achieved target exposure over the entire dosing interval after 3 daily doses of the fixed-dose combination. In colorectal tissue, dosing twice per week with the fixed-dose combination achieved target exposure in >95% of the population while in FGT tissue, this dosing achieved target exposure in 65% of the population22. The evidence from the
need to be more adherent and may need more doses than those at risk of HIV infection from anal intercourse to achieve the same level of protection from seroconversion.
Side effects can be an additional factor that affects adherence and should be discussed with patients with a plan to mitigate side effects9. Side effects are uncommon, and usually resolve within the first month of taking PrEP and termed “start-up
syndrome”9. Common side effects are headache9, nausea9,23, vomiting23, diarrhea23, and flatulence9 and can be mitigated with over-the-counter medicines9.
Implementation Techniques
Marcus et all described a continuum of care model for PrEP delivery24 (Figure 5).
Figure 5 The Continuum of Care for Successful PrEP Use as described by Marcus et all
The first step is identification of individuals at risk for HIV infection24. Based on
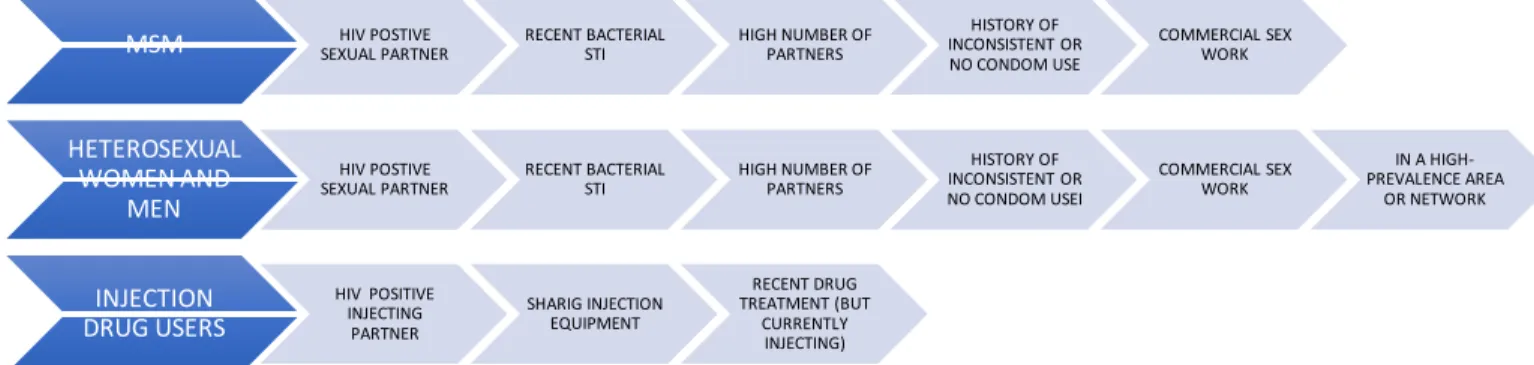
CDC guidelines, several populations can benefit from PrEP. The first step in assessing a need for PrEP is establishing the presence of risk factors in the patient. According to the CDC, risk factors for HIV infection are divided among three groups: MSM,
Heterosexual Women and Men, and Injection Drug Users (IDU) (Figure 6).9 The risk factors for the MSM population include: HIV positive sexual partner, recent bacterial STI, high number of sexual partners, history of inconsistent or no condom use, and commercial sex work9. The risk factors for the heterosexual women and men include: HIV positive sexual partner, recent bacterial STI, high number of sexual partners, history of inconsistent or no condom use, commercial sex work, and located in a
high-Idenification
Linkage
Initiation
prevalence area or network9. Risk factors for IDU are: HIV positive injecting partner, sharing injection equipment, and recent drug treatment with current injection behaviors9.
Figure 6 Persons at risk for HIV infection according to CDC guidelines9
The second step is linkage to individuals at risk for HIV infection to a PrEP provider and site24. Linkage can also accompany the identification step. Marcus et al evaluated PrEP implementation models including: Health Maintenance Organization (HMO) setting, STI clinic setting, and Primary Care setting24. In an HMO setting, the
majority of referrals are initiated by patients, however in a STI clinic setting it was clinicians who identified a risk and offered PrEP to patients24. In a primary care setting,
PrEP was offered to patients who specifically requested it from their providers and those who are identified as having an elevated risk for HIV infection during a sexual risk
assessment 24.
Initiation of PrEP is the third step described by Marcus et al. Initiation includes not only baseline laboratory tests such as HIV, Hepatitis B, and creatinine, but
MSM HIV POSTIVE
SEXUAL PARTNER RECENT BACTERIAL STI HIGH NUMBER OF PARTNERS
HISTORY OF INCONSISTENT OR NO CONDOM USE
COMMERCIAL SEX WORK
HETEROSEXUAL WOMEN AND
MEN
HIV POSTIVE
SEXUAL PARTNER RECENT BACTERIAL STI HIGH NUMBER OF PARTNERS
HISTORY OF INCONSISTENT OR NO CONDOM USEI
COMMERCIAL SEX WORK
IN A HIGH-PREVALENCE AREA
OR NETWORK
INJECTION DRUG USERS
HIV POSITIVE INJECTING PARTNER
SHARIG INJECTION EQUIPMENT
RECENT DRUG TREATMENT (BUT
also a mechanism to pay for PrEP and the continued care needed for ongoing use of PrEP24.
According to the CDC, clinicians should document a HIV negative test within a week prior to initiation or re-initiation of PrEP medications at a minimum 9. HIV testing can be performed by HIV EIA (enzyme-linked immunoassay) or performing a rapid, point-of-care, FDA-approved finger stick blood test9. Oral rapid tests can be less sensitive than blood tests are should be used to screen for HIV infection in the context of administering PrEP9. Preliminary positive HIV antibody tests must be confirmed by Western blot or IFA (immunofluorescence assay) and viral load and CD4 lymphocyte tests9. The CDC recommends baseline renal function testing to ensure patients with a CrCl less than 60 mL/min are not prescribed PrEP with TDF/FTC 9. The CDC also recommends hepatitis serology for Hepatitis B (HBV) and Hepatitis C (HCV)9.
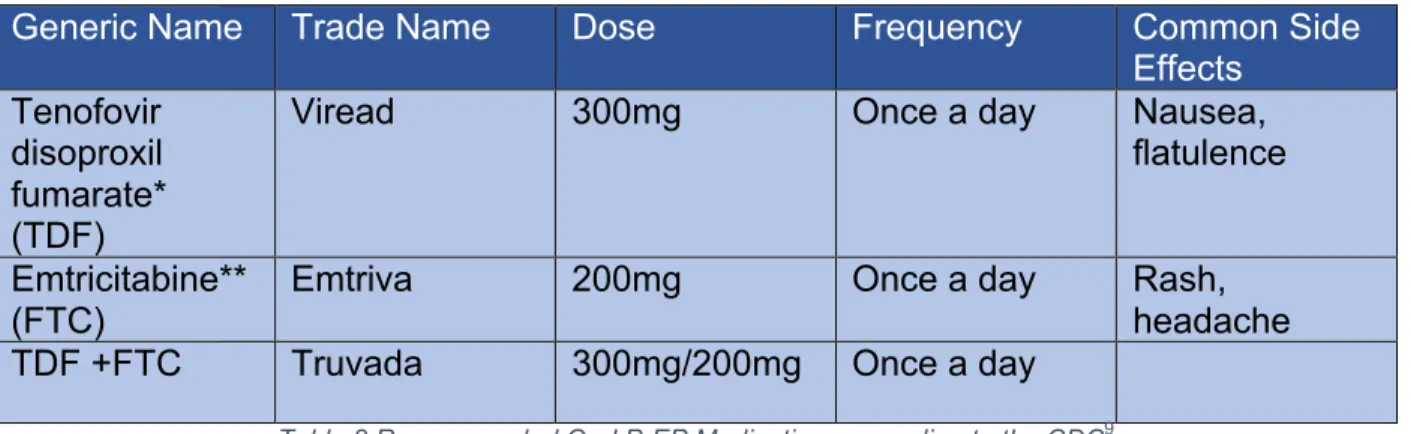
Education about side effects, possible toxicities, and adherence is part of the initiation of PrEP24. Currently, the medications that are approved for PrEP are TDF and FTC (Table 2)9. FTC should not be used alone and only in conjunction with TDF9. Additionally, the only dosing schedule approved is daily dosing9.
Generic Name Trade Name Dose Frequency Common Side
Effects
Tenofovir disoproxil fumarate* (TDF)
Viread 300mg Once a day Nausea,
flatulence
Emtricitabine** (FTC)
Emtriva 200mg Once a day Rash,
headache TDF +FTC Truvada 300mg/200mg Once a day
Table 2 Recommended Oral PrEP Medications according to the CDC9
* TDF alone has proven effective in trials with IDU and heterosexually active men and women so it may be considered as a regiment in those populations
There are several financial assistance programs available to patients if they qualify based on their income level, geographic location, and insurance status. Gilead Sciences offers PrEP to US residents who earn <500% of the federal poverty level at no cost24,25. There are additional programs for New York and Washington state
residents25. Some insurance will also cover some of the costs of PrEP.
The final step of PrEP implementation is engagement24. This step is maintaining adherence and completing laboratory testing. Engagement requires follow-up with a PrEP provider for laboratory testing such as HIV testing, STI testing, and renal function testing (Figure 7)9 .
Figure 7 Clinical Follow-Up and Monitoring Schedule According to the CDC
Every 3 Months
•HIV testing •Pregnancy testing
•Assess side-effects, adherence, and risk behaviors
•Provide support for medication adherence and risk-reduction behaviors
•Respond to new questions and provide any new information about PrEP
•Refill prescription for daily TDF/FTC for no more than 90 days
Every 6 Months
•Monitor CrCl
•Consider urinalysis for proteinuria if other threats to renal function are present (e.g. hypertension, diabetes) •STI testing for sexually active
patients
Every 12 Months
Based on the type of PrEP implementation program, some of the visits may be laboratory visits and contact may be achieved by communication within the electronic medical record (EMR)24.
Discussion
While lifestyle modifications are first line in HIV prophylaxis, PrEP is a valuable tool in HIV infection prevention. As with other chronic diseases such as hypertension and diabetes, lifestyle modifications while extremely effective, are difficult for patients to implement and maintain. PrEP, in addition to lifestyle modifications, has been proven as a successful regimen.
However, as highlighted in the results section, PrEP is not without side effects. The gastrointestinal side effects that are most noticeable to patients could affect
adherence. Discussions with patients and techniques to combat unpleasant side effects can help increase adherence. Decreased adherence affects the efficacy of PrEP. Baseline renal insufficiency and decreased bone mineral density can affect a patient’s eligibility for oral PrEP. With reversibility of both decreased renal function and bone mineral density demonstrated in many trials, PrEP has shown to be relatively well-tolerated and safe.
they account for two-thirds of the new HIV infections in heterosexuals in the United States, are a potentially missed population that would greatly benefit from this intervention.
Implementing a PrEP program can assist providers to discuss sexual health, drug use, and HIV infection with patients. Many times, HIV is the “elephant in the room”. Discussing risk and life style modifications can also help reduce the stigma that plagues detection of this disease. Prior to initiating PrEP, testing for HVB, HVC, and HIV as well as other STIs is necessary. To determine if someone is a candidate for PrEP renal function testing is also necessary as PrEP can only be administered if CrCl is greater than 60mL/min. Regardless of where the PrEP program is implemented, a primary care setting or subspecialty clinic, close monitoring and follow-up is needed to ensure continued safety, adherence, and need for PrEP as a tool to prevent HIV infection.
Conclusion
References
1. Havens PL, Stephensen CB, Van Loan MD, et al. Decline in Bone Mass With Tenofovir Disoproxil Fumarate/Emtricitabine Is Associated With Hormonal Changes in the Absence of Renal Impairment When Used by HIV-Uninfected Adolescent Boys and Young Men for HIV Preexposure Prophylaxis. Clin Infect Dis. 2017;64(3):317-325. doi:10.1093/cid/ciw765.
2. Levinston W. Review of Medical Microbiology and Immunology. 14th ed. New York: McGraw-Hill Medical; 2014.
3. CDC Fact Sheet. Center for Disease Control and Prevention.
https://www.cdc.gov/nchhstp/newsroom/docs/factsheets/todaysepidemic-508.pdf. Accessed April 24, 2017.
4. North Carolina HIV/STD Surveillance Unit. 2015 North Carolina HIV / STD Surveillance Report. 2016:109.
http://epi.publichealth.nc.gov/cd/stds/figures/std16rpt_rev2.pdf.
5. Sax PE. Acute and early HIV infection: Clinical manifestations and diagnosis. Acute and early HIV infection: Clinical manifestations and diagnosis. Up To Date.
https://www.uptodate.com/contents/acute-and-early-hiv-infection-clinical-
manifestations-and-diagnosis?source=search_result&search=hiv&selectedTitle=1~150. Accessed April 12, 2017.
6. Sax PE, Bartlett JG. Techniques and interpretation of measurement of the CD4 cell count in HIV-infected patients. Up To Date.
https://www.uptodate.com/contents/techniques-and-interpretation-of-
measurement-of-the-cd4-cell-count-in-hiv-infected-patients?source=search_result&search=hiv cd4 count&selectedTitle=1~150. Published 2017. Accessed November 6, 2017.
7. Centers for Disease Control and Prevention. HIV/AIDS:Terms, Definitions, and Calculations Used in CDC HIV Surveillance Publications. Centers for Disease Control and Prevention. https://www.cdc.gov/hiv/statistics/surveillance/terms.html. Published 2016. Accessed September 23, 2017.
8. Bartlett JG, Sax PE. Overview of prevention of opportunistic infections in HIV-infected patients. Up To Date.
9. Centers for Disease Control and Prevention. Preexposure Prophylaxis for the Prevention of HIV Infection in the United States – 2014 Clinical Practice Guideline. Mmwr. 2014:1-67.
10. PrEP. Center for Disease Control and Prevention.
https://www.cdc.gov/hiv/basics/prep.html. Accessed May 17, 2017. 11. HIV Cost Effectiveness. Center for Disease Control and Prevention.
https://www.cdc.gov/hiv/programresources/guidance/costeffectiveness/index.html. Accessed May 8, 2017.
12. Schackman BR, Fleishman JA, Su AE, et al. The Lifetime Medical Cost Savings From Preventing HIV in the United States. Med Care. 2015;53(4):1.
doi:10.1097/MLR.0000000000000308.
Pre-Exposure Prophylaxis. 2017;71(4):374-380.
doi:10.1097/QAI.0000000000000868.Reversibility.
14. Gandhi M, Diseases I, Medicine G, et al. HHS Public Access: Age, baseline kidney function, and medication exposure are associated withdeclines in creatinine clearance on PrEP: an observational cohort study. 2016;3(11):1-18. doi:10.1016/S2352-3018(16)30153-9.Age.
15. Yin MT, Brown TT. HIV and Bone Complications: Understudied Populations and New Management Strategies. Curr HIV/AIDS Rep. 2016;13(6):349-358.
doi:10.1007/s11904-016-0341-9.
16. Mulligan K, Glidden D V., Anderson PL, et al. Effects of Emtricitabine/Tenofovir on Bone Mineral Density in HIV-Negative Persons in a Randomized, Double-Blind, Placebo-Controlled Trial. Clin Infect Dis. 2015;61(4):572-580.
doi:10.1093/cid/civ324.
17. Glidden D V., Mulligan K, McMahan V, et al. Recovery of Bone Mineral Density Following Discontinuation of Tenofovir-Based HIV Pre-Exposure Prophylaxis. JAIDS J Acquir Immune Defic Syndr. 2017:1.
doi:10.1097/QAI.0000000000001475.
18. Mirembe BG, Kelly CW, Mgodi N, et al. Bone Mineral Density Changes Among Young, Healthy African Women Receiving Oral Tenofovir for HIV Preexposure Prophylaxis. J Acquir Immune Defic Syndr. 2016;71(3):287-294.
doi:10.1097/QAI.0000000000000858.
19. Kasonde M, Niska RW, Rose C, et al. Bone mineral density changes among HIV-uninfected young adults in a randomised trial of pre-exposure prophylaxis with tenofovir-emtricitabine or placebo in Botswana. PLoS One. 2014;9(3):1-9. doi:10.1371/journal.pone.0090111.
20. Cutrell A, Donnell D, Dunn DT, et al. HIV prevention trial design in an era of effective pre-exposure prophylaxis. HIV Clin Trials. 2017;4336(October):1-12. doi:10.1080/15284336.2017.1379676.
21. Damme, Lut Van Corneli, Amy Ahmed, Khatija Agot, Kawango Lombaard, Johan Kapiga, Saidi Malahleha, Mookho Owino Fredrick Manogi, Rachl Oyango, Jacob Temu, Lucky Monedi C, Mid AD, Oketch PM, et al. Preexposure Prophylaxis for HIV Infection among African Women. N Engl J Med. 2012;367(5):411-422. doi:10.1056/NEJMoa1202614.Preexposure.
22. Cottrell ML, Yang KH, Prince HMA, et al. A Translational Pharmacology Approach to Predicting Outcomes of Preexposure Prophylaxis Against HIV in Men and Women Using Tenofovir Disoproxil Fumarate With or Without Emtricitabine. J Infect Dis. 2016;214(1):55-64. doi:10.1093/infdis/jiw077.
23. Tetteh RA, Yankey BA, Nartey ET, Lartey M, Leufkens HGM, Dodoo ANO. Pre-Exposure Prophylaxis for HIV Prevention : Safety Concerns. Drug Saf.
2017;40(4):273-283. doi:10.1007/s40264-017-0505-6.
24. Marcus JL, Volk JE, Pinder J, et al. Successful Implementation of HIV Preexposure Prophylaxis : Lessons Learned From Three Clinical Settings. 2016:116-124. doi:10.1007/s11904-016-0308-x.
25. Conniff J, Evensen A. Preexposure Prophylaxis (PrEP) for HIV Prevention: The Primary Care Perspective. J Am Board Fam Med. 2016;29(1):143-151.
Appendix A STROBE Analysis
Decline in Bone Mass With Tenofovir Disoproxil Fumarate/Emtricitabine Is Associated With Hormonal Changes in the Absence of Renal Impairment When Used by HIV-Uninfected Adolescent Boys and Young Men for HIV Preexposure Prophylaxis by Havens et al STROBE Score: 20
Title and Abstract 1 (a) Indicate the study’s design with a commonly used term in the title or the abstract [not present]
(b) Provide in the abstract an informative and balanced summary of what was done and what was found [Pg. 317]
Introduction
Background/rationale 2 Explain the scientific background and rationale for the investigation being reported [Pg. 317-318] Objectives 3 State specific objectives, including any
pre-specified hypotheses [Pg. 318] Methods
Study design 4 Present key elements of study design early in paper [Pg. 318]
Setting 5 Describe the setting, locations, and relevant dates, including periods of recruitment, exposure, follow-up, and data collection [Pg. 318]
Participants 6 (a) Cohort study: give the eligibility criteria, and the sources and methods of selection of participants. Describe methods of follow-up [Pg. 318]
Case-Control Study: Give the eligibility criteria, and the sources and methods of case ascertainment and control selection. Give the rationale for the choice of cases and controls
Cross-Sectional study: Give the eligibility criteria, and the sources and methods of selection of participants
(b) Cohort Study: For matched studies, give matching criteria and the number of controls per case [Pg. 318]
Variables 7 Clearly define all outcomes, exposures, predictors, potential confounders, and effect modifiers. Give diagnostic criteria, if applicable [Pg. 318]
comparability of assessment methods if there is more than one group [Pg. 318]
Bias 9 Describe any efforts to address potential sources of bias [Pg. 318-319]
Study Size 10 Explain how the study size was arrived at [Pg. 319]
Quantitative variables 11 Explain how quantitative variables were handled in the analyses. If applicable, describe which groupings were chosen and why [Pg. 318-319] Statistical Methods 12 (a) Describe all statistical methods, including
those used to control for confounding [Pg. 318-319]
(b) Describe any methods used to examine subgroups and interactions
(c) Explain how missing data were addressed [Pg. 319]
(d) Cohort study: If applicable, explain how loss to follow up was addressed [Pg. 319] Case-Controlled study: If applicable, explain how matching cases and controls was addressed
Cross-sectional study: If applicable, describe analytical methods taking account of sampling strategy
(e) Describe any sensitivity analysis [Pg. 319] Results
Participants 13* (a) Report the numbers of individuals at each stage of the study- e.g. numbers
potentially eligible, examined for eligibility, confirmed eligible, included in the study, completing follow-up and analyzed [Pg. 319]
(b) Give reasons for nonparticipation at each stage [Pg. 319]
(c) Consider use of a flow diagram [not present]
Descriptive Data 14* (a) Give characteristics of study participants (e.g. demographic, clinical, social) and information on exposures and potential confounders [Pg. 319- 320]
(b) Indicate the number of participants with missing data for each variable of interest [Pg. 319]
Outcome Data 15* Cohort study: Report numbers of outcome events or summary measures over time [Pg. 322]
Case control study: Report numbers in each exposure category or summary measures of exposure
Cross-sectional study: Report numbers of outcome events or summary measures Main Results 16 (a) Give unadjusted estimates and, if
applicable, confounder-adjusted estimates and their precision (e.g. 95% CI). Make clear which confounders were adjusted for and why they were included [Pg. 322] (b) Report category boundaries when
continuous variables were analyzed [Pg. 321]
(c) If Relevant, consider translating estimates of relative risk into absolute risk for a meaningful time period
Other Analyses 17 Report other analyses done- e.g. analyses of subgroups and interactions and sensitivity analyses [Pg. 321-322]
Discussion
Key results 18 Summarize key results with reference to study objectives [Pg. 323]
Limitations 19 Discuss limitations of the study, taking into
account sources of potential bias or imprecision. Discuss both direction and magnitude of any potential bias [Pg. 323]
Interpretation 20 Give a cautious overall interpretation of results considering objectives, limitations, multiplicity of analyses, results from similar studies, and other relevant evidence [Pg. 324]
Generalizability 21 Discuss the generalizability (external validity) of the study results. [Pg. 324]
Other Information
The Lifetime Medical Cost Savings From Preventing HIV in the United States by Schackman et al
STROBE Score: 18
Title and Abstract 1 (a) Indicate the study’s design with a commonly used term in the title or the abstract [not present]
(b) Provide in the abstract an informative and balanced summary of what was done and what was found [Pg. 2]
Introduction
Background/rationale 2 Explain the scientific background and rationale for the investigation being reported [Pg. 2] Objectives 3 State specific objectives, including any
pre-specified hypotheses [Pg. 2] Methods
Study design 4 Present key elements of study design early in paper [Pg. 3]
Setting 5 Describe the setting, locations, and relevant dates, including periods of recruitment, exposure, follow-up, and data collection [Pg. 5]
Participants 6 (a) Cohort study: give the eligibility criteria, and the sources and methods of selection of participants. Describe methods of follow-up
Case-Control Study: Give the eligibility criteria, and the sources and methods of case ascertainment and control selection. Give the rationale for the choice of cases and controls
Cross-Sectional study: Give the eligibility criteria, and the sources and methods of selection of participants
(b) Cohort Study: For matched studies, give matching criteria and the number of controls per case [not present] Variables 7 Clearly define all outcomes, exposures,
predictors, potential confounders, and effect modifiers. Give diagnostic criteria, if applicable [Pg. 4]
Data
Sources/measurement* 8 For each variable of interest, give sources of data and details of methods assessment. Describe comparability of assessment methods if there is more than one group [Pg. 4]
Study Size 10 Explain how the study size was arrived at [Pg. 5] Quantitative variables 11 Explain how quantitative variables were handled
in the analyses. If applicable, describe which groupings were chosen and why [Pg. 5]
Statistical Methods 12 (a) Describe all statistical methods, including those used to control for confounding [Pg. 5]
(b) Describe any methods used to examine subgroups and interactions
(c) Explain how missing data were addressed [Pg. 5]
(d) Cohort study: If applicable, explain how loss to follow up was addressed
Case-Controlled study: If applicable, explain how matching cases and controls was addressed
Cross-sectional study: If applicable, describe analytical methods taking account of sampling strategy
(e) Describe any sensitivity analysis [Pg. 5-6] Results
Participants 13* (a) Report the numbers of individuals at each stage of the study- e.g. numbers
potentially eligible, examined for eligibility, confirmed eligible, included in the study, completing follow-up and analyzed [not present]
(b) Give reasons for nonparticipation at each stage [not present]
(c) Consider use of a flow diagram [not present]
Descriptive Data 14* (a) Give characteristics of study participants (e.g. demographic, clinical, social) and information on exposures and potential confounders [Pg. 319- 320]
(b) Indicate the number of participants with missing data for each variable of interest [Pg. 319]
(c) Cohort study: Summarize follow-up time- e.g. average and total amount [Pg. 320] Outcome Data 15* Cohort study: Report numbers of outcome events
Cross-sectional study: Report numbers of outcome events or summary measures Main Results 16 (a) Give unadjusted estimates and, if
applicable, confounder-adjusted estimates and their precision (e.g. 95% CI). Make clear which confounders were adjusted for and why they were included [Pg. 6,7 and 17]
(b) Report category boundaries when continuous variables were analyzed (c) If Relevant, consider translating estimates
of relative risk into absolute risk for a meaningful time period
Other Analyses 17 Report other analyses done- e.g. analyses of subgroups and interactions and sensitivity analyses [Pg. 5 and 7]
Discussion
Key results 18 Summarize key results with reference to study objectives [Pg. 8]
Limitations 19 Discuss limitations of the study, taking into
account sources of potential bias or imprecision. Discuss both direction and magnitude of any potential bias [Pg. 8-9]
Interpretation 20 Give a cautious overall interpretation of results considering objectives, limitations, multiplicity of analyses, results from similar studies, and other relevant evidence [Pg. 9]
Generalizability 21 Discuss the generalizability (external validity) of the study results. [Pg. 9]
Other Information
Funding 22 Give the source of funding and the role of the funders for the present study and, if applicable, of the original study on which the present article is based. [not present]
Reversibility of Glomerular Renal Function Decline in HIV Uninfected Men and Women Discontinuing Emtricitabine- Tenofovir Disoproxil Fumarate Pre-exposure Prophylaxis by Mugwanya et al
STROBE Score:18
Title and Abstract 1 (a) Indicate the study’s design with a commonly used term in the title or the abstract [not present]
balanced summary of what was done and what was found [Pg. 1]
Introduction
Background/rationale 2 Explain the scientific background and rationale for the investigation being reported [Pg. 2] Objectives 3 State specific objectives, including any
pre-specified hypotheses [Pg. 2] Methods
Study design 4 Present key elements of study design early in paper [Pg. 2]
Setting 5 Describe the setting, locations, and relevant dates, including periods of recruitment, exposure, follow-up, and data collection [Pg. 2]
Participants 6 (a) Cohort study: give the eligibility criteria, and the sources and methods of selection of participants. Describe methods of follow-up [Pg. 3]
Case-Control Study: Give the eligibility criteria, and the sources and methods of case ascertainment and control selection. Give the rationale for the choice of cases and controls
Cross-Sectional study: Give the eligibility criteria, and the sources and methods of selection of participants
(b) Cohort Study: For matched studies, give matching criteria and the number of controls per case [Pg. 3-4]
Variables 7 Clearly define all outcomes, exposures, predictors, potential confounders, and effect modifiers. Give diagnostic criteria, if applicable [Pg. 4]
Data
Sources/measurement* 8 For each variable of interest, give sources of data and details of methods assessment. Describe comparability of assessment methods if there is more than one group [Pg. 3-4]
Bias 9 Describe any efforts to address potential sources of bias [not present]
Study Size 10 Explain how the study size was arrived at [Pg.3] Quantitative variables 11 Explain how quantitative variables were handled
in the analyses. If applicable, describe which groupings were chosen and why [Pg. 3]
subgroups and interactions [not present] (c) Explain how missing data were addressed
[Pg. 5
(d) Cohort study: If applicable, explain how loss to follow up was addressed
Case-Controlled study: If applicable, explain how matching cases and controls was addressed
Cross-sectional study: If applicable, describe analytical methods taking account of sampling strategy
(e) Describe any sensitivity analysis [Pg. 4] Results
Participants 13* (a) Report the numbers of individuals at each stage of the study- e.g. numbers
potentially eligible, examined for eligibility, confirmed eligible, included in the study, completing follow-up and analyzed [Pg. 5] (b) Give reasons for nonparticipation at each
stage [Pg. 5]
(c) Consider use of a flow diagram [not present]
Descriptive Data 14* (a) Give characteristics of study participants (e.g. demographic, clinical, social) and information on exposures and potential confounders [Pg. 12]
(b) Indicate the number of participants with missing data for each variable of interest [Pg. 5]
(c) Cohort study: Summarize follow-up time- e.g. average and total amount [Pg.4, 5, and 13 ]
Outcome Data 15* Cohort study: Report numbers of outcome events or summary measures over time [Pg. 5, 6, and 13]
Case control study: Report numbers in each exposure category or summary measures of exposure
Cross-sectional study: Report numbers of outcome events or summary measures Main Results 16 (a) Give unadjusted estimates and, if
(b) Report category boundaries when
continuous variables were analyzed [Pg. 13]
(c) If Relevant, consider translating estimates of relative risk into absolute risk for a meaningful time period
Other Analyses 17 Report other analyses done- e.g. analyses of subgroups and interactions and sensitivity analyses [Pg. 6 and 12]
Discussion
Key results 18 Summarize key results with reference to study objectives [Pg. 7]
Limitations 19 Discuss limitations of the study, taking into
account sources of potential bias or imprecision. Discuss both direction and magnitude of any potential bias [Pg. 8]
Interpretation 20 Give a cautious overall interpretation of results considering objectives, limitations, multiplicity of analyses, results from similar studies, and other relevant evidence [Pg. 7-8]
Generalizability 21 Discuss the generalizability (external validity) of the study results. [Pg. 7-8]
Other Information
Funding 22 Give the source of funding and the role of the funders for the present study and, if applicable, of the original study on which the present article is based. [Pg. 8]
HHS Public Access: Age, baseline kidney function, and medication exposure are associated with declines in creatinine clearance on PrEP: an observational cohort study by Gandhi et al
STROBE Score: 22
Title and Abstract 1 (a) Indicate the study’s design with a commonly used term in the title or the abstract [Pg.1]
(b) Provide in the abstract an informative and balanced summary of what was done and what was found [Pg. 2]
Background/rationale 2 Explain the scientific background and rationale for the investigation being reported [Pg. 2] Objectives 3 State specific objectives, including any
pre-specified hypotheses [Pg. 3] Methods
Study design 4 Present key elements of study design early in paper [Pg. 4]
Setting 5 Describe the setting, locations, and relevant dates, including periods of recruitment, exposure, follow-up, and data collection [Pg. 4]
Participants 6 (a) Cohort study: give the eligibility criteria, and the sources and methods of selection of participants. Describe methods of follow-up [Pg. 4]
Case-Control Study: Give the eligibility criteria, and the sources and methods of case ascertainment and control selection. Give the rationale for the choice of cases and controls
Cross-Sectional study: Give the eligibility criteria, and the sources and methods of selection of participants
(b) Cohort Study: For matched studies, give matching criteria and the number of controls per case [pg. 16-18]
Variables 7 Clearly define all outcomes, exposures, predictors, potential confounders, and effect modifiers. Give diagnostic criteria, if applicable [Pg. 4-5]
Data
Sources/measurement*
8 For each variable of interest, give sources of data and details of methods assessment. Describe comparability of assessment methods if there is more than one group [Pg. 4-5]
Bias 9 Describe any efforts to address potential sources of bias [Pg. 4 and 6]
Study Size 10 Explain how the study size was arrived at [Pg. 4] Quantitative variables 11 Explain how quantitative variables were handled
in the analyses. If applicable, describe which groupings were chosen and why [Pg. 4]
Statistical Methods 12 (a) Describe all statistical methods, including those used to control for confounding [Pg. 4-5]
(b) Describe any methods used to examine subgroups and interactions [Pg. 5]
(d) Cohort study: If applicable, explain how loss to follow up was addressed
Case-Controlled study: If applicable, explain how matching cases and controls was addressed
Cross-sectional study: If applicable, describe analytical methods taking account of sampling strategy
(e) Describe any sensitivity analysis [Pg. 5-6] Results
Participants 13* (a) Report the numbers of individuals at each stage of the study- e.g. numbers
potentially eligible, examined for eligibility, confirmed eligible, included in the study, completing follow-up and analyzed [Pg. 5-6]
(b) Give reasons for nonparticipation at each stage [Pg. 6]
(c) Consider use of a flow diagram [not present]
Descriptive Data 14* (a) Give characteristics of study participants (e.g. demographic, clinical, social) and information on exposures and potential confounders [Pg. 16-18]
(b) Indicate the number of participants with missing data for each variable of interest [Pg. 5]
(c) Cohort study: Summarize follow-up time- e.g. average and total amount [Pg. 5-6] Outcome Data 15* Cohort study: Report numbers of outcome events
or summary measures over time [Pg.16-18 ] Case control study: Report numbers in each exposure category or summary measures of exposure
Cross-sectional study: Report numbers of outcome events or summary measures Main Results 16 (a) Give unadjusted estimates and, if
applicable, confounder-adjusted estimates and their precision (e.g. 95% CI). Make clear which confounders were adjusted for and why they were included [Pg.5, 6, 16-18]
(b) Report category boundaries when
(c) If Relevant, consider translating estimates of relative risk into absolute risk for a meaningful time period [Pg. 16-18] Other Analyses 17 Report other analyses done- e.g. analyses of
subgroups and interactions and sensitivity analyses [Pg. 4-5]
Discussion
Key results 18 Summarize key results with reference to study objectives [Pg. 7-9]
Limitations 19 Discuss limitations of the study, taking into
account sources of potential bias or imprecision. Discuss both direction and magnitude of any potential bias [Pg. 8]
Interpretation 20 Give a cautious overall interpretation of results considering objectives, limitations, multiplicity of analyses, results from similar studies, and other relevant evidence [Pg. 8]
Generalizability 21 Discuss the generalizability (external validity) of the study results. [Pg. 9]
Other Information
Funding 22 Give the source of funding and the role of the funders for the present study and, if applicable, of the original study on which the present article is based. [Pg. 5]
Effects of Emtricitabine/Tenofovir on Bone Mineral Density in HIV-Negative Persons in a Randomized, Double-Blind, Placebo Controlled Trial by Mulligan et al
STROBE Score: 21
Title and Abstract 1 (a) Indicate the study’s design with a commonly used term in the title or the abstract [Pg.572]
bb) Provide in the abstract an informative and balanced summary of what was done and what was found [Pg. 572]
Introduction
Background/rationale 2 Explain the scientific background and rationale for the investigation being reported [Pg. 572-573] Objectives 3 State specific objectives, including any
pre-specified hypotheses [Pg. 573] Methods
paper [Pg. 573]
Setting 5 Describe the setting, locations, and relevant dates, including periods of recruitment, exposure, follow-up, and data collection [Pg. 573]
Participants 6 (a) Cohort study: give the eligibility criteria, and the sources and methods of selection of participants. Describe methods of follow-up [Pg. 573]
Case-Control Study: Give the eligibility criteria, and the sources and methods of case ascertainment and control selection. Give the rationale for the choice of cases and controls
Cross-Sectional study: Give the eligibility criteria, and the sources and methods of selection of participants
(b) Cohort Study: For matched studies, give matching criteria and the number of controls per case
Variables 7 Clearly define all outcomes, exposures, predictors, potential confounders, and effect modifiers. Give diagnostic criteria, if applicable [Pg. 573]
Data
Sources/measurement* 8 For each variable of interest, give sources of data and details of methods assessment. Describe comparability of assessment methods if there is more than one group [Pg. 573]
Bias 9 Describe any efforts to address potential sources of bias [Pg. 573]
Study Size 10 Explain how the study size was arrived at [Pg. 573]
Quantitative variables 11 Explain how quantitative variables were handled in the analyses. If applicable, describe which groupings were chosen and why [Pg. 573] Statistical Methods 12 (a) Describe all statistical methods, including
those used to control for confounding [Pg. 573]
(b) Describe any methods used to examine subgroups and interactions [Pg. 573] (c) Explain how missing data were addressed
[Pg. 573]
(d) Cohort study: If applicable, explain how loss to follow up was addressed
Cross-sectional study: If applicable, describe analytical methods taking account of sampling strategy
(e) Describe any sensitivity analysis [not present]
Results
Participants 13* (a) Report the numbers of individuals at each stage of the study- e.g. numbers
potentially eligible, examined for eligibility, confirmed eligible, included in the study, completing follow-up and analyzed [Pg. 574]
(b) Give reasons for nonparticipation at each stage [Pg. 574]
(c) Consider use of a flow diagram [not present]
Descriptive Data 14* (a) Give characteristics of study participants (e.g. demographic, clinical, social) and information on exposures and potential confounders [Pg. 574]
(b) Indicate the number of participants with missing data for each variable of interest [Pg. 564]
(c) Cohort study: Summarize follow-up time- e.g. average and total amount [Pg. 574-576]
Outcome Data 15* Cohort study: Report numbers of outcome events or summary measures over time [Pg.577]
Case control study: Report numbers in each exposure category or summary measures of exposure
Cross-sectional study: Report numbers of outcome events or summary measures Main Results 16 (a) Give unadjusted estimates and, if
applicable, confounder-adjusted estimates and their precision (e.g. 95% CI). Make clear which confounders were adjusted for and why they were included [Pg. 574-576] (b) Report category boundaries when
continuous variables were analyzed [Pg. 574-576]
Other Analyses 17 Report other analyses done- e.g. analyses of subgroups and interactions and sensitivity analyses [Pg. 574-575]
Discussion
Key results 18 Summarize key results with reference to study objectives [Pg. 577]
Limitations 19 Discuss limitations of the study, taking into
account sources of potential bias or imprecision. Discuss both direction and magnitude of any potential bias [Pg. 578]
Interpretation 20 Give a cautious overall interpretation of results considering objectives, limitations, multiplicity of analyses, results from similar studies, and other relevant evidence [Pg. 578]
Generalizability 21 Discuss the generalizability (external validity) of the study results. [Pg. 578]
Other Information
Funding 22 Give the source of funding and the role of the funders for the present study and, if applicable, of the original study on which the present article is based. [Pg. 578-579]
Recovery of Bone Mineral Density Following Discontinuation of Tenofovir-Based HIV Pre-Exposure Prophylaxis by Glidden et al
STROBE Score: 18
Title and Abstract 1 (a) Indicate the study’s design with a commonly used term in the title or the abstract [Pg.2]
(b) Provide in the abstract an informative and balanced summary of what was done and what was found [Pg. 2]
Introduction
Background/rationale 2 Explain the scientific background and rationale for the investigation being reported [Pg. 3] Objectives 3 State specific objectives, including any
pre-specified hypotheses [Pg. 3] Methods
Study design 4 Present key elements of study design early in paper [Pg. 3-4]
Setting 5 Describe the setting, locations, and relevant dates, including periods of recruitment, exposure, follow-up, and data collection [Pg. 3-4]
and the sources and methods of selection of participants. Describe methods of follow-up [Pg. 4]
Case-Control Study: Give the eligibility criteria, and the sources and methods of case ascertainment and control selection. Give the rationale for the choice of cases and controls
Cross-Sectional study: Give the eligibility criteria, and the sources and methods of selection of participants
(b) Cohort Study: For matched studies, give matching criteria and the number of controls per case [pg.4]
Variables 7 Clearly define all outcomes, exposures, predictors, potential confounders, and effect modifiers. Give diagnostic criteria, if applicable [Pg. 3-4]
Data
Sources/measurement*
8 For each variable of interest, give sources of data and details of methods assessment. Describe comparability of assessment methods if there is more than one group [Pg. 4]
Bias 9 Describe any efforts to address potential sources of bias [Pg. 4]
Study Size 10 Explain how the study size was arrived at [Pg.3-4]
Quantitative variables 11 Explain how quantitative variables were handled in the analyses. If applicable, describe which groupings were chosen and why [not present] Statistical Methods 12 (a) Describe all statistical methods, including
those used to control for confounding [Pg. 4-5]
(b) Describe any methods used to examine subgroups and interactions [Pg. 5]
(c) Explain how missing data were addressed [Pg. 5]
(d) Cohort study: If applicable, explain how loss to follow up was addressed [Pg. 5] Case-Controlled study: If applicable, explain how matching cases and controls was addressed
Cross-sectional study: If applicable, describe analytical methods taking account of sampling strategy
Results
Participants 13* (a) Report the numbers of individuals at each stage of the study- e.g. numbers
potentially eligible, examined for eligibility, confirmed eligible, included in the study, completing follow-up and analyzed [Pg. 5-7]
(b) Give reasons for nonparticipation at each stage [Pg. 7]
(c) Consider use of a flow diagram [not present]
Descriptive Data 14* (a) Give characteristics of study participants (e.g. demographic, clinical, social) and information on exposures and potential confounders [Pg. 5-7]
(b) Indicate the number of participants with missing data for each variable of interest [not present]
(c) Cohort study: Summarize follow-up time- e.g. average and total amount [Pg. 5-6] Outcome Data 15* Cohort study: Report numbers of outcome events
or summary measures over time [Pg.16-17] Case control study: Report numbers in each exposure category or summary measures of exposure
Cross-sectional study: Report numbers of outcome events or summary measures Main Results 16 (a) Give unadjusted estimates and, if
applicable, confounder-adjusted estimates and their precision (e.g. 95% CI). Make clear which confounders were adjusted for and why they were included [Pg.5-7] (b) Report category boundaries when
continuous variables were analyzed [not present]
(c) If Relevant, consider translating estimates of relative risk into absolute risk for a meaningful time period
Other Analyses 17 Report other analyses done- e.g. analyses of subgroups and interactions and sensitivity analyses [Pg. 7]
Discussion