Sharif University of Technology
Scientia IranicaTransactions A: Civil Engineering http://scientiairanica.sharif.edu
A hybrid WOA-CBO algorithm for construction site
layout planning problem
A. Kaveh
a;and M. Rastegar Moghaddam
ba. Centre of Excellence for Fundamental Studies in Structural Engineering, Iran University of Science and Technology, Narmak, Tehran, P.O. Box 16846-13114, Iran.
b. School of Civil Engineering, Iran University of Science and Technology, Narmak, Tehran, P.O. Box 16846-13114, Iran. Received 26 July 2016; received in revised form 7 December 2016; accepted 24 April 2017
KEYWORDS Optimization; Site layout problem; Meta-heuristic algorithms; WOA algorithm; WOA-CBO algorithm.
Abstract. The Whale Optimization Algorithm (WOA) is a recently developed swarm-based optimization algorithm inspired by the hunting behavior of humpback whales. This study attempts to enhance the original formulation of the WOA by hybridizing it with some concepts of the Colliding Bodies Optimization (CBO) in order to improve solution accuracy, reliability, and convergence speed. The new method, called WOA-CBO algorithm, is applied to construction site layout planning problem. To show eciency and performance of the WOA and WOA-CBO in construction site layout problems, three case studies are selected. The rst case is a discrete and equal area facility layout problem that every facility can assign to any location; the second case is an unequal area version of discrete facility layout problem with more constraints; and the last case is a continuous model of construction site layouts. These cases are studied by WOA, CBO, and WOA-CBO, and the results are compared with each other.
© 2018 Sharif University of Technology. All rights reserved.
1. Introduction
Construction Site Layout Planning (CSLP) has been found to be a critical task in construction planning by experts and this task is emphasized on implementing early in the planning phase [1,2].
An appropriate layout of facilities leads to high productivity and project success by minimizing the travel cost, decreasing time and eort spent on material handling, and improving safety, especially for huge construction sites [3,4]. Despite these benets, owners and bidding contractors are unwilling to spend money for eective site layout planning and management. This is because of the competitive bidding structure of the construction industry. Therefore, especially for
*. Corresponding author. Tel.: 021-44202710 E-mail address: [email protected] (A. Kaveh) doi: 10.24200/sci.2017.4212
projects with limited budgets, managers prefer to use their previous experience, ad-hoc rules, and rst-come-rst-serve approach, which leads to ineciency and productivity losses [2,5].
The purpose of designing a construction site lay-out is to assign a set of specic temporary facilities such as job oce, labor residence, warehouse, and batch plants to the appropriate location, while satisfying a set of design requirements and maximize design quality in terms of design preferences such as minimizing the total travel cost between facilities [2,6].
Construction plant site can be modeled into two types, namely, discrete and continuous. In the rst type (discrete), managers identify feasible places for locating facilities; then, these places are divided into rectangular blocks each of which can be assigned to a facility. When costs associated with the ow between facilities are linear with respect to distance traveled and quantity of ow, this type of problem can be formulated as Quadratic Assignment Problem (QAP) [7,8]. The
QAP is a classic combinatorial optimization problem and is well known for its various applications [9]. QAP is known as a non-polynomial hard (NP-hard) problem and due to combinatorial complexity, it cannot be solved exhaustively for reasonably sized layout prob-lems [6]. As an instance, for n facilities, the number of feasible congurations is n! with larger growth than en. This is a huge number, even for a small n. For 10
facilities, the number of possible alternatives is already well over 3,628,000 or for 15 facilities, it is a 12-digit number. In real problems, a project with n = 15 is known as a small project [10]. In the second type (continuous), facilities can be located in every available spaces unlike the previous model and no predetermined locations are considered. This leads to less limitations in nding proper locations for facilities. In spite of the above-mentioned exibility, the searching process of this approach is more complicated; therefore, robust methods are required for this type [11].
The aforementioned complexity has motivated re-searchers to apply various heuristic and meta-heuristic algorithms in order to obtain optimal or near optimal solutions to construction site layout problems.
Li and Love [12] applied the Genetic Algorithm (GA) to nd the optimal solution in a site-level unequal-area facility layout problem; also, Cheung et al. [13] used a GA model for optimizing a site pre-cast yard. Osman et al. [14] proposed a hybrid cad-based algorithm using genetic algorithm in order to optimize the location of the temporary facilities on a site. El-rayes et al. [15] employed multi-objective version of GA for solving a continuous and multi-objective site layout problem.
Many researchers have utilized Particle Swarm Optimization (PSO) in construction site layout eld [2,16-18]. For instance, Zang and Wang [17] proposed a PSO model for an un-equal area static CSLP problem under single objective function. Xu and Li [18] considered a Multi-Objective Particle Swarm Optimization algorithm (MOPSO) to solve a dynamic site layout problem in fuzzy random environment. Lien and Cheng [16] proposed a hybrid Particle-Bee Algo-rithm (PBA) for construction site layout optimization under single objective function to locate facilities in predetermined locations.
Lam et al. [19], Gharaie et al. [20], and Calis and Yuksel [21] also employed another optimization algorithm. They used ant colony to solve a static site layout problem. Ning et al. [22] employed Max-Min Ant System (MMAS), which was one of the standard variants of the Ant Colony Optimization (ACO) algorithms, to solve a dynamic construction site layout planning. Mixed integer programming [23], Tabu search [24], harmony search [4], and colliding bodies optimization [25] are other methods that are used in this eld.
In this study, WOA and WOA-CBO algorithms are proposed to solve construction site layout problems. Whale optimization algorithm was developed by Mir-jalili and Lewis [26]. WOA-CBO algorithm is an en-hanced version of WOA that is introduced in this paper for the rst time. Three case studies are conducted to show the eciency and performance of the WOA and WOA-CBO in both models of construction site layout problem and the obtained results are compared.
2. Meta-heuristic algorithms
In this study, we have used two new meta-heuristic algorithms in construction site layout problems; Whale Optimization Algorithm (WOA) and the hybrid Al-gorithm (WOA-CBO). In this section, rst, whale optimization algorithm is explained and then, a new version of whale optimization algorithm is introduced that is called WOA-CBO algorithm.
2.1. Whale Optimization Algorithm (WOA) Whale optimization algorithm is a novel meta-heuristic algorithm, which mimics the social behavior of hump-back whales. This meta-heuristic algorithm has been developed by Mirjalili and Lewis [26]. In this al-gorithm, the spiral bubble-net feeding maneuver is mathematically modeled to perform optimization. It should be mentioned that bubble-net feeding is a unique behavior that can only be observed in hump-back whales [26]. In order to update the position of the whales during optimization, two behaviors are identied, namely, the shrinking encircling mechanism and the spiral bubble-net feeding maneuver. Since the position of the optimum design in the search space is not known, the basic WOA algorithm assumes that the current best candidate solution is the optimum or is close to the optimum, and the other search agents will update their positions towards the best search agent [26]. The WOA procedure is extracted from [26] and is briey explained in the following.
The WOA starts with a set of random popula-tions. At each iteration, search agents update their positions according to A vector's value. Updating mechanism is detailed in following. This process continues until terminating criterion is satised.
The WOA algorithm has two phases, namely, exploitation and exploration. This algorithm smoothly transits between exploration and exploitation phases. The transition is done due to variation of A vector's value. A vector's value decreases during iterations; half of iterations are assigned to exploration phase, when jAj 1, and the other half are dedicated to exploitation, when jAj < 1. Here, the sign jj indicates the absolute value. The vector A is computed as follows:
~
where ~a linearly decreases from 2 to 0 over the course of iterations and r is a random vector in [0,1].
2.1.1. Bubble-net attacking method (exploitation phase)
In order to model the bubble-net behavior of humpback whales mathematically, two approaches are considered, namely, shrinking encircling mechanism and spiral updating position. Since the humpback whales swim around the prey within a shrinking circle and along a spiral-shape path simultaneously, WOA assumes that there is a probability of 50% to choose between these two behaviors. Shrinking encircling mechanism is modeled in the following formulae:
~C = 2:~r; (2)
~
D = ~C: ~Xbest X~ ; (3)
~
Xnew= ~X
best A: ~~D; (4)
where ~Xnew and ~X are new position and previous
position of whales, respectively; ~Xbest is the position
vector of the best solution obtained so far; A and C are coecient vectors; and jj is the absolute value.
Additionally, spiral-shape movement of whales is simulated in the following formulae:
~
D0 = ~Xbest X~ ; (5)
~
Xnew = ~D0:ebl: cos(2l) + ~X
best; (6)
where b is a constant that denes the spiral shape of movement and l is a random number in [{1,1].
2.1.2. Search for prey (exploration phase)
When jAj 1; exploration phase is in progress. WOA updates the position of a whale in the exploration phase according to a randomly chosen whale instead of the best search agent. Thus, the new position is computed by the following formula:
~
D = ~C: ~Xrand X~ ; (7)
~
Xnew = ~X
rand A: ~~ D: (8)
2.2. Colliding Bodies Optimization (CBO) Colliding Bodies Optimization (CBO) is a recently developed population-based meta-heuristic algorithm that is inspired by one-dimensional collision between two bodies, Kaveh and Mahdavi [27]. The CBO algorithm starts with a random population of Col-liding Bodies (CB). Each CB is known as a solution candidate. The masses of these bodies are calculated according to their objective function values. The CBs are sorted in an ascending order of their tness values, and then divided into two equal groups, namely, stationary and moving. The lower half of the CBs are in the stationary group and the rest of them are in the moving one. The moving CBs move towards stationary CBs and a collision happens between pairs of CBs. This causes their positions to be updated. The repetition of these actions leads to reaching the optimal position in the search space.
2.3. WOA-CBO Algorithm
In order to modify and improve the updating mech-anism of the standard WOA, a modied version of the WOA is considered. This proposed modication is inspired by the CBO [27] and ECBO [28] algorithms.
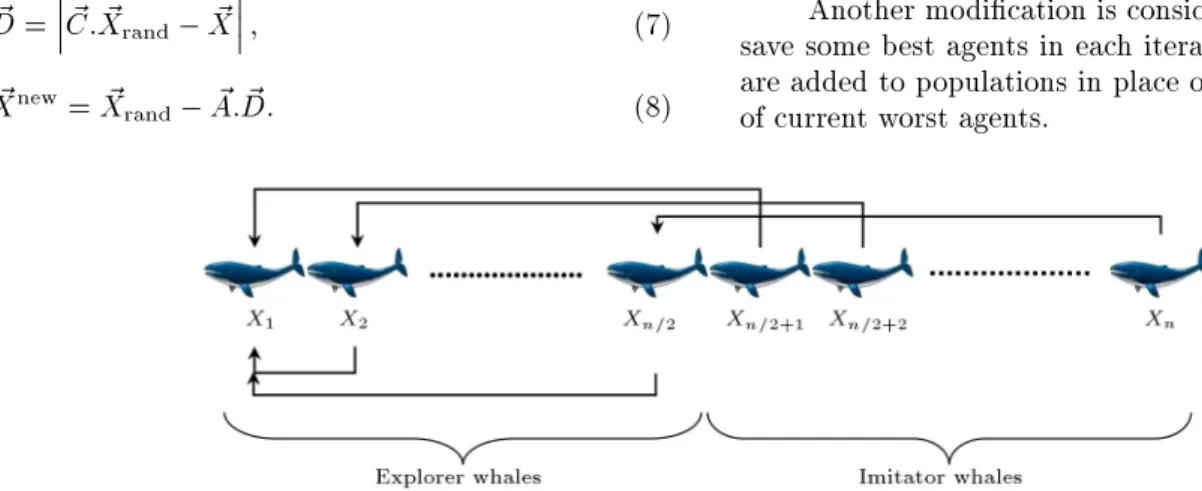
In this modied version of the WOA, all whales are sorted according to their objective function values in ascending order. Then, whales are divided into two equal groups, namely, explorer and imitator whales. The lower half of whales are called explorer whales; these whales are good agents. The upper half of whales are called imitator whales. Now, unlike in the standard WOA, all search agents do not update their positions towards only the best search agent; instead, explorer whales update their positions towards the current best whale to nd better solutions and imitator whales update their position towards the lower half to improve their position. In other words, each imitator whale follows its pair in explorer group and improves its position. Whales group and pair of imitator whales are shown in Figure 1.
Another modication is considering a memory to save some best agents in each iteration. These agents are added to populations in place of the same number of current worst agents.
The owchart of the WOA-CBO is shown in Figure 2 and the steps involved are given as follows:
Step 1: Initialization of the whale population. The initial positions of all whales are determined ran-domly in the search space.
Step 2: Evaluation of tness of whales. Fitness value of each whale is calculated according to objective function of optimization problem.
Step 3: Saving. The considered memory is updated
Figure 2. Flowchart of the WOA-CBO.
in each iteration according to the calculated tness values. Afterwards, members of updated memory are added to the population and the same number of worst whales are deleted.
Step 4: Creating groups. All whales are sorted according to their tness values in ascending order. Then, they are divided into two equal groups, namely, explorer and imitator.
Step 5: Updating positions of whales. For each whale, A and C are calculated by Eqs. (1) and (2), respectively. If p < 0:5, explorer and imitator whales are updated by Eqs. (9) and (10), respectively. p is a random value between 0 and 1:
~ Xnew i = 8 > > > > > > > > > > < > > > > > > > > > > : 8 > > < > > : ~
D = ~C: ~Xbest X~i
if jAj < 1 ~
Xnew
i = ~Xbest A: ~~D
8 > > < > > : ~
D = ~C: ~Xrand X~
if jAj 1 ~
Xnew
i = ~Xrand A: ~~ D
i = 1; 2; :::;n2; (9)
~ Xnew i = 8 > > > > > > > > > > < > > > > > > > > > > : 8 > > < > > : ~
D = ~C: ~Xi n 2 X~i
if jAj < 1 ~
Xnew
i = ~Xi n 2 A: ~~ D
8 > > < > > : ~
D = ~C: ~Xrand X~
if jAj 1 ~
Xnew
i = ~Xrand A: ~~ D
i = n2 + 1;n2 + 2; :::; n; (10) where ~Xnew
i and ~Xi are new position and previous
position of whales, respectively; ~Xbest is the position
vector of the best solution obtained so far; A and C are coecient vectors; and jj is the absolute value.
If p 0:5, explorer and imitator whales are updated by Eqs. (11) and (12):
~ Xnew
i =
( ~
D0= ~Xbest X~i
~ Xnew
i = ~D0:ebl: cos(2l) + ~Xbest
i = 1; 2; :::;n2; (11)
~ Xnew
i =
( ~
D0= ~Xi n 2 X~i
~
Xnew
i = ~D0:ebl: cos(2l) + ~Xi n 2
i = n 2 + 1;
n
2 + 2; :::; n; (12) where b is a constant that denes the spiral shape of movement and l is a random number in [{1,1].
Step 6: Termination criterion check. The optimiza-tion process is terminated after a xed number of iterations. If this criterion is not satised, we should go to Step 2.
3. Application of the algorithms
As mentioned before, the discrete model of construc-tion site layout problems is concerned with assigning a number of predetermined facilities (n) uniquely to a number of predetermined locations (m); thus, the number of locations should be equal to or greater than the number of facilities [12]. The other type of site layout problem is continuous model, in which facilities can be located in any available spaces.
For implementing WOA and WOA-CBO in dis-crete model, each search agent (whale) is considered as a solution candidate. These whales move in n dimensional search space to nd optimum solution; The number of search space's dimensions is equal to the number of facilities and each dimension is assigned to a particular facility. The value of dimensions represents the assigned number of locations to the corresponding facilities. Since every location is capable of containing only one facility, dimensions of each whale should not have the same value; violation of this point makes the solution infeasible. Therefore, some attention in updating mechanism is required for this type of problems. In continuous models, the position of each facility is represented by coordinates of the center of gravity of the facilities (Xi; Yi). Thus, the number of
variables of each whale is twice the number of facilities. An important point in this type of modelling is that facilities should be located within boundaries of the site and they should not have overlap with each other [15].
4. Case studies of construction site layout In order to show the eciency and performance of
the WOA and WOA-CBO in construction site layout problems, three case studies are selected. The rst case is an equal area facility layout problem in which every facility could be assigned to any location. The second one is an unequal area facility layout problem with more constraints. These two case studies are examples of discrete model. As an example of continuous model, a third case study is provided. These case studies are solved by WOA and WOA-CBO, and the results are compared. The proposed algorithms are coded in MATLAB R2011a and executed on Intel®CoreTM
i7 processor(1.73 GHz) and 4 GB RAM under the windows 10 Home 64-bit operating system. The detailed case studies and the results are as follows. 4.1. Case study 1
This case study is taken from Ref. [29] and it is known as an equal area problem. The purpose of this problem is nding the optimal arrangement for placing 11 facilities into 11 pre-determined locations on the site. Table 1 shows the 11 facilities and their notes. As it can be seen, the main gate and side gate are xed on the pre-determined locations. The travel distance between predetermined locations and trip frequency on a single day between facilities are presented in Tables 2 and 3, respectively.
The objective of this case is to minimize the total travel distance of the site personnel between the facilities. The total travel distance is calculated by Eq. (13):
Minimize T D =
n
X
i=1 n
X
j=1 n
X
l=1 n
X
k=1
xikxjlfijdkl;
Subject to Xn
i=1
xij = 1; n
X
j=1
xij= 1; (13)
where n is number of facilities. xik = 1 when the
facility i is assigned to the location k; otherwise, it is
Table 1. Facilities and their notes for Case 1.
Index number Facilities Note
1 Site oce |
2 False work workshop |
3 Labor residence |
4 Storeroom 1 |
5 Storeroom 2 |
6 Carpentry workshop |
7 Reinforcement steel workshop |
8 Side gate Fixed to 1
9 Electrical, water, and other utilities control room |
10 Concrete batch workshop |
Table 2. Travel distance between pre-determined locations. Location
Distance L1 L2 L3 L4 L5 L6 L7 L8 L9 L10 L11
Location
L1 0 15 25 33 40 42 47 55 35 30 20
L2 15 0 10 18 25 27 32 42 50 45 35
L3 25 10 0 8 15 17 22 32 52 55 45
L4 33 18 8 0 7 9 14 24 44 49 53
L5 40 25 15 7 0 2 7 17 37 42 52
L6 42 27 17 9 2 0 5 15 35 40 50
L7 47 32 22 14 7 5 0 10 30 35 40
L8 55 42 32 24 17 15 10 0 20 25 35
L9 35 50 52 42 37 35 30 20 0 5 15
L10 30 45 55 49 42 40 35 25 5 0 10
L11 20 35 45 53 52 50 40 35 15 10 0
Table 3. Trip frequency between facilities. Trip
frequency Facility
F1 F2 F3 F4 F5 F6 F7 F8 F9 F10 F11
Facility
F1 0 5 2 2 1 1 4 1 2 9 1
F2 5 0 2 5 1 2 7 8 2 3 8
F3 2 2 0 7 4 4 9 4 5 6 5
F4 2 5 7 0 8 7 8 1 8 5 1
F5 1 1 4 8 0 3 4 1 3 3 6
F6 1 2 4 7 3 0 5 8 4 7 5
F7 4 7 9 8 4 5 0 7 6 3 2
F8 1 8 4 1 1 8 7 0 9 4 8
F9 2 2 5 8 3 4 6 9 0 5 3
F10 9 3 6 5 3 7 3 4 5 0 5
F11 1 8 5 1 6 5 2 8 3 5 0
equal to 0; xjl has the same concept. Coecient fij is
the frequency of trips made by construction personnel between facilities i and j per day. Coecient dkl is the
distance between the locations k and l. 4.2. Result and discussion for Case 1
This case study was adapted from 50 independent op-timization runs through 200 iterations with population size of 50 by WOA and WOA-CBO. This was done to get valid statistical results (see Table 4). In Table 4, it can be seen that the average, worst, and standard devi-ations of the WOA-CBO are 12558, 12756, and 43.28, respectively, which are better than those of WOA. These results indicate that the considered modication has been rewarding and better solution with higher stability has been obtained.
As a comparison between WOA-CBO and CBO, the performance of the WOA-CBO is nearly similar to
that of the CBO. The best solution obtained in this study is 12546, which is reduced by 16.86% compared to that in the Ref. [29]. Table 5 shows a comparison between the present work and Ref. [29] for Case 1. Figure 3 compares the convergence curves of WOA, CBO, and WOA-CBO. As can be seen in this gure, WOA-CBO algorithm has higher convergence speed than the other algorithms, especially WOA.
4.3. Case study 2
This case is an unequal area version of the rst case and is taken from [12]. In this case, 3 facilities among 11 facilities are too large and cannot be placed in smaller locations. Locations 7 and 8 are assumed to be smaller than the others. Table 6 shows the 11 facilities and their notes. Travel distance between locations, trip frequency, and objective function are similar to those in Case 1.
Table 4. Results of 50 independent runs for Case 1. Algorithm Best Average Worst
Dierence best-average
solution%
Dierence best-worst solution%
Std. dev
WOA 12546 12567 12768 0.167 1.769 59.89
CBO [25] 12546 12558 12768 0.096 1.769 45.51
WOA-CBO 12546 12558 12756 0.096 1.674 43.28
Table 5. A comparison between present work and Ref. [29] for Case 1.
Algorithms Total distance Best layout
F1 F2 F3 F4 F5 F6 F7 F8 F9 F10 F11
WOA 12546 9 11 4 5 7 6 3 1 2 8 10
WOA-CBO 12546 9 11 4 5 7 6 3 1 2 8 10
GA [29] 15090 11 5 8 7 2 9 3 1 6 4 10
Current study.
Table 6. Facilities and notes for Case 2.
Index number Facilities Note
1 Site oce Large size
2 False work workshop
-3 Labor residence Large size
4 Storeroom 1
-5 Storeroom 2
-6 Carpentry workshop
-7 Reinforcement steel workshop
-8 Side gate Fixed to 1
9 Electrical, water, and other utilities control room
-10 Concrete batch workshop Large size
11 Main gate Fixed to 10
Figure 3. Convergence curves of WOA, CBO, and WOA-CBO for Case 1.
4.4. Result and discussion for Case 2
This case study has also adapted 50 independent opti-mization runs through 200 iterations with population size of 50 by WOA and WOA-CBO. Statistical results of this case are prepared in Table 7. From Table 7, it
can be observed that the average, worst, and standard deviations of WOA-CBO are 12648, 12768, and 52.84, respectively, which are better than those of WOA. These results indicate that the considered modication has also been rewarding in unequal area problem, which has more constraints. The best solution obtained in this study is 12606, which is reduced to 16.85% compared to [12]. Table 8 shows a comparison between the present work and Ref. [12] for Case 2. The convergence curves of the WOA and WOA-CBO are presented in Figure 4. These curves also emphasize that WOA-CBO has lower speed than WOA.
4.5. Case study 3
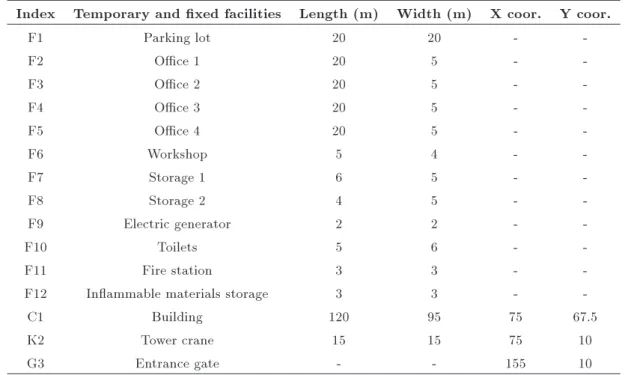
As we mentioned previously, this case study is an example for continuous model and is extracted from Ref. [15]. Site form and its dimensions are depicted in Figure 5. Temporary and xed facilities, associated dimensions, and center coordinate of the xed facilities are listed in Table 9. The purpose of the case study
Table 7. Results of 50 independent runs for Case 2. Algorithm Best Average Worst
Dierence best-average
solution%
Dierence best-worst solution%
Std. dev
WOA 12606 12665 12808 0.47 1.60 60.53
CBO 12606 12650 12706 0.35 0.79 54.04
WOA-CBO 12606 12648 12702 0.33 0.76 52.84
Table 8. A comparison between the present work and Ref. [12] for Case 2.
Algorithms Total distance Best layout
F1 F2 F3 F4 F5 F6 F7 F8 F9 F10 F11
WOA 12606 11 9 5 6 8 3 7 1 4 2 10
WOA-CBO 12606 11 9 5 6 8 3 7 1 4 2 10
GA [12] 15160 11 5 9 7 2 8 3 1 6 4 10
Current study.
Figure 4. Convergence curves of WOA, CBO, and WOA-CBO for Case 2.
is to locate the temporary facilities in the available spaces properly to minimize the travel cost, which is calculated by Eq. (14):
Minimize T C =n 1X
i=1 n
X
j=i+1
(Cij dij); (14)
where Cij represents the travel cost per unit between
facilities i and j that are presented in Table 10 and dij
is the distance between these facilities. 4.6. Result and discussion for Case 3
This case is more complicated than the previous two cases and it can be a better criterion for evaluating capability and performance of algorithms. Thus, WOA, CBO, and WOA-CBO are implemented on this problem.
Statistical results of this case study, after 30 inde-pendent runs through 20,000 iterations with population size of 200, are provided in Table 11. These results show that WOA-CBO has found the least cost layout,
Figure 5. Site form and dimensions.
and has better average and the worst result among the other algorithms. Although the best result of the WOA is better than that of CBO, its average and standard deviation are worse, and by considering our modications, the weaknesses are improved in WOA-CBO algorithm. The best obtained solution cost is 8477.4 and the corresponding layout is shown in Figure 6. The convergence curves of the WOA, CBO, and WOA-CBO for nding the best layout are presented in Figure 7. As it can be seen in this gure, WOA-CBO nds better layout, and it has an acceptable convergence speed.
5. Conclusions
In this study, the application of a recently developed meta-heuristic algorithm, known as whale optimization algorithm, was proposed to solve construction site
Table 9. Temporary and xed facilities and the associated data.
Index Temporary and xed facilities Length (m) Width (m) X coor. Y coor.
F1 Parking lot 20 20 -
-F2 Oce 1 20 5 -
-F3 Oce 2 20 5 -
-F4 Oce 3 20 5 -
-F5 Oce 4 20 5 -
-F6 Workshop 5 4 -
-F7 Storage 1 6 5 -
-F8 Storage 2 4 5 -
-F9 Electric generator 2 2 -
-F10 Toilets 5 6 -
-F11 Fire station 3 3 -
-F12 Inammable materials storage 3 3 -
-C1 Building 120 95 75 67.5
K2 Tower crane 15 15 75 10
G3 Entrance gate - - 155 10
Table 10. Travel cost per unit between facilities.
Cij Facility j
Facility i F1 F2 F3 F4 F5 F6 F7 F8 F9 F10 F11 F12 C1 K1 G1
F1 0 - - -
-F2 4 0 - - -
-F3 4 7.5 0 - - -
-F4 4 7.5 7.5 0 - - -
-F5 4 5.5 5.5 2.5 0 - - -
-F6 1.5 1 1 1 1 0 - - -
-F7 1.5 1 1 1 1 9.5 0 - - -
-F8 1.5 1 1 1 1 9.5 6.5 0 - - -
-F9 1.5 2 1 3 3 3 3 3 0 - - -
-F10 1.5 7.5 7.5 7.5 7.5 6.5 6.5 6.5 1 0 - - - -
-F11 1.5 1 1 1 1 1 1 1 1 1 0 - - -
-F12 1.5 1 1 1 1 3.5 1 1 3.5 1 1 0 - -
-C1 1.5 3.5 3.5 3.5 3.5 6.5 4.5 4.5 5.5 3 1 4.5 0 -
-K1 0 7.5 5.5 7.5 7.5 9.5 9.5 9.5 0 0 1 4.5 5 0
-G1 1.5 0 0 0 0 3 7 7 0 0 0 1 0 0 0
Current study.
Table 11. Results of 30 independent runs for Case 3. Algorithm Best Average Worst
Dierence best-average
solution%
Dierence best-worst solution%
Std. dev
WOA 9049.2 12424 16830 37.29 85.98 2531.7
CBO 10605 12123 13146 14.31 23.96 351.46
Figure 6. The lowest cost layout obtained.
Figure 7. Convergence curves of WOA, CBO, and WOA-CBO for Case 3.
layout problem. This algorithm was inspired by the hunting behavior of humpback whales. In order to modify and improve the updating mechanism of the standard WOA, a hybrid WOA-CBO was introduced in this paper. This new version of WOA was called WOA-CBO. These algorithms were applied to three case studies that contained both discrete and continuous models. The results of this experiment veried that the proposed approach was applicable for construction site layout problem. Also, a comparison between WOA and WOA-CBO indicated that the proposed modication was ecient and obtained better solution with more stability. Thus, it can be concluded that these algorithms are competitive with other meta-heuristic algorithms and can be used in construction site layout problems.
References
1. Ning, X., Lam, K.C., and Lam, M.C.K. \A decision-making system for construction site layout planning", Automat. Construct., 20(4), pp. 459-473 (2011).
2. Adrian, A.M. Utamima, A., and Wang, K.-J. \A comparative study of GA, PSO and ACO for solving construction site layout optimization", KSCE J. Civil Eng., 19(3), pp. 520-527 (2014).
3. Sadeghpour, F. Moselhi, O., and Alkass, S.T. \Computer-aided site layout planning", J. Construct. Eng. Manag., 132(2), pp. 143-151 (2006).
4. Kaveh, A. and Shakouri Mahmud Abadi, A. \An adapted harmony search based algorithm for facility layout optimization", Int. J. Civil Eng., 10(1), pp. 1-6 (2012).
5. Cheng, M.-Y. and Connor, J.T.O. \Site layout of construction temporary facilities using an enhanced-geographic information system (GIS)", Automat. Con-struct., 3(1), pp. 11-19 (1994).
6. Yeh, I.-C. \Architectural layout optimization using an-nealed neural network", Automat. Construct., 15(4), pp. 531-539 (2006).
7. Tate, D.M. and Smith, A.E. \Unequal-area facility layout by genetic search", IIE Trans., 27(4), pp. 465-472 (1995).
8. Wang, M.J. Hu, M.H., and Ku, M.Y. \A solution to the unequal area facilities layout problem by genetic al-gorithm", Comput. Indust., 56(2), pp. 207-220 (2005).
9. Azarbonyad, H. and Babazadeh, R. \ A genetic algorithm for solving quadratic assignment problem (QAP)", arXiv:1405.5050, pp. 2-5 (2014).
10. Yeh, I.-C. \Construction-site layout using annealed neural network", J. Comput. Civil Eng., 9, pp. 201-208 (July 1995).
11. Sadeghpour, F. and Andayesh, M. \The constructs of site layout modeling: an overview", Canadian J. Civil Eng., 42(3), pp. 199-212 (2015).
12. Li, H. and Love, P.E. \Genetic search for solving con-struction site-level unequal-area facility layout prob-lems", Automat. Construct., 9(2), pp. 217-226 (2000).
13. Cheung, S.O., Tong, T.K.L., and Tam, C.M. \Site pre-cast yard layout arrangement through genetic al-gorithms", Automat. Construct., 11, pp. 35-46 (2002).
14. Osman, H.M., Georgy, M.E., and Ibrahim, M.E. \A hybrid CAD-based construction site layout planning system using genetic algorithms", Automat. Con-struct., 12(6), pp. 749-764 (2003).
15. El-rayes, K., Asce, M., and Khalafallah, A. \Trade-o between safety and cost in planning construction site layouts", J. Construct. Eng. Manag., pp. 1186-1195 (November 2005).
16. Lien, L.-C. and Cheng, M.-Y. \A hybrid swarm intel-ligence based particle-bee algorithm for construction site layout optimization", Expert Syst. Appl., 39(10), pp. 9642-9650 (2012).
17. Zhang, H. and Wang, J.Y. \Particle swarm optimiza-tion for construcoptimiza-tion site unequal-area layout", J. Construct. Eng. Manag., 134(9), pp. 739-748 (2008).
18. Xu, J. and Li, Z. \Multi-objective dynamic construc-tion site layout planning in fuzzy random environ-ment", Automat. Construct., 27, pp. 155-169 (2012).
19. Lam, K., Ning, X., and Ng, T. \The application of the ant colony optimization algorithm to the construc-tionsite layout planning problem", Construct. Manag. Economics, 25(4), pp. 359-374 (2007).
20. Gharaie, E., Afshar, A., and Jalali, M. \Site layout optimization with ACO algorithm", Proceedings of the 5th WSEAS, pp. 90-94 (2006).
21. Calis, G. and Yuksel, O. \An improved ant colony optimization algorithm for construction site layout problems", J. Build. Construct. Plan. Res., 3, pp. 221-232 (2015).
22. Ning, X., Lam, K.-C., and Lam, M.C.-K. \Dy-namic construction site layout planning using max-min ant system", Automat. Construct., 19(1), pp. 55-65 (2010).
23. Wong, C.K., Fung, I.W.H., and Tam, C.M. \Compar-ison of using mixed-integer programming and genetic algorithms for construction site facility layout plan-ning", J. Construct. Eng. Manag., 136(10), pp. 1116-1128 (2010).
24. Liang, L.Y. and Chao, W.C. \The strategies of tabu search technique for facility layout optimization", Au-tomat. Construct., 17(6), pp. 657-669 (2008).
25. Kaveh, A., Khanzadi, M., Alipour, M., and Rastegar Moghaddam, M. \Construction site layout planning problem using two new meta-heuristic algorithms", Iranian J. Sci. Technol.; Trans. Civil Eng., 40(4), pp. 263-275 (2016).
26. Mirjalili, S.A. and Lewis, A. \The whale optimization algorithm", Adv. Eng. Softw., 95, pp. 51-67 (2016).
27. Kaveh, A. and Mahdavi, V.R. \Colliding bodies op-timization: A novel meta-heuristic method", Comput. Struct., 139, pp. 18-27 (July 2014).
28. Kaveh, A. and Ilchi Ghazaan, M. \Enhanced colliding bodies optimization for design problems with continu-ous and discrete variables", Adv. Eng. Softw., 77, pp. 66-75 (2014).
29. Li, H. and Love, P.E.D. \Site-level facilities layout using genetic algorithms", J. Comput. Civil Eng., pp. 227-231 (October 1998).
Biographies
Ali Kaveh was born in 1948 in Tabriz, Iran. After graduation from the Department of Civil Engineering at the University of Tabriz in 1969, he continued his studies on Structures in Imperial College of Science and Technology at London University, and received his MSc, DIC and PhD degrees in 1970 and 1974, respectively. He then joined the Iran University of Science and Technology. Professor Kaveh is the author of 550 papers published in international journals and 150 papers presented at national and international conferences. He has authored 23 books in Farsi and 7 books in English published by Wiley, RSP, American Mechanical Society, and Springer.
Mohammad Rastegar Moghaddam was born in 1991, in Yazd. He is MSc candidate in the Department of Civil Engineering at Iran University of Science and Technology, Iran. He received his BSc degree in Civil Engineering from Iran University of Science and Technology in 2014. His main expertise and experience are in the eld of construction management, labor productivity, and project scheduling by using optimization and simulation methods.


![Table 5. A comparison between present work and Ref. [29] for Case 1.](https://thumb-us.123doks.com/thumbv2/123dok_us/8374778.2224466/7.892.130.743.340.447/table-comparison-present-work-ref-case.webp)