A
Research to Develop
Community Needs Index
Visit PD&R’s Web Site
www.huduser.org
to find this report and others sponsored by
HUD’s Office of Policy Development and Research (PD&R).
Other services of HUD USER, PD&R’s Research Information Service, include listservs;
special interest reports, bimonthly publications (best practices, significant studies from other sources); access to public use databases; hotline 1-800-245-2691 for help accessing the information you need.
Research to Develop
A
Community Needs Index
Prepared for
U.S. Department of Housing and Urban Development Office of Policy Development and Research
Prepared by Econometrica, Inc.
Bethesda, MD Frederick J. Eggers, Ph.D.
Acknowledgements
Econometrica, Inc. conducted this research under contract to the U.S. Department of Housing and Urban Development (HUD). Fred Eggers was the Principal Investigator; Alex Thackeray and Fouad Moumen compiled and analyzed the data; and Larry Campbell edited the report.
The Econometrica Team benefited from the assistance provided by many persons. James Broughman, George Galster, Garth Taylor, and Christopher Walker served as consultants to the project and contributed many helpful ideas and thoughtful criticisms. Kurt
Usowski, Craig Davis, and Ian Keith at HUD provided data and suggestions on how to combine data from different sources. Harold Bunce, John Carruthers, Stanley Gimont, Michael Hollar, Derek Hyra, and Kevin Neary of HUD contributed useful comments on the first two drafts of the report; the final report is much better because of their insights. The Team also appreciates the thoughts and opinions provided by the participants at the Orientation Meeting and at the Expert Panel Meeting.
Special thanks are due to two people at HUD who made extraordinary contributions to the success of this research. Marina Myhre served as the Government Technical
Representative. Her guidance, comments, and attentive management were crucial to the success of the research. Todd Richardson shared his knowledge and experience
generously with the Team and also furnished the 2000 census data used in the analysis. The U.S. Postal Service vacancy series used as a proxy for abandonment were created by Todd Richardson.
FOREWORD
In order to understand the most efficient and fair way to allocate Community Development Block Grant funds, HUD staff since 1976 have worked on developing measures of community needs. This study, Research to Develop a Community Needs Index, marks a further advance by developing an index that not only shows current needs but also can be used to demonstrate changing community conditions.
The study draws on a number of public databases, including the American Community Survey (ACS). It tests the feasibility of relying on the ACS for annual information about community needs, and it devises a method to compare those needs over time. Specifically this study used 2005 ACS data and other readily-available sources in order to create an index of community needs. It then applied that index to measure changes in community needs since 2000.
This study also develops and implements an innovative index of real fiscal capacity, which measures the extent to which communities are capable of dealing with their problems without federal assistance. To construct this index, the study compares the ability of cities to raise revenue from various sources. The “real fiscal capacity” index ranks 234 cities on the real resources that they could have used in order to solve their community needs in 2005.
The study finds that it is possible to combine a “needs” index and a “fiscal capacity” index for the purpose of measuring relative need for CDBG and other federal support. This study was limited to exploratory and methodological issues.
Darlene F. Williams
Assistant Secretary for Policy Development and Research
Contents
Executive Summary ... viii
Identifying and Measuring Community Needs... ix
Finding Common Patterns among the Needs Indicators ... xi
Comparing Community Needs across Time... xiii
Measuring Fiscal Capacity ... xv
Implications for Future Analysis ... xvi
Recommendations for Future Work ... xviii
1. Introduction... 1
1.1. HUD’s Mission and an Index of Community Needs... 1
1.2. Policy Context ... 2
1.3. History of Research into Community Needs ... 3
1.4. Project Goals... 4
1.5. Overview of Methodology and Organization of the Report ... 5
2. Indicators of Community Needs ... 9
2.1. Data Issues in Building an Index of Community Needs... 9
2.1.1. Type and Size of Community ... 9
2.1.2. Sources of Data Used to Measure City Needs... 10
2.1.3. Time Consistence of Needs Indicators ... 11
2.2. Selection of Needs Indicators ... 11
2.2.1. How the Needs Indicators Were Selected ... 11
2.2.2. Needs Indicators ... 12
2.2.3. Other Indicators Considered But Not Used ... 18
2.3. Review of Indicators Prior to Index Building... 18
2.3.1. Correlations Among the Needs Indicators... 18
2.3.2. Analysis of Means ... 21
2.3.3. Analysis of the Crime Variables... 22
2.4. Assessment of Needs Indicators ... 23
3. Factor Analysis, Dimensions of Need, and a Community Needs Index ... 25
3.1. A Brief Introduction to Factor Analysis ... 27
3.2. Application of Factor Analysis to Needs Indicators... 29
3.2.1 Anticipated Results from Factor Analysis... 29
3.2.2. Initial Results from Factor Analysis ... 30
3.2.3. Testing the Robustness of the Factor Analysis... 31
3.2.4. Culling the Needs Indicators ... 33
3.2.5. Derivation of the Final Factors Used in this Report ... 33
Contents
(continued)
3.3. Comparing Needs at Different Times... 37
3.4. Creating a Single-Valued Index of Community Needs ... 39
3.4.1. Alternative Indices... 39
3.4.2. Comparisons of Scores on Alternative Indices... 41
3.4.3. Transformation of the Factor Score Functions into Functions of Needs Indicators... 44
3.5. Summary of Factor Analysis ... 45
4. Community Needs in 2000 and 2005 ... 47
4.1. Changes in Community Needs for Cities with Populations of 65,000 or More 47 4.2. Comparison of Scores in 2000 and 2005 on Factor 1... 49
4.3 Comparison of Scores in 2000 and 2005 on Factor 2... 53
4.4. Comparison of Scores in 2000 and 2005 on Factor 3... 56
4.5. Comparison of Scores in 2000 and 2005 on the Equal Weight Index... 59
4.6. Summary... 62
5. Measuring Fiscal Capacity... 65
5.1. General Approach... 65
5.2. Variables Used to Measure Fiscal Capacity ... 67
5.3. Variations in Fiscal Capacity... 70
5.4. Combining Need and Fiscal Capacity ... 73
5.4.1. Background... 73
5.4.2. Simple Options for Combining the Measures ... 74
5.5. An Index of Needs Adjusted for Capacity... 76
5.6. Summary... 78
6. Implications ... 79
6.1. ACS Data and Community Needs ... 79
6.2. A Single-Valued Index of Community Needs... 81
6.3. Intertemporal Comparisons of Needs ... 82
6.4. Factor Analysis Involving Different Geographies... 83
6.5. Measuring Progress at the Tract Level ... 84
6.6. Measuring Fiscal Capacity ... 86
6.7. Changing City Boundaries and Cost-of-Living Differences ... 87
Contents
(continued)
Appendix A—Supplemental Tables ... A-1 Appendix B—Using Regression Analysis to Develop a Community Needs Index.. B-1
B.1. General Concept, Model Specification, and Difficulties ... B-1 B.1.1. General Concept... B-1 B.1.2. Model Specification ... B-3 B.1.3. Difficulties ... B-4 B.2. Implementing the “Hedonic” Approach for City-Level Needs Indicators ... B-4 B.2.1. Choice of Database ... B-4 B.2.2. The Tract-Level Variables ... B-5 B.2.3. Variation Across Core-Based Statistical Areas ... B-8 B.2.4. City-Level Needs Indicators ... B-8 B.3. Modified Specification of the Hedonic Model ... B-10 B.4. Interpreting the Coefficients of City-Level Needs Indicators... B-12 B.5. Use of the “Hedonic” Approach for Assessing Importance of Factors ... B-13 B.6. Use of Information on City-Level Variables to Create Factor Weights ... B-15 B.6.1. The Relationship between Beta Coefficients and Standardized Scoring Coefficients ... B-15 B.6.2. Extension of Experimental Use of Beta Coefficients to Guide Selection of Weights... B-16 B.7. Insights Gained from the Hedonic-type Analysis ... B-17
Appendix C—Comparison of Factor Analysis for 2000 with Richardson Factor Analysis for 2000 ... C-1
C.1. Comparison of Index Structure ... C-1 C.2. Comparison of Need Scores... C-3 C.3. Conclusion ... C-5
Tables
Table 1. Needs Indicators for Developing an Index of Community Needs... 13
Table 2. Comparison of Means for the Needs Indicators ... 21
Table 3. Rotated Factor Loadings for Final Factor Analysis, Each Factor Sorted by Loading ... 35
Table 4. Correlations among Factor Scores... 37
Table 5. Alternative Single-Valued Community Needs Indices... 40
Table 6. Basic Statistics on the Alternative Indices... 41
Table 7. Correlations Among the Alternative Indices ... 42
Table 8. Comparison of Scores between Index 1 and Indices 2, 3, and 4 for 370 Cities 43 Table 9. Transformation of Factor-Scoring Coefficients into Scoring Coefficients for Needs Indicators... 45
Table 10. Average Factor Scores and Average Equal Weight Index Scores in 2000 and 2005... 48
Table 11. Changes in Factor 1 Scores between 2000 and 2005, by Region and Population ... 49
Table 12. Forty Cities with the Largest Increases in Factor 1 Scores, 2000-2005 ... 51
Table 13. Forty Cities with the Largest Decreases in Factor 1 Scores, 2000-2005 ... 52
Table 14. Changes in Factor 2 Scores between 2000 and 2005, by Region and Population ... 53
Table 15. Forty Cities with the Largest Increases in Factor 2 Scores, 2000-2005 ... 54
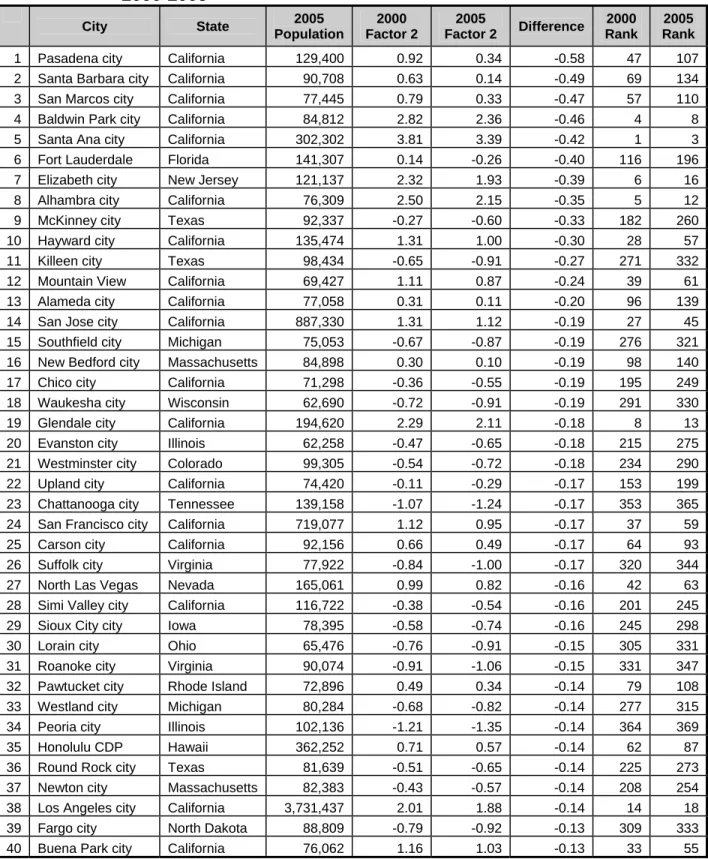
Table 16. Forty Cities with the Largest Decreases in Factor 2 Scores, 2000-2005 ... 55
Table 17. Changes in Factor 3 Scores between 2000 and 2005, by Region and Population ... 56
Table 18. Forty Cities with the Largest Increases in Factor 3 Scores, 2000-2005 ... 57
Table 19. Forty Cities with the Largest Decreases in Factor 3 Scores, 2000-2005 ... 58
Table 20. Changes in Equal Weight Index Scores between 2000 and 2005, by Region and Population ... 59
Table 21. Forty Cities with the Largest Increases in Equal Weight Index Scores, 2000-2005... 60
Table 22. Forty Cities with the Largest Decreases in Equal Weight Index Scores, 2000-2005... 61
Table 23. Variables Used to Measure Fiscal Capacity ... 69
Table 24. Twenty-five Cities with Greatest Real Fiscal Capacity... 71
Table 25. Twenty-five Cities with the Least Real Fiscal Capacity... 71
Table 26. Real Fiscal Capacity for 25 Largest Cities with Data... 73
Table 27. Impact of Combining Needs and Fiscal Capacity for 50 Cities with the Highest Community Needs ... 77
Tables
(continued)
Appendix A
Table A.1. Correlation Matrix for Needs Indicators... A-2 Table A.2. Initial Factor Analysis, 2005 Data: Factor Loading for Unrotated Factors A-4 Table A.3. Initial Factor Analysis, 2005 Data: Factor Loading for Varimax Orthogonal
Rotated Factors ... A-5 Table A.4. Factor Analysis Using 2000 Data: Unrotated and Rotated Factor Loading A-6 Table A.5. Factor Analysis Using 2005 Data, Rotated Factor Loadings for Large Cities
and Small Cities ... A-7 Table A.6. 2005 Factor Analysis Using VIOLCRIME Instead of PT1CRIME,
VARIMAX Rotated Factors ... A-8 Table A.7. Standardized Scoring Coefficients, Based on 2005 Data Without Crime
Variables ... A-9 Table A.8. Alternative Index Scores... A-10 Table A.9. Factor and Equal Weight Index Scores in 2005 and 2000 for 370 Cities.. A-23 Table A.10. Adjusted Needs Index for 234 Cities ... A-37
Appendix B
Table B.1. Tract-Level Variables Used in Regressions... B-6 Table B.2. Parameter Estimates for Tract-Level Variables ... B-7 Table B.3. Estimated Coefficients for City-Level Needs Indicators ... B-9 Table B.4. Parameter Estimates for Tract-Level Variables with Modified Specification ..
... B-11 Table B.5. Estimated Coefficients for City-Level Needs Indicators with Modified
Specification ... B-12 Table B.6. Percentage Decline in Median House Prices Caused by a
One-Standard-Deviation Worsening in a Need Indicator ... B-13 Table B.7. Estimated Coefficients for the Three Factors... B-14 Table B.8. Percentage Change in Median House Prices Caused by a
One-Standard-Deviation Worsening in a Factor Score ... B-14 Table B.9. Beta Coefficients and Standardized Scoring Coefficients for Needs Indicators with Valid Hedonic Coefficients ... B-16 Table B.10. Regressions Using All Tracts with Median House Values ... B-19 Table B.11. Regressions on Tracts with Less Dispersion in Median Prices... B-25 Table B.12. Regressions on Tracts with Less Dispersion in Median Prices Using Factor
Scores... B-31
Appendix C
Table C.1. Identical or Similar Indicators in Richardson and This Study ... C-3 Table C.2. Comparison of Richardson Index Scores and the Equal Weight Index
Executive Summary
The U.S. Department of Housing and Urban Development (HUD) funded this research for the purpose of developing an index of community needs. Such an index would take information from various public databases on different types of community problems and produce an overall assessment of the “neediness” of a community. As far back as 1976, HUD devoted its own staff resources to studying community needs and devising ways to synthesize various types of needs into an overall index of needs. HUD’s efforts have been sporadic because the primary source of data on community needs has been the decennial censuses, and thus new information on needs has been available only at 10-year intervals. Now, the American Community Survey (ACS) will provide every year the information that previously was available only from the decennial censuses. The annual availability of information through the ACS makes a community needs index much more valuable for HUD.
From HUD’s perspective, this research would provide the foundation for its future analysis of community needs by:
• Testing the feasibility of relying on the ACS for annual information about community needs.
• Devising a methodology to compare conditions in communities over time. In the early stages of the research, HUD expanded the goals to include developing an index of fiscal capacity and investigating an alternative methodology for constructing an index.
Identifying and Measuring Community Needs
The first step in the research was to define the range of problems to be grouped together as “community needs” and to identify “indicators” for each of the problems. In this research, “community” means city and “needs” means the problems, experienced by cities, that are relevant to HUD’s urban mission. The “indicators” are quantitative measures available on a consistent basis for all or most of the cities studied. HUD views its mission as including the support of community development. In its Strategic Plan, HUD declares its concern about a wide variety of problems related to strengthening communities; included among HUD’s concerns are housing conditions, physical conditions, the quality of life, and economic opportunities. With this in mind, the research team formulated a preliminary list of indicators that covered a broad array of community ills. In selecting the indicators, the team reviewed measures used in previous studies and data available from a variety of databases that contain information at the city level or that could be manipulated to produce city-level measures. In a November 21, 2006, meeting involving the authors, HUD experts, consultants with previous experience
in comparing conditions at the local level, representatives from the U.S. Government Accountability Office, and representatives from the District of Columbia government, the strengths and weaknesses of a variety of indicators were discussed and, in additional consultation with HUD, a final list of 26 indicators was selected.
Eight indicators identify population groups that may have needs for city services beyond those of the typical citizen. These include:
1. Poverty population. 2. Children living in poverty.
3. Persons over age 74 living in poverty.
4. Low-income population (excludes poverty population). 5. Single-parent families.
6. Adults without a high school diploma.
7. Working-age persons without a college degree. 8. Recent immigrants.
Four indicators identify problems with housing, housing markets, or housing finance. These include:
9. Lack of affordable rental housing. 10. Overcrowded housing.
11. Older rental housing occupied by poor persons. 12. Mortgage-loan denial rate.
Three indicators identify the extent to which cities have seriously troubled neighborhoods. These include:
13. Population living in high-poverty census tracts. 14. Population living in moderate-poverty census tracts. 15. Abandoned buildings.
Four indicators identify social and economic problems at the city level. These include: 16. Rate of violent crimes.
17. Rate of nonviolent crimes.
18. School-age population living in poverty. 19. Unemployment rate.
Four indicators identify conditions that might complicate a city’s efforts to deal with its problems. These include:
20. Linguistic isolation.
21. City-metropolitan differences in minority population. 22. City-metropolitan differences in poverty rate.
Three indicators identify detrimental long-term trends. These include: 24. Excess infrastructure/loss of households.
25. Change in employment base.
26. Change in concentration of low-income families.
Table 1 in Chapter 2 defines each of these indicators more precisely and explains why each was included. All the indicators are defined in percentage or ratio terms so that their magnitude does not depend on city size. Also, all indicators are defined so that the more serious the condition, the larger the value of the indicator.
Input from HUD and outside experts was used to choose the indicators. The list includes several innovative indicators. The abandoned building indicator was developed by HUD staff using a combination of census data and vacancy rates compiled by the United States Postal Service (USPS). The lack of affordable rental housing indicator (#9) uses a technique similar to that used by HUD to identify difficult development areas for the low-income housing tax credit program. The mortgage denial rate is used for the first time in this study. Variants of the city-metropolitan difference variables (#21 to #23) have been used in previous studies, but this research uses a simplified definition that makes it easier to calculate these indicators. All three long-trend indicators (#24 to #26) are new
formulations for this research.1
The indicators require data from the ACS, the decennial censuses, the economic censuses, USPS vacancy surveys, Home Mortgage Disclosure Act records, the FBI Uniform Crime Report, and the Bureau of Labor Statistics Local Area Unemployment Statistics. The 2005 ACS reported information on 473 cities (not including Puerto Rico) with populations of 65,000 or more. The research attempted to calculate the 26 indicators for each city. Information needed for individual indicators was missing for a number of cities. The most serious missing data problem involved the crime data, which were not available for 107 cities.
Finding Common Patterns among the Needs Indicators
The next step in the analysis was to determine the extent to which the needs indicators can be distilled into a small (more manageable) number of underlying common “themes” or components. The report uses factor analysis to search for common themes and to produce a simpler way to observe how needs vary across communities. Previous HUD research used factor analysis for this purpose.
1
A 27th indicator based on Housing Mortgage Discrimination Act data was identified—poor housing appreciation in high-poverty neighborhoods—but it could not be implemented within the scope of the project.
The research applied standard factor analysis techniques to the 26 indicators and identified three dimensions of community needs. These include:
• Needs associated with poverty and structural problems (Factor 1).
• Needs associated with immigration and lack of affordable housing (Factor 2).
• Needs arising from limited economic prospects (Factor 3).
The robustness of the factor analysis was tested in several ways. First, factor analysis was applied to the same indicators using 2000 data. The 2000 and 2005 analyses identified factors that were nearly identical; this result confirmed that factors developed using 2005 data could be applied to 2000 data on needs indicators. Second, the sample of cities was split into those with populations of 200,000 or more and those with populations of less than 200,000. Factor analysis applied separately to the two samples produced results that were similar enough to suggest that the same pattern of needs apply across different size classes of cities. Third, a different measure for violent crimes—one based on occurrences rather than arrests—was substituted for the measure used in the initial analysis. The results of the factor analysis did not seem to vary significantly when the alternative measure was used. Fourth, the needs indicators were examined to see where problems with missing data caused a large number of cities to drop out of the analysis. Based on this examination, the two crime indicators were dropped. When factor analysis was applied to the smaller set of needs indicators, the same factors were found as were found with the full set of indicators. Eliminating the two crime variables increased the number of cities examined from 292 to 370.
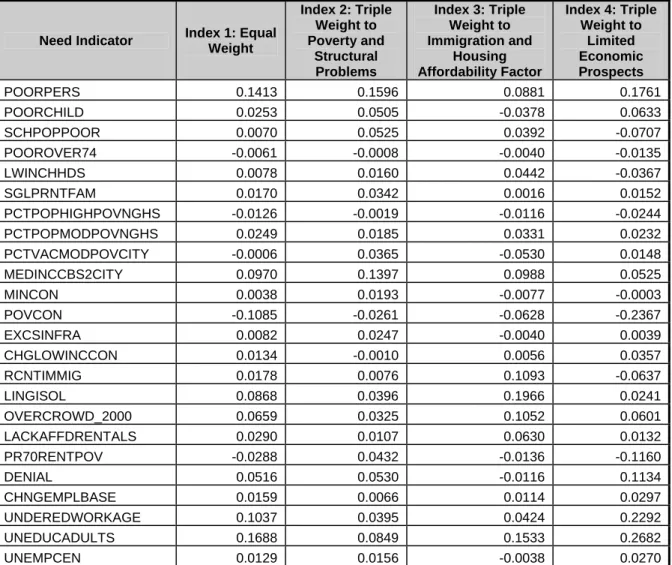
The factor analysis based on 24 needs indicators is the one used for all the analyses in the remainder of the report. Factor scores were computed for each city on each factor by multiplying a set of standardized scoring coefficients derived from the factor analysis by the standardized value of the needs indicators for the city and summing the products. A standardized value for a needs indicator is obtained by subtracting a mean value from the value of the indicator for that city and dividing the difference by a standard deviation. The explicit goal of this project was to develop a single-valued index of community needs. The report compared six alternative single-valued indices constructed by using various linear combinations of the scores on the three factors. The report was unable to find any statistical, programmatic, or logical reasons that made a compelling case for choosing one index over any of the others. Statistically, an equal weight index—an index formed by giving each of the three factors a weight of 1/3—produces results that are very similar to the results from the other indices that vary the weights given to the factors. For this reason, the report uses the equal weight index in all the analyses involving a single-valued index.
High correlation across all cities does not mean that the ranking of some cities is not substantially different depending upon the index used. If HUD were to use one of these indices to allocate funds to cities, the choice of index would be of great concern to individual cities. But, if HUD is interested primarily in analyzing the variation in needs
across cities and over time, then the results from the equal weight index will be similar to those from any index that applies reasonable weights to the factor scores.
Comparing Community Needs across Time
This research developed a methodology for applying factor analysis to data on needs at two points in time and successfully implemented the methodology. There are two keys to carrying out intertemporal comparisons correctly.
• First, the dimensions of need identified in the base year must still be relevant in the comparison year.
o The comparison of factor analyses using 2000 and 2005 data confirmed that the same factors applied in 2000 and 2005.
• Second, needs must be measured relative to conditions in the year in which the factor analysis is performed—that is, the means and standard deviations from the year used to derive the standardized scoring coefficients must be used to
standardize the needs indicators in both years.
o Since the report uses 2005 data to identify the factors, the report uses the means and standard deviations calculated on data for the 24 needs
indicators in 2005 to standardize the values of the needs indicators in both 2000 and 2005.
Using this technique, the report compares conditions in cities in 2000 with conditions in 2005 using each of the factors and the equal weight index. The scores are positively related to needs—that is, for each factor and for the equal weight index, an increase in the score means that a city is worse off in 2005 than in 2000.
Between 2000 and 2005, cities—on average—became worse off with respect to poverty and structural problems as well as immigration and housing affordability problems, but improved with respect to the limited economic prospects factor.
• Regional differences appeared on the individual factors, such as:
o The Northeast had the highest average scores on the poverty and
structural problems factor in both 2000 and 2005 and the largest increase in average scores between the two years. The West had the lowest average scores on this factor in both years and the smallest increase between the two years.
o For the immigration and housing affordability factor, the average scores of cities in the Northeast and West were higher than the national average
in both 2000 and 2005. Cities in the Northeast had the highest average change between 2000 and 2005.
o Cities in the Northeast had the lowest scores on the limited economic prospects factor in 2000 and showed the greatest improvement between 2000 and 2005.
• Differences by class size of cities were less common. For example:
o There appeared to be a systematic relationship between the scores on the poverty and structural problems factor and city size. The average score declined by size class in both 2000 and 2005. The change in scores was approximately the same for all the size classes, except for cities with populations between 500,000 and one million, which had a slightly higher increase in average scores.
o With the exception of cities with over one million residents, there appeared to be little relationship between population size and the
prevalence of problems related to immigration and housing affordability. The largest cities had an average score of 0.70 or more in both 2000 and 2005; the national average was 0.00 in 2005.
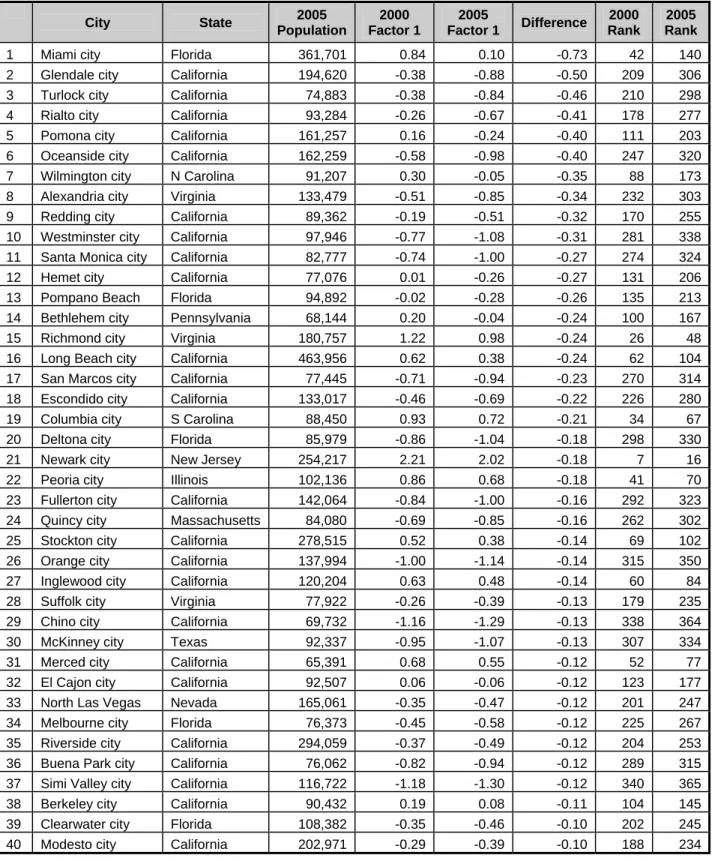
• There were also some interesting patterns in the lists of cities with the biggest increases in scores (becoming worse off) and the lists of cities with the biggest decreases in scores (becoming better off).
o Some of the worse off cities on the poverty and structural problems factor experienced big increases on this factor between 2000 and 2005; the cities were Camden, Detroit, Cleveland, Rochester, Reading, and Syracuse.
o Compared with other states, California had the most cities—95—among the 370 scored. Still, California cities appeared in higher than expected proportions on the list of the 40 biggest losers and gainers. One would expect, proportionally, 10 cities from California on each list. Instead:
− Twenty-four of the 40 cities with the biggest improvements on the poverty and structural problems factor were California cities. − Fifteen of the 40 cities with the worse changes on the immigration
and housing affordability factor were California cities.
− The five cities with the largest improvements on the immigration and housing affordability factor, and 18 of the top 40, were California cities.
The equal weight index showed that, on average, community needs decreased slightly between 2000 and 2005. According to the index, conditions were stable or got better in 202 of 370 cities. However, the report notes that the observed improvement appears to
be related strongly to the substantial increase in the proportion of adults with a high school diploma between 2000 and 2005, a fact that was questioned when the report reviewed data on each of the indicators.
Measuring Fiscal Capacity
The federal government, in general, and HUD in particular, are interested in developing an index of community needs because they want to know the extent to which
communities require federal assistance. But a needs index answers only one-half of this question; the federal government also needs to know the extent to which communities are capable of dealing with their problems without federal assistance.
The report develops and implements an index of real fiscal capacity. To construct the index, the report compares cities on their ability to raise revenue from various sources, including assistance from state governments. Then, the report translates the potential revenue into real terms by dividing total potential revenue by the average annual wage for government employees calculated at the metropolitan-area level. Using real capacity adjusts for differences across cities in the costs of responding to community needs. The real fiscal capacity index ranks 266 cities on the real resources that they can potentially use to solve community needs in 2005.
The report also develops a technique for combining the equal weight index of community needs with the index of real fiscal capacity to obtain an adjusted needs index that looks at both needs and capacity. The report calculates adjusted needs index scores for 234 cities in 2005.
The most important findings from the research on fiscal capacity are:
• It is possible to construct an index of real fiscal capacity, which is a very important advancement in analyzing the need for federal assistance.
• The index of real fiscal capacity is sensitive to both income and wage rates. Places with high income or lower government wages are more likely to have high real fiscal capacity. High-income places can generally afford more government services because they can raise more tax revenue; places with low government wages can generally afford more government services because every tax dollar goes further in providing services.
• The index is negatively correlated with the equal weight index of community needs. Cities with high community needs are more likely to have low real fiscal capacity.
• It is possible to combine a needs index and a fiscal capacity index. The adjusted needs index developed in this chapter produced different rankings from the equal weight index of community needs. But, in general, the change in rankings was not great, probably because of the negative correlation between the two
component indices.
Implications for Future Analysis
One objective of this research was to test whether the ACS data would support the same type of analysis that HUD had conducted using long-form data. The answer to this question is “yes.” In the future, HUD can depend on the ACS to monitor conditions in cities and counties. The report successfully uses ACS data to construct useful measures of community needs using factor analysis. Of the 24 needs indicators used in the final factor analysis, 16 used ACS data, one used ACS data combined with long-form data, and four used long-form data. All five indicators that used either long-form data or a combination of ACS and long-form data should be available in the future from the ACS. The following are some issues and open questions that HUD will have to keep in mind in future work using the ACS.
• The reporting rules used in the ACS are similar to those used for the long form of the decennial census. But, because the ACS sample size is smaller, the rules can result in more frequent suppression of data.
• The Census Bureau has established, as a general policy, releasing for the ACS all tabulations prepared for the 2000 long-form data. However, some special
tabulations of long-form data have not yet been released. HUD should probably contact the Census Bureau to make sure that these tabulations are not forgotten.
• The ACS has not released data on persons in group quarters yet. So, there has been no experience with the usefulness of the tabulations or the reliability of the data.
• The Census Bureau will make revisions to the ACS questionnaire, and revisions always create the possibility of discontinuities in the data.
An explicit goal of this project was to develop a single-valued index of community needs. The research achieved this objective, but the outcome was only a qualified success. The report was unable to find any statistical, programmatic, or logical reasons that make a
compelling case for choosing one index over any of the others. At HUD’s request, the report examined the use of regression analysis to provide definitive guidance in weighting the factors or the needs indicators. However, the prominent role of housing affordability in Factor 2 and in two or three of the needs indicators undermined attempts to apply the regression results directly. The regression approach did provide some
insights on deriving weights, but the report could not explore the full implication of these insights.
HUD indicated early on in the project that it was interested in the lessons from this research that could be applied to measuring needs at the tract level. The Administration has proposed creating a special fund within the CDBG program to award communities for making progress in reducing neighborhood distress. Such a proposal would require a community needs measure at the neighborhood level. Since ACS data will be available at the census-tract level beginning in 2010, it was hoped that the experience gained here in constructing a city-level index using ACS data would be useful to HUD in developing a neighborhood-level index.
This research laid the ground work for a measure of progress at the census-tract level in three important ways: the identification of needs indicators, the successful application of factor analysis to the needs indicators, and the development of a methodology for making intertemporal comparisons of needs. Despite these useful insights, HUD will need to do a lot of conceptual and empirical work to develop a technique capable of measuring progress at the local level. The obstacles include:
• Several of the needs indicators used at the city level would not be applicable at the tract level because of the absence of data at the tract level or because the concepts behind the indicators are more applicable at the city level than at the tract level.
• Because of the substantial change in the number and type of indicators, a new factor analysis would have to be performed at the tract level. This factor analysis is likely to identify different dimensions of need than the three identified at the city level in this report.
• The ACS has lower sampling rates than the long-form survey in the decennial censuses. This raises concerns about data suppression at the tract level and about measurement errors.
• On the conceptual side, a clear distinction needs to be made between measuring a change in needs and measuring how local government actions have reduced community needs. Conceptually, one would like to control for outside influences so that cities would not benefit from favorable external conditions or suffer from unfavorable external conditions. In this respect, measuring needs is simpler than measuring progress.
• At the tract level, gentrification can give the appearance of progress in reducing needs, but progress is not really achieved because many people with needs are forced to relocate with their needs still unmet.
Recommendations for Future Work
The most important area for future work is to expand and improve upon the list of needs indicators. This report uses a well-conceived, broad-based, and carefully defined set of needs indicators that provide the basis for a useful factor analysis. However, the greatest payoff for understanding community needs is likely to come from improving these indicators and filling in some missing gaps. Future work should concentrate on getting good measures of education and health needs and, most important, on getting better measures of the impact of long-term economic forces on cities.
1. Introduction
1.1. HUD’s Mission and an Index of Community Needs
The U.S. Department of Housing and Urban Development (HUD) funded the research reported in this document for the purpose of developing an index of community needs. Such an index would take data from various sources on different types of community problems and produce an overall assessment of the “neediness” of a community.
Consistent with the “Urban Development” portion of its name, HUD views its mission as including the support of community development. In its latest Strategic Plan, HUD identifies the following five objectives under the goal of strengthening communities:2
• Assist disaster recovery in the Gulf Coast region.
• Enhance sustainability of communities by expanding economic opportunities.
• Foster a suitable living environment in communities by improving physical conditions and quality of life.
• End chronic homelessness and move homeless families and individuals to permanent housing.
• Address housing conditions that threaten health.
These objectives, particularly the last four, indicate HUD’s concern with a wide variety of problems that confront local governments. An accurate and reliable index of
community needs would help HUD carry out its responsibilities in several ways. These include:
• An index would enable HUD to rank communities by the extent of their needs.
• Such a ranking would help HUD develop equitable formulas for distributing funds to communities.
• An index would also enable HUD to track whether a community’s needs are improving or getting worse over time.
• Information on the components that enter into the calculation of an index score would help HUD diagnose the type of problems facing communities in general and individual communities.
2
HUD Strategic Plan FY 2006 – FY 2011, U.S. Department of Housing and Urban Development, March 31, 2006.
• Construction of an index would help HUD understand how the various kinds of community problems relate to one another and the extent to which they represent the same or different types of need.
As far back as 1976, HUD devoted its own staff resources to studying community needs and devising ways to synthesize various types of needs into an overall index of needs. HUD’s efforts have been sporadic because the primary source of data on community needs has been the decennial censuses, and thus new information on needs has been available only at 10-year intervals. Now the American Community Survey (ACS) will provide every year the information that previously was available only from the decennial censuses.3 The annual availability of information through the ACS makes a community needs index much more valuable for HUD. For this reason, HUD contracted with Econometrica, Inc. to build upon HUD’s previous research to develop a community needs index that could be implemented with ACS and other contemporary data to provide yearly information on community needs.
1.2. Policy Context
In February 2005, HUD issued a report (Richardson 2005) that measured community needs and analyzed how well the current Community Development Block Grant (CDBG) formula distributes funds with respect to community needs. This report also presented alternative formulas that would distribute CDBG funds more equitably with respect to community needs. This was the sixth in a series of reports on the CDBG formula, but it was the first report that HUD prepared without being requested to do so by Congress. The Administration subsequently proposed changes in the CDBG allocation mechanism. In April 2005, the U.S. Government Accountability Office (GAO) presented to Congress the results of its study of the CDBG formula and testified that the allocation mechanism could be improved. In June 2006, GAO officials testified on the Administration’s proposal and explained how GAO planned to respond to a request from Congress to assess the CDBG formula. The GAO created an expert panel using its National Academy of Sciences connection. The panel was asked to examine:
• HUD’s construction of a needs index as a criterion for measuring community needs, including HUD’s factor analysis and the specific indicators of need included in its index.
3
The ACS revolutionizes the way the federal government collects demographic data. The ACS collects virtually the same information annually that the long form of the decennial census collected at 10-year intervals, but the ACS has a lower sampling rate than the long form. In 2006, the Census Bureau released data from the 2005 ACS for most places with populations of 65,000 or more and, thereafter, plans to release ACS data every year for those places. Beginning in 2008, it will release 3-year moving average data for all places with populations of 20,000 or more. Thereafter, it plans to release 3-year moving average data every year for these places. Beginning in 2010, it will release 5-year moving average data for all places, including census tracts and block groups, and, thereafter, plans to release 5-year moving average data every year for all places.
• The development of an evaluation criterion for GAO to use that accounts for the potential mismatch between a jurisdiction’s community needs and its economic and fiscal capacity to meet that need.
As of the date of this report, GAO has not completed work on its study.
A community needs index based on ACS data would be valuable in assessing proposed changes to the CDBG formula arising from the Administration or GAO.
The Administration’s proposal also contained a provision that would create a special fund within the CDBG program to award communities for making progress in reducing
neighborhood distress. Such a proposal would require a community-needs measure at the neighborhood level. Since ACS data will be available at the census-tract level beginning in 2010, the experience gained here in constructing a city-level index using ACS data should be useful to HUD in developing a neighborhood-level index.
1.3. History of Research into Community Needs
Between 1976 and 2005, HUD personnel conducted five studies of community needs:
• 1976: An Evaluation of the Community Development Block Grant Formula,
prepared by Harold L. Bunce.
• 1979: City Need and Community Development Funding, prepared by Harold L. Bunce and Robert L. Goldberg.
• 1983: Effects of the 1980 Census on Community Development Funding, prepared by Harold L. Bunce, Sue G. Neal, and John L. Gardner.
• 1995: Effect of the 1990 Census on CDBG Program Funding, prepared by Kevin Neary and Todd Richardson.
• 2005: CDBG Formula Targeting to Community Needs, prepared by Todd Richardson.
These five studies had three common characteristics: First, each study focused on whether the formula used to distribute CDBG funds was doing so effectively and equitably. Second, each study gathered data from a variety of sources on conditions in communities receiving CDBG funding. Variables were selected to measure problems that communities are allowed to use CDBG funds to treat. Third, each study used factor analysis to search out underlying patterns among the need variables and to simplify the data for calculating an index.
1.4. Project Goals
The primary goal of the project is to use 2005 ACS data and other data to create an index of community needs that has the following properties:
• HUD can use the index to evaluate the needs of cities with populations of 65,000 or more as of 2005.
• In 2007 and every year thereafter, when the Census Bureau releases new ACS data, HUD can enter the new data into the index and update its assessment of city needs.
• HUD can rely on the index to track changes in the needs of individual cities over time.
• The index, with minor modifications as may be required, can be used to evaluate the needs of smaller cities and urban counties when more detailed ACS data become available in 2008.
Using an index to compare needs at two different points in time extends previous work with community needs indices and requires a revised methodology. Each new wave of ACS data will provide new information on individual community needs and the
opportunity to construct a new community needs index. Since each index creates its own frame of reference, a single frame of reference has to be selected and criteria developed to ensure the validity of the chosen frame.
HUD intended Econometrica, Inc. to build the index using the factor analysis approach employed in HUD’s previous work on need indices. However, the project has some secondary research goals, which are to:
• Examine whether previous approaches should be modified to take into account community boundary changes and cost-of-living differences across communities.
• Explore an alternative approach for creating a needs index based on hedonic-like regression models.
• Explore the development of an index of the capacity of communities to deal with problems.
As noted in Section 1.2, the Administration has proposed a special fund within the CDBG program to award communities for making progress in reducing neighborhood distress. HUD hopes to use the lessons from this project to provide insights into developing a means to measure progress at the neighborhood level. In the concluding chapter, the report discusses how the experience from this research at the city level could be applied in creating an index of neighborhood distress at the census tract level.
1.5. Overview of Methodology and Organization of the Report
The process of developing a community needs index involves a number of steps, each of which has its own conceptual issues that must be resolved. The principal steps that an analyst must undertake are:
A. The analyst must establish what concepts should be included in the notion of “community needs.” For the purpose of this research, “community” means city or county. The residents of cities and counties experience a wide range of problems. The first step in developing a community needs index is to identify the subset of these problems that cities and counties have the responsibility of alleviating and that are consistent with the “urban development” mission of HUD.
B. The analyst must create valid measures of these concepts. For each concept in Step A, the analyst must find data that adequately represent the problem, that are reliable, and that are available for all the communities being studied. Care must be taken to avoid conceptual errors such as measuring the consequences of not dealing with problems instead of measuring the problems themselves.
C. The ability of a city or county to deal with community needs depends upon the resources available to the city or county, that is, on its fiscal capacity, and on conditions, such as long-run economic decline or racial segregation, that may make problems more difficult to resolve. The analyst must be able to identify complicating conditions, determine how to measure them, and figure out how to relate them to direct measures of needs. In addition, the analyst must determine whether it is feasible to measure a community’s capacity to meet its needs and, if so, how to relate capacity to needs.
D. The outcome of Steps A, B, and C should be a set of variables that measures needs and complicating conditions for the universe of communities being studied. Next, the analyst must determine the extent to which these measures can be
distilled into a small (more manageable) number of underlying common “themes” or components. The report uses factor analysis to search for common themes and to produce a simpler way to observe how needs vary across communities. E. Next, the analyst must decide how the various components of need should be
weighted in the creation of a summary index of need. One can look to previous research, relevant legislative guidance, “common-sense rules of thumb,” or other methods to combine the output from Step D into a single index.
F. Finally, the analyst must figure out how to use the components of need developed in Step D or the single index developed in Step E to measure needs at a different point in time.
This report discusses how each of these steps was accomplished and what was learned in resolving the issues involved in each step. The report provides a list of needs indicators
that are generally available for all cities with populations of 65,000 or more and that will be available in the future for smaller cities and for counties. From the needs indicators, a set of three factors that summarizes the types of needs associated with the needs
indicators was found, and the report used alternative ways to combine the factors into a single index. The report applies the factors and a single-valued index based on the factors to explore relative need among 370 cities in 2005 and to monitor changes in need from 2000 to 2005.
This report contains the following six chapters: 1. Introduction.
2. Indicators of Community Needs – Chapter 2 identifies cities as the entities being studied and defines the range of conditions to be considered as “needs” at the city level. It deals with all of the issues involved in Steps A and B and the issues in Step C associated with conditions that make it more difficult for cities to deal with problems. After examining data on various measures of need, we selected 26 needs indicators to be used in the factor analysis.
3. Factor Analysis, Dimensions of Need, and a Community Needs Index – Chapter 3 applies factor analysis to the data on needs indicators and identifies three common themes (factors) that encompass the conditions measured by the needs indicators. The chapter combines these three factors into a single index using four alternative sets of weights for the factors and compares the alternatives indices. Finally, the chapter develops the methodology to apply the factor analysis developed using 2005 data to measure city needs in 2000. The chapter deals with the issues involved in Steps D, E, and F. As such, it lays out the methodology used in this study and proposed to be used with future rounds of ACS data.
4. Community Needs in 2000 and 2005 – Chapter 4 applies the results from Chapter 3 to examine how cities differ in needs in 2005 and how city needs changed from 2000 to 2005.
5. Measuring Fiscal Capacity – Chapter 5 develops a methodology for measuring fiscal capacity, implements the methodology for 292 cities in 2005, and explores how one could combine a measure of fiscal capacity with a community needs index to obtain a complete picture of the relative dependence of cities on federal aid. This chapter deals with the issues involved in Step C associated with fiscal capacity.
6. Implications – Chapter 6 summarizes the lessons learned in Chapters 2 through 5 and applies them to the three main objectives of this study: developing techniques for measuring community needs that can be used with future rounds of ACS data, developing techniques for tracking changes in needs for individual communities, and exploring ways to measure progress in resolving needs at the neighborhood level.
Chapter 4 contains the most important empirical results—a comparison of needs in 370 cities in 2000 and 2005. Chapter 5 presents the empirical findings related to fiscal capacity and the joint consideration of community needs and fiscal capacity. This project involved a substantial amount of methodological work, both in
conceptualizing and implementing the analysis. Chapter 2 contains the conceptual work related to the selection of needs indicators. Chapter 3 presents the methodology involved in the factor analysis and in applying factor analysis in multiple time periods. Chapter 5 describes the rationale and processes involved in constructing an index of real fiscal capacity and in combining the index of community needs and the index of real fiscal capacity. Appendix B describes the methodology behind the hedonic-type analysis and contains the results of that work.
Appendix A contains supplemental tables. Appendix C compares the 2000 factor
analysis performed by Richardson in his 2005 study with a 2000 factor analysis using the needs indicators developed in this study.
2. Indicators of Community Needs
HUD designed this study to test the use of ACS data to measure a variety of community needs and track changes in needs over time. This focus shaped the choice of data, time period, and type of communities used in the analysis. The first section of this chapter discusses these choices. The second section describes the range of problems and conditions considered as community needs, proposes a set of needs indicators, and explains why certain variables were not included as needs indicators. The third section examines data on the proposed indicators to test whether they are reliable measures of need prior to the factor analysis in Chapter 3. The fourth section contains our assessment of the accuracy and comprehensiveness of the needs indictors.
2.1. Data Issues in Building an Index of Community Needs
This section discusses the issues involved in gathering data for an index of community needs.
2.1.1. Type and Size of Community
In this report, community will mean a city with a population in 2005 of 65,000 or more. The recent availability of ACS data motivated this research and, as of now, the Census Bureau has released ACS data only for states and for cities and counties with populations of 65,000 or more. Data on places with populations of 20,000 or more will become available in 2008.
Counties are not included in the analysis for two reasons: non-urban counties probably have a different mix of problems, and including them with cities and urban counties could produce misleading results. Second, in the community development area, HUD usually deals with units of governments, which means that it may work with both a county and with cities within that county. This creates data difficulties because, depending upon the issue, HUD may want data at the county level that relate to
community needs for both the overall county and individual cities within the county. In awarding CDBG funds to an urban county, HUD considers only the portion of the county outside of cities that receives CDBG funds directly from HUD. Conceptually, it would be possible to construct ACS estimates for these pieces of counties, but the current 65,000-minimum-population rule and confidentiality constraints that limit reporting in individual tables would eliminate numerous urban counties from the analysis. For these reasons, HUD excluded counties from the analysis.
The Census Bureau lists 499 places for which it has released ACS data, including 7 in Puerto Rico. We dropped the seven places in Puerto Rico because of problems with particular variables. For five cities (Indianapolis, Louisville, Nashville, Augusta, and
Athens), the information is reported for “balance” of the jurisdiction. Based on correspondence with the Census Bureau, these data cover the consolidated city and county, but omit incorporated places within the consolidated city/county. It is possible that the city/county government is responsible for community needs in the omitted
incorporated areas, but there is nothing in the ACS data to confirm or deny responsibility. These five places are included in the analysis. Twenty-seven of the 499 places are
“census designated places” (CDPs). Of these, one (Honolulu) is a CDBG central city, and six are CDBG noncentral city entitlement cities. We kept these seven places.4 New Orleans and other Gulf Coast cities present special problems. Two-thirds of the ACS data for these areas were collected prior to Hurricane Katrina and one-third afterwards, although response rates were probably low. If the primary purpose of this study were to rank cities by need, we might have eliminated many of the Gulf Coast cities because their needs today are probably much different from their needs measured by the 2005 data.5 But, as noted previously, this study concentrates mainly on
developing techniques for measuring need. The ACS data provide a reasonable good measure of conditions in these places prior to Katrina and, therefore, we included them as part of the universe of places used to test the techniques.
After these adjustments, the analysis begins with 472 cities; the actual number included in any analysis depends upon how many cities have data for all the measures used in that analysis. Of the 472 cities, 235 are principal cities, and 137 are suburban cities.
2.1.2. Sources of Data Used to Measure City Needs
The types of analyses that are used to construct a community needs index require that the data be defined and collected consistently across cities. This means that we must rely on national databases and ignore valuable local data sources.6 The databases used are:
• The 2005 American Community Survey.
• The 2000 decennial census.
• The 1997 and 2002 Economic Censuses.
• United States Postal Service (USPS) vacancy data for 2006.
• 2005 Home Mortgage Disclosure Act data.
• FBI Uniform Crime Report data for 2000 and 2004.
4
Initially we also retained an eighth CDP—Arlington, VA—which is a CDBG urban county. However, Arlington dropped out of the analysis at an early stage because of missing information for some variables. 5
The Census Bureau published a report using ACS data to compared conditions in Gulf Coast states prior to and after Katrina. The report provides data at the state level, distinguishing between the set of counties designated as disaster areas and the balance of the state. See
http://www.census.gov/acs/www/Products/Profiles/gulf_coast/index.htm. 6
Examples of relevant local records are city records that bear on neighborhood conditions, such as building code violations or abandoned cars, and county records that bear on real estate conditions, such as property transactions, property valuations, housing court, and evictions. Unfortunately, the methods for collecting and storing these sources of information are not standardized.
• Bureau of Labor Statistics Local Area Unemployment Statistics for 2000 and 2005.
Information from other sources—principally, the 2002 Census of Local Governments and the 2001 Residential Finance Survey—was used to adjust data from the ACS and the Economic Censuses to create measures of fiscal capacity.
2.1.3. Time Consistence of Needs Indicators
To encompass as wide a range of city problems as feasible, we combined ACS data with data from other nationally available sources. In almost every instance, we used the version of those data collected in 2005 or as close to 2005 as possible. The most recently released FBI uniform crime data were compiled in 2004. The most recent Economic Census covered calendar year 2002. HUD used USPS data (2006) to construct an
estimate of abandoned structures. Because of the extensive work involved in calculating this estimate, HUD used the most recent data (2006) and decided not to construct a separate 2005 estimate for this study.
In some cases, the Census Bureau has not yet produced tables for the ACS that it published for the 2000 decennial census; in other cases, comparable ACS tables are published, but the tables were empty for a number of our 472 cities because of small sample sizes. Tables reporting tenure, age of structure, and poverty status jointly are examples of the first situation, and the table on overcrowded housing is an example of the second situation. In these situations, we used data from the 2000 census. We also used 2000 census data for those indicators of need that require information at the census-tract level.
The ACS will be adding tables in upcoming years, and census-tract data will be available in 2010.
2.2. Selection of Needs Indicators
2.2.1. How the Needs Indicators Were Selected
Econometrica team members met with HUD to discuss the research at an Orientation Meeting on October 12, 2006. One of the issues on the agenda was the range of city problems to be considered in gathering data for the needs index. As noted in Chapter 1, the previous HUD studies had focused on needs that are eligible for assistance under the Community Development Block Grant program. The question posed to HUD was whether to focus strictly on problems that can be treated using CDBG funds or to take a wider perspective on community needs. The goals of the CDBG program are broad, and very few things are excluded de facto as eligible activities. So, using CDBG eligibility as the criterion would not significantly limit the types of needs included in the analysis.
Nevertheless, the participants in the Orientation Meeting agreed that the study should adopt a broad definition of community needs—that is, a definition that included needs beyond those typically eligible for unrestricted funding under the CDBG program. The participants reasoned that HUD’s mission extends to most problem areas that affect cities and other communities.
Given this direction, we investigated a wide range of data sources and developed a list of potential variables for discussion at an expert panel meeting on November 21, 2006. The list drew upon the variables used in the previous HUD studies and ideas developed by GAO for its ongoing study.
The participants in the November expert panel meeting stressed certain principles in selecting variables, including:
• Variables should clearly relate to city-level needs.
• Proxies should be avoided in deference to direct measures of need.
• Failure of a city to respond to a problem should not be considered a need.
• Variables should be defined to avoid spurious needs, such as the low income of college students who receive support from their families.
Using these principles, the panel rejected a number of variables on the list and suggested some additions to the list. In some cases, the panel suggested we investigate alternative measures of particular needs and make the final selection after reviewing the data. A revised list of variables was submitted on December 4, 2006, and work was begun on collecting data to implement the variables. Discussion continued via e-mail on how to construct useful measures from the data collected under the Home Mortgage Disclosure Act (HMDA).
2.2.2. Needs Indicators
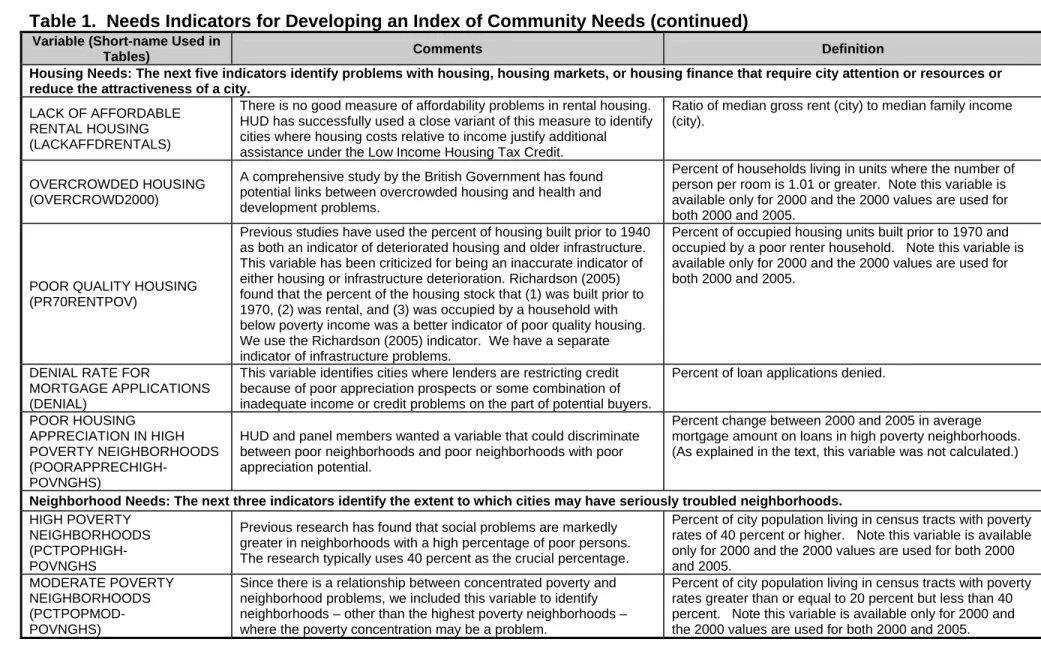
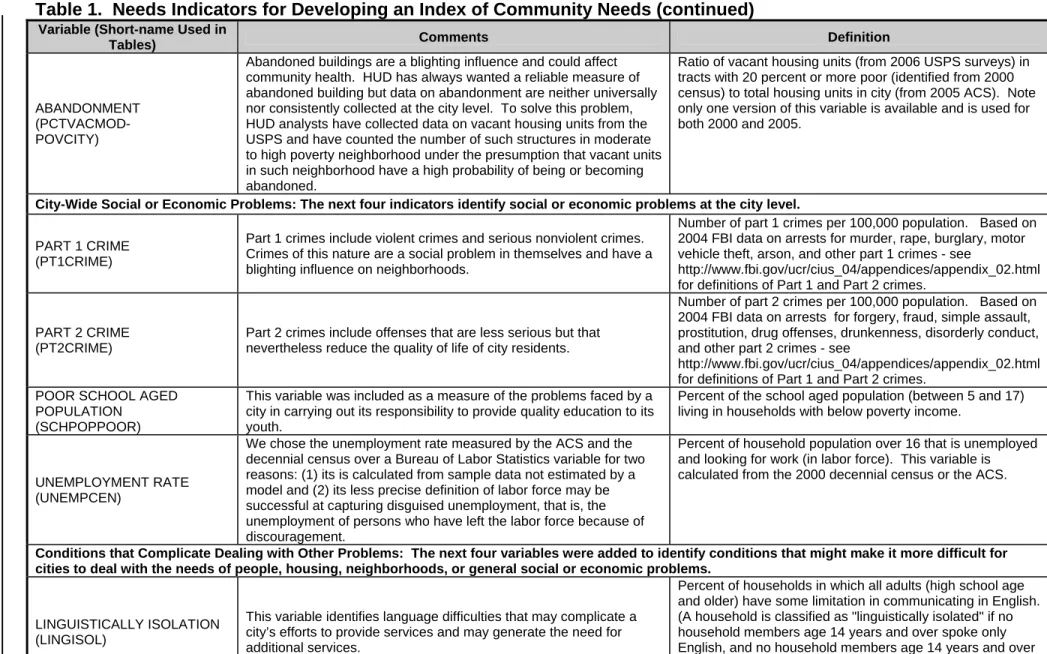
Table 1 identifies the 27 needs indicators that HUD and Econometrica jointly selected. The list includes variables related to population subgroups with special needs, housing needs, social needs, neighborhood needs, economic needs, conditions that make it more difficult for cities to respond to various needs, and indicators of unfavorable long-run trends. These needs indicators deal with the broad range of problems covered by the five objectives relating to supporting community development in HUD’s strategic plan. Table 1 classifies each indicator with respect to the category of problem that it measures. However, many of the indicators relate to more than one type of problem.
Table 1. Needs Indicators for Developing an Index of Community Needs
Page 13
Variable (Short-name Used
in Tables) Comments Definition
Populations with Needs: The first eight indicators identify subgroups in the populations that may have specialized needs that require the attention and resources of city governments.
POOR PERSONS (POORPERS)
Poverty in cities has always been a central concern to HUD. The CDBG program requires that cities use 70 percent of program funds to benefit low and moderate income persons. In line with previous research, we eliminate poor college students on the grounds that most receive support from their parents that is not included in income.
Ratio of persons age 3 and over not enrolled in college who live in households with below poverty incomes to all persons age 3 and over who live in households.
POOR CHILDREN (POORCHILD)
Children living in poor households require different and perhaps more city-supplied services than poor working age adults.
Percent of persons under 18 (children) in the household population living in households with below poverty incomes
POOR ELDERLY (POOROVER74)
The elderly require different services and perhaps more city-supplied services than poor working age adults. We chose "over 74" rather than "over 64" for two reasons: (1) with long life spans, "over 74" seems to be a better identifier of "the elderly" who are likely to have special needs, and (2) it is less correlated with overall poor population (POORPERS) and therefore more likely to identify different types of needs.
Percent of persons over 74 living in households with below poverty incomes
LOW INCOME HOUSEHOLDS (LWINCHHDS)
This variable was added to pick up low-income households whose incomes exceed the poverty level. The CDBG emphasis on low and moderate income persons argues for including more than just the poverty level population.
Percent of persons living in households with incomes greater than the poverty level and less than 50 percent of area median income. Note the decennial census does not contain the table needed to calculate this variable, thus the 2005 ACS data are use for both 2000 and 2005.
SINGLE-PARENT FAMILIES WITH CHILDREN
(SGLPRNTFAM)
Single-parent households frequently require city-supplied services and unsupervised children in some of these households may create neighborhood problems. We chose "single-parent" over "female-headed" because the needs associated with these families are not limited to "female-headed" families. Previous studies had used female-headed families.
Percent of families that are single parent-headed with own children under 18.
UNEDUCATED POPULATION (UNEDUCADULTS)
Adults without a high school diploma generally have lower skills than other workers and may require some support and training during periods of unemployment and may not have adequate preparation for post-employment living support.
Percent of household population over 18 without a high school diploma.
UNDEREDUCATED WORKING AGE POPULATION
(UNDEREDWORKAGE)
These workers are more vulnerable to being unemployed and have greater difficulty finding new jobs.
Percent of household population over 24 and less than 65 without a college degree.
RECENT IMMIGRANT POPULATION (RCNTIMMIG)
Language problems and cultural differences create adjustment problems for many members of this group.
Percent of household population that is foreign born and entered the United States within the last 15 years.
Page 14
Table 1. Needs Indicators for Developing an Index of Community Needs (continued)
Variable (Short-name Used in
Tables) Comments Definition
Housing Needs: The next five indicators identify problems with housing, housing markets, or housing finance that require city attention or resources or reduce the attractiveness of a city.
LACK OF AFFORDABLE RENTAL HOUSING (LACKAFFDRENTALS)
There is no good measure of affordability problems in rental housing. HUD has successfully used a close variant of this measure to identify cities where housing costs relative to income justify additional assistance under the Low Income Housing Tax Credit.
Ratio of median gross rent (city) to median family income (city).
OVERCROWDED HOUSING (OVERCROWD2000)
A comprehensive study by the British Government has found potential links between overcrowded housing and health and development problems.
Percent of households living in units where the number of person per room is 1.01 or greater. Note this variable is available only for 2000 and the 2000 values are used for both 2000 and 2005.
POOR QUALITY HOUSING (PR70RENTPOV)
Previous studies have used the percent of housing built prior to 1940 as both an indicator of deteriorated housing and older infrastructure. This variable has been criticized for being an inaccurate indicator of either housing or infrastructure deterioration. Richardson (2005) found that the percent of the housing stock that (1) was built prior to 1970, (2) was rental, and (3) was occupied by a household with below poverty income was a better indicator of poor quality housing. We use the Richardson (2005) indicator. We have a separate indicator of infrastructure problems.
Percent of occupied housing units built prior to 1970 and occupied by a poor renter household. Note this variable is available only for 2000 and the 2000 values are used for both 2000 and 2005.
DENIAL RATE FOR
MORTGAGE APPLICATIONS (DENIAL)
This variable identifies cities where lenders are restricting credit because of poor appreciation prospects or some combination of inadequate income or credit problems on the part of potential buyers.
Percent of loan applications denied.
POOR HOUSING APPRECIATION IN HIGH POVERTY NEIGHBORHOODS (POORAPPRECHIGH-
POVNGHS)
HUD and panel members wanted a variable that could discriminate between poor neighborhoods and poor neighborhoods with poor appreciation potential.
Percent change between 2000 and 2005 in average mortgage amount on loans in high poverty neighborhoods. (As explained in the text, this variable was not calculated.)
Neighborhood Needs: The next three indicators identify the extent to which cities may have seriously troubled neighborhoods.
HIGH POVERTY NEIGHBORHOODS (PCTPOPHIGH- POVNGHS
Previous research has found that social problems are markedly greater in neighborhoods with a high percentage of poor persons. The research typically uses 40 percent as the crucial percentage.
Percent of city population living in census tracts with poverty rates of 40 percent or higher. Note this variable is available only for 2000 and the 2000 values are used for both 2000 and 2005.
MODERATE POVERTY NEIGHBORHOODS (PCTPOPMOD- POVNGHS)
Since there is a relationship between concentrated poverty and neighborhood problems, we included this variable to identify neighborhoods – other than the highest poverty neighborhoods – where the poverty concentration may be a problem.
Percent of city population living in census tracts with poverty rates greater than or equal to 20 percent but less than 40 percent. Note this variable is available only for 2000 and the 2000 values are used for both 2000 and 2005.