Cooper, Richard P. and Wutke, Karolina and Davelaar, Eddy J. (2012)
Differential contributions of set-shifting and monitoring to dual-task
interference. Quarterly Journal of Experimental Psychology 65 (3), pp.
587-612. ISSN 1747-0218.
Downloaded from:
Usage Guidelines:
Please refer to usage guidelines at or alternatively
BIROn
-
B
irkbeck
I
nstitutional
R
esearch
On
line
Enabling open access to Birkbeck’s published research output
Differential contributions of set-shifting and monitoring
to dual-task interference
Journal Article
http://eprints.bbk.ac.uk/4176
Version: Accepted (Refereed)
Citation:
© 2012
Taylor and Francis
______________________________________________________________
All articles available through Birkbeck ePrints are protected by intellectual property law, including copyright law. Any use made of the contents should comply with the relevant law.
______________________________________________________________
Deposit Guide
Contact: [email protected]
Cooper, R.; Wutke, K.; Davelaar, E.. (2012)
Differential contributions of set-shifting and monitoring to dual-task
interference –
Differential Contributions of Set-Shifting and Monitoring
to Dual-Task Interference
*Richard P. Cooper, Karolina Wutke and Eddy J. Davelaar
Birkbeck, University of London
It is commonly argued that complex behaviour is regulated by a number of “executive functions” which work to co-ordinate the operation of disparate cognitive systems in the service of an overall goal. However, the identity, roles, and interactions of specific putative executive functions remain contentious, even within widely accepted tests of executive function. The authors present two experiments that use dual-task interference to provide further support for multiple distinct executive functions and to establish the differential contributions of those functions in two relatively complex executive tasks – Random Generation and the Wisconsin Card Sorting Test. Results are interpreted in terms of process models of the complex executive tasks.
Keywords: Executive functions, set-shifting, monitoring, dual-task interference, random number generation, Wisconsin Card Sorting Test.
Recent years have witnessed substantial interest, and progress, in understanding the mechanisms that support the control or regulation of complex cognitive tasks. There is now a substantial literature that posits that such control is effected by a number of separable functions, such as set-shifting and response inhibition. These so-called executive functions are held to be general control functions that operate across tasks. Thus, set-shifting is held to be invoked whenever it is necessary to switch from one task to another. This occurs in a range of laboratory paradigms where participants must periodically switch from one stimulus-response set to another (see Kiesel et al., 2010, Monsell, 2003, and Vandierendonck et al., 2010, for reviews), as well as in naturalistic settings such as responding to an interruption (e.g., answering a telephone call while writing a manuscript). Similarly, response inhibition is held to be invoked whenever it is necessary to inhibit a prepotent response. This is commonly studied in the colour-naming condition of the Stroop task (e.g., Friedman & Miyake, 2004; Miyake et al, 2000), but the same function is held to be involved when resisting either temptation or the production of an habitual response (e.g., when resisting the urge to answer a ringing telephone).
There is now converging evidence from behavioural, neuropsychological and neuroimaging studies for a number of specific control functions. Consider set-shifting. Behaviourally, as indicated above, this is generally considered to be evidenced in tasks where it is necessary to switch from one response set to another. In the laboratory it was first assessed by tasks where participants are required to complete one block of N trials of type A, one block of N trials of type B, and one block of 2N trials which alternate between type A and B (Jersild, 1927). In this design the key dependent measure is the difference in time between the mixed block and the sum of the A and B blocks. More contemporary behavioural
*
approaches to set-shifting use compound stimuli (e.g., number/letter pairs) where the part of the stimulus to which a response is required (number or letter) differs across trials and is indicated, for example, by the position of the stimuli on screen (Meiran, 1996; Rogers & Monsell, 1995). Responses are slower on switch trials than non-switch trials, even when switching occurs in a predictable fashion and ample time is allowed between trials. Broad neuropsychological support for the concept has been adduced from patients with frontal brain injury who show deficits in switching between response sets, as demonstrated by high rates of perseverative errors in tasks such as the Wisconsin Card Sorting Test described below (e.g., Milner, 1963; Nelson, 1976; Stuss et al., 2000), as well as group studies of frontal patients on standard laboratory switching tasks such as those described above (Shallice et al., 2008). Finally, neuroimaging studies of switching tasks suggest a common mechanism for task setting or maintenance localised within left dorsolateral frontal cortex (e.g., Brass et al., 2005; MacDonald et al., 2000). Similar behavioural, neuropsychological and neuroimaging evidence supports a domain-general process of response inhibition (e.g., Aron et al., 2003, 2004; Verbruggen & Logan, 2008). Beyond set-shifting and response inhibition, numerous other candidate executive functions have been proposed. These include memory related functions such as the active maintenance (e.g., Baddeley, 1996; Miller & Cohen, 2001; Smith & Jonides, 1997; Sakai, Rowe & Passingham, 2002), updating (e.g., Miyake et al., 2000; Schmeichel, 2007) and refreshing (Raye et al., 2007) the contents of short-term or working memory, as well as more general process control functions such as response selection (e.g., Bunge et al, 2002; Hegarty, Shah & Miyake, 2000; Szmalec, Vandierendonck & Kemps, 2005), selective attention (Smith & Jonides, 1999), monitoring/checking (Shallice et al., 2008), task management (Smith & Jonides, 1999), and dual-task coordination (e.g., Emerson et al., 1999; Logie et al., 2004).
Subsequent studies using similar sets of tasks have replicated key aspects of Miyake et al.’s (2000) results (Friedman et al, 2008; Friedman & Miyake, 2004). However, a serious limitation of the original study is its reliance on a two-stage process to infer the involvement of executive functions in complex tasks. As previously noted, CFA is first used to establish that the elementary executive tasks tap separable functions and then SEM is used to establish the involvement of those functions in the more complex executive tasks. One concern is that both of these methods involve an element of subjectivity in model selection (e.g., MacCallum & Austin, 2000). More critically, since the factors extracted from this first phase of analysis were used in a second phase to establish the extent to which performance on the complex executive tasks was a function of the individual factors, any statistical error in the first phase is likely to be compounded in the second phase. This is of particular concern because the factors established from the initial CFA were highly correlated.
To illustrate, consider the analyses conducted by Miyake et al. (2000) concerning the factors underlying the production of perseverative errors on the Wisconsin Card Sorting Test (Milner, 1963). The test requires participants to sort cards according to a changing criterion. Each card shows a number of coloured shapes, e.g., four red circles or two blue triangles. Participants sort the cards into piles that match “target” cards according to the number, type or colour of the shapes on the cards. After each sorting attempt they are told only if they were correct or incorrect. To perform well on the test, participants must infer the experimenter’s sorting criterion, but the experimenter changes this criterion when the participant achieves a run of ten (or in some versions six) correct sorts. Perseverative errors arise when a participant continues to sort by an old, no longer valid, criterion, despite receiving negative feedback. Such errors may relate to poor set-shifting (i.e., failure to switch to a new sorting criterion), to inadequate response inhibition (i.e., failure to inhibit sorting to an old and now falsified rule), or even to failure to monitor for and integrate negative feedback. Miyake et al. considered five possible models relating their three factors (set-shifting, memory updating and response inhibition) to the number of perseverative errors produced by their participants. The model they endorsed consists of one path from the set-shifting factor, with a standardised path coefficient of 0.38 for the set-shifting factor. However, the fit of this model (χ2(32) = 25.45; IFI = 1.06)1 is only slightly better than that of a model with paths from both set-shifting and response inhibition (χ2(31) = 25.02; IFI = 1.06), and the model with one path from response inhibition also produces a reasonable fit (χ2(32) = 30.59; IFI = 1.01), with a standardised path coefficient of 0.33 for the response inhibition factor. Critically, three different models produce qualitatively similar fits to the data. While goodness-of-fit statistics may be used to rank order these models, the models are based on factors inferred from the inter-correlations between performance on the nine simple tasks. Any statistical error in these factors could easily alter this rank ordering.
For example, each of Miyake et al.’s (2000) participant’s score on the latent factor of response inhibition is inferred largely from their scores on the antisaccade, stop-signal and Stroop tasks. These are reported to have pairwise intercorrelations of r = 0.19 (antisaccade against stop-signal), r = 0.20 (antisaccade against Stroop interference) and r = 0.18 (stop-signal against Stroop interference). Yet in a near replication of this part of initial study, Friedman and Miyake (2004) report correlations of r = 0.16, r = 0.23 and r = 0.15 respectively. As one should expect from any empirical study, even with over 100 participants the reported values of r clearly include some statistical error. Consequently, the inferred
1
values of the latent variable corresponding to response inhibition (and, by extension, the latent variables corresponding to the other executive functions) for each subject can only be approximations. Thus, while Miyake et al.’s conclusion – that “shifting ability is a crucial component of perseverative errors in the WCST” (Miyake et al., p. 50) – is plausible, further investigation is warranted using complementary methodologies which circumvent the statistical limitations of the combined CFA / SEM approach and which therefore allow convergence onto a particular cognitive architecture.
The current pair of studies attempts to establish the role of elementary executive functions in complex tasks (including the WCST) using a different approach – one based on a dual-task methodology. Thus, the studies reported here document the effects of different secondary tasks (held to tap different executive functions, analogous to the elementary executive tasks of Miyake et al., 2000) on performance of different primary tasks (analogous to the complex executive tasks of Miyake et al., 2000). In all cases, the elementary executive tasks involve auditory input and vocal output, while the complex executive tasks involve visual input and manual output.
Historically, dual-task methodology has been used with great success, particularly in the study of attentional processes and response selection (see, Pashler, 1994, for a review) and in the fractionation of subprocesses involved in short-term memory (e.g., Baddeley & Hitch, 1974). The former case is exemplified by work on the Psychological Refractory Period (PRP), in which participants are required to perform concurrently two simple stimulus-response tasks where the stimuli are presented in quick succession. Typically, the response to the stimulus that is presented second is delayed, and this delay does not decrease appreciably when the interval between the two stimuli is decreased. This appears to imply some degree of serial processing in these simple tasks. Pashler (1994) argues that the data indicate that stimulus processing may occur in parallel, but that there is a bottleneck in the response selection stage such that only one response may be selected at a time, but this position is not universally accepted. Thus, Meyer and Kieras (1997) argue that PRP effects arise from conflicts at the motor level which can be minimised by strategic scheduling of task-related cognitive operations within a central processor, and provide a computational instantiation of this in terms of their Strategic Response Deferment model, which is itself embedded within the EPIC cognitive architecture.
In the latter case, the basic approach is to require participants to perform simultaneously two more complex tasks – a primary task and a secondary task – with non-overlapping input and output requirements. If performance on the primary task is impaired relative to a single-task condition or relative to a condition with another secondary task, then it is inferred that the original two tasks share some processing step or resource. Thus, dual-task interference is a key source of support for the various functional components – the phonological loop, the visuo-spatial sketch pad and the central executive – of the multi-component working-memory model of Baddeley and Hitch (1974).
al., 1997; Miyake et al. 2000). On this latter approach, concurrent task interference would reflect the efficiency of an individual’s dual-tasking ability, but could not be used to further decompose or fractionate the central executive.
This paper develops a third line of work. Baddeley et al. (1998) used a dual-task paradigm in which the primary task was random generation. This task requires that the participant generates from a given response set (e.g., digits) a series of responses that are as random as possible. It was shown that the degree of randomness was affected by the secondary task. When the secondary task was verbal fluency – i.e., to generate as many words as possible in a given period that start with a given letter – the degree of randomness in the primary task was lower than when the secondary task was either to count from a given digit or to recite the alphabet. Baddeley and colleagues interpret their results as reflecting the use of a common switching process by both random generation and category fluency – a position discussed further below. For our purposes, the Baddeley et al. (1998) study raises the possibility of using a dual-task methodology to decompose the central executive and thereby test Miyake et al.’s (2000) SEM analysis of the diversity of executive functioning.
The remainder of this paper reports two experimental studies in which two different primary tasks – random generation, held by Miyake et al. to draw on both memory updating / monitoring and response inhibition, and the Wisconsin Card Sorting Test, held by Miyake et al. to draw primarily on set-shifting – are each coupled with three secondary tasks. The secondary tasks – the digit switching task, the 2-back task and the go-no go task – are similarly held to each draw primarily upon different executive functions (set-shifting, memory updating / monitoring, and response inhibition, respectively). The differential interference patterns that result support a view of the central executive as comprising multiple distinct executive functions, with functions related to set-shifting and memory updating / monitoring playing different roles in the two primary tasks. However, the interference patterns differ from what would be expected given the CFA / SEM analyses of Miyake et al. (2000). The results are interpreted within the context of verbal process accounts of the primary tasks.
Experiment 1: Random Sequence Generation
Interest in random generation as a cognitive task stems from the fact that human participants are poor at producing “random” sequences. Their attempts typically exhibit standard biases. For example, if the task is to generate a sequence of random digits between 0 and 9 (inclusive), participants will typically produce repeat responses (e.g., “2” followed immediately by “2”) at less than chance rates (e.g., Rapoport & Budescu, 1997; Towse, 1998). When items are generated at a fixed pace, increasing that pace typically results in greater redundancy (i.e., greater predictability of response on trial n given the responses on previous trials; Baddeley, 1966, but see Towse, 1998). Randomness is also influenced by factors such as the size of the response set, and whether that response set is externalised (as on a keyboard) or maintained internally (as in the generation of spoken responses) (Towse, 1998).
digit generation task according to several distinct measures of randomness as recommended by Towse and Neil (1998). One measure, equality of response usage, specifically assesses the relative frequency of the different possible responses – if a sequence is random then each response should be approximately equally frequent. Other measures, which we refer to collectively as measures of sequence stereotypy, assess the relative frequency of pairs or larger sequences of responses. Subsequent analyses by Miyake et al. using Structural Equation Modelling based on the individual difference factors established from participant performance on simple executive function tasks suggested that measures which could be interpreted as indicating biases towards or away from stereotyped sequences were associated with the executive function of response inhibition, while measures which could be interpreted as indicating biases related to (in)equality of response usage were associated with the executive function of memory updating.
However, as argued in the introduction, this SEM analysis is based on factors extracted from a preliminary Confirmatory Factor Analysis – factors which are subject to statistical error and which are themselves correlated. The dual-task paradigm offers the prospect of providing an alternative (and potentially complementary) methodology for establishing the contributions of putative executive functions to random generation behaviour because in contrast to individual differences methodology it allows the experimenter to manipulate the demands of the secondary tasks and measure the effects of such manipulations on measures of randomness. Experiment 1 therefore explores the effects of combining random generation with tasks that are assumed to tap different simple executive functions. In all cases the simple executive tasks involve auditorily presented stimuli and vocal responses. The random generation task involves visual presentation of the response set and manual selection from that set, as described below. The random generation task used here thus differs in modality from that used by Miyake et al. (2000) and Baddeley et al. (1998). The difference is motivated only by the requirement that input and output modalities of the primary and secondary tasks should not be shared. While it is clear that the response format has a substantive effect on the sequences generated in random generation tasks (e.g., Towse, 1998), a processing account of random generation (see below) suggests that the executive function requirements of the two task variants should be similar.
Two hypotheses follow from the structural equation models endorsed by Miyake et al. (2000). First, if response inhibition is required to suppress stereotyped response sequences, then such responses should be more frequent when random generation is coupled with a response inhibition task than with a task that primarily taps some other executive function. Second, if memory updating / monitoring is required to monitor response frequency, then measures of equality of response usage should be disturbed when random generation is coupled with a memory updating / monitoring task in comparison to when it is coupled with a task that primarily taps some other executive function.
secondary task that also shares monitoring requirements, then one would expect less randomness in the generated sequence. While this may be reflected in a decrease in equality of response usage, because regulating equality of response usage requires some record of the relative frequency of responses, such a decrease cannot be guaranteed as highly regular strategies (e.g., counting) can still produce low scores on this measure. Moreover, given the process model any change in equality of response usage would not be diagnostic of response inhibition because that dependent measure is also a function of the veracity of monitoring and checking process. A clearer prediction relates to measures of sequence stereotypy, which on this account should be markedly influenced by concurrent performance of a task that demands frequent memory updating and monitoring.
Method
Participants. Thirty-six participants (15 male, 21 female; average age 26 years 11 months) took part in the experiment. Participants were recruited from the university’s volunteer participant panel, which includes undergraduate and postgraduate students, as well as interested laypeople. All participants were paid £5 for their effort.
Design. Participants completed the primary random sequence generation task four times: first as a single task, and then with each of three auditory-vocal tasks: the digit-switching task, the 2-back task, and the go-no go task. The order in which the auditory-vocal tasks were administered was fully counterbalanced. The experiment therefore employed a within-subjects design where the independent variable, secondary task, had four levels: none, digit-switching, 2-back and go-no go. Responses on the random generation task were self-paced. The key dependent variables were therefore response rate and measures of randomness in the random sequence generation task (in each of the four conditions), and accuracy for each of the auditory-vocal tasks.
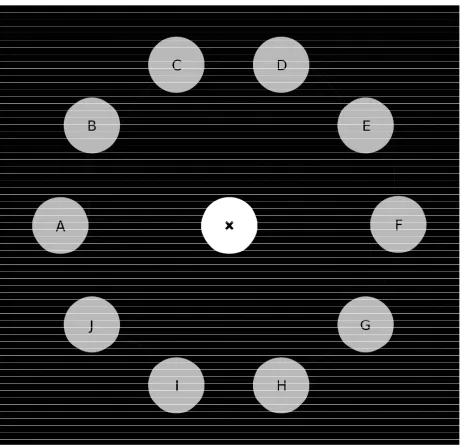
[image:9.595.183.413.86.309.2]The Random Sequence Generation Task. In each block of the random sequence generation task, participants were required to generate a sequence of 100 letters (in the range
‘A’ to ‘J’) using a computer mouse to select each letter from a clock-face type display as shown in Figure 1. The mouse was initially positioned in a disk at the centre of the screen. To select a letter, participants had to move the mouse to one of the ten locations arranged in a circle around the central disk, and click. After selecting a letter the mouse automatically returned to the central position in preparation for the next selection. Participants were instructed to make their selections as “random as possible”. Performance was self-paced but if no selection was made within five seconds a null response was recorded and the screen was reset. In reality, this only occurred during practice trials.
The Auditory-Vocal Tasks. In the digit-switching task, modelled on that of Monsell (2003), participants heard a series of digits (either 1, 2, 3, 4, 6, 7, 8 or 9) at a rate of one digit every 2.5 seconds. Participants were initially required to respond “high” if the digit was greater than 5 and “low” otherwise. After 4 trials of this form, a tone was presented indicating that the required responses had changed and that participants were to respond “odd” if the digit was 1, 3, 7 or 9 and “even” otherwise. Tones were presented after every 4 trials throughout the task to indicate that a switch between the two response sets was required. The dependent variable was accuracy, i.e., the number of correct trials divided by the total number of trials.
In the 2-back task, participants heard a series of digits (in the range 1 to 9, with each digit being equally likely) at a rate of one digit every 2.0 seconds. They were required to respond vocally with “yes” if the current digit was the same as that two trials before. The dependent measures were accuracy (the number of hits and correct rejections divided by the total number of trials) and sensitivity (d′, calculated according to standard principles of signal detection theory).
In the go-no go task, participants heard a series of either single beeps (duration 100 msec) or double beeps (duration 200 msec), with the interval between beep onsets varying randomly from 1.5 seconds to 2.5 seconds. They were required to generate a vocal response (the word “yes”) as quickly as possible after each single beep, but to produce no response after a double beep. Single beeps occurred on 5 out of every 6 trials. As in the 2-back task, the dependent measures were accuracy and sensitivity.
Procedure. Each participant completed four blocks of the visual-manual random sequence generation task. Prior to the first block, participants were familiarised with the random generation task through eight practice trials. They then completed the first block (i.e., 100 trials) of the generation task. During the second, third and fourth blocks, participants were required to perform the random sequence generation task while simultaneously completing one of the three vocal tasks. The order of completion of the auditory-vocal tasks was counter-balanced across participants, with all participants completing each task. In all cases, practice on the auditory-vocal tasks was given prior to performance of the dual-task condition, and the auditory-vocal tasks were continued for as many trials as needed for completion of one block of 100 responses on the random generation task. Upon completion of the fourth and final block, participants were thanked, paid, and debriefed. The complete experimental session lasted approximately 20 minutes.
Results
Descriptive Statistics and Preliminary Analyses. In analysing random generation performance it is common to pre-process response sequences to generate a set of indices of randomness for each sequence (see, e.g., Towse & Neil, 1998). These indices measure different aspects of randomness, and can be treated as the task’s dependent measures. This approach was followed here. In addition to mean response time (RT), six indices were computed for each block of responses:2 R, the redundancy score, which measures the relative use of each response option; RNG, the random number generation score of Evans (1978), which measures the relative use of each pair of responses (e.g., response F followed by response A, or response B followed by response C); RR, the proportion of responses that are repeats of the previous response; AA, the proportion of responses that are spatially adjacent to the previous response (e.g., responding F followed by G or E, or A followed by J or B); OA, the proportion of responses that are spatially opposite to the previous response (e.g., responding F followed by A or H followed by C); and TPI, the turning point index – a measure of the relative number of times responding switches from a clockwise to a counter-clockwise pattern and vice versa.
For each measure of randomness, there is an expected value corresponding to true randomness. R and RNG are entirely independent measures, with deviations from the expected values on R and RNG reflecting biases away from equality of response usage and equality of bigram usage respectively. RR, AA and OA each measure specific bigram biases. Values of RR above 0.1, AA above 0.2 and OA above 0.1 indicate a bias towards repeat, adjacent and opposite response pairs respectively. These three measures are not independent. Rather, they provide a more fine-grained decomposition of the RNG measure. Lastly, TPI is a
2
See Towse and Neil (1998) for formulae for the less obvious measures (R, RNG and TPI). Note that in comparison to Towse and Neil (1998), TPI values reported here are divided by 100 so that, like most other measures of randomness used here, they lie within the 0 to 1 range.
Dep.
Var.
Exp.
Val.
Control Digit-Switching 2-Back Go-No Go
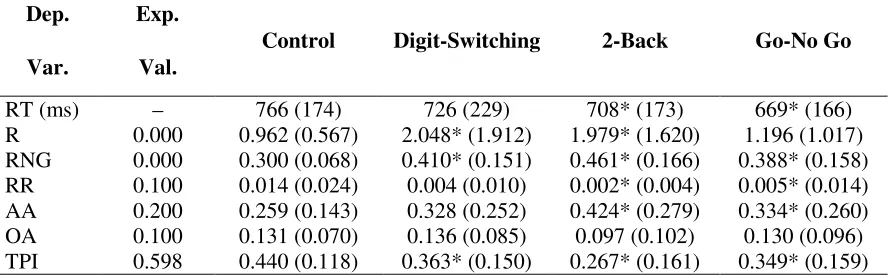
[image:11.595.77.522.97.236.2]RT (ms) – 766 (174) 726 (229) 708* (173) 669* (166) R 0.000 0.962 (0.567) 2.048* (1.912) 1.979* (1.620) 1.196 (1.017) RNG 0.000 0.300 (0.068) 0.410* (0.151) 0.461* (0.166) 0.388* (0.158) RR 0.100 0.014 (0.024) 0.004 (0.010) 0.002* (0.004) 0.005* (0.014) AA 0.200 0.259 (0.143) 0.328 (0.252) 0.424* (0.279) 0.334* (0.260) OA 0.100 0.131 (0.070) 0.136 (0.085) 0.097 (0.102) 0.130 (0.096) TPI 0.598 0.440 (0.118) 0.363* (0.150) 0.267* (0.161) 0.349* (0.159)
trigram measure. Low values of TPI indicate a tendency to move around the clock-face in one direction (either clockwise or counter-clockwise).
Mean scores for each dependent measure in each condition are shown in Table 1. The table also shows the expected value of each measure for a sequence where successive responses are independent (i.e., random).
In order to explore the independence, or otherwise, of the six measures of randomness, correlation coefficients were calculated for each pair of such measures in the control condition (i.e., when random generation was performed in isolation). No association was found between R and RNG (r = 0.001), consistent with the claim that R and RNG measure distinct aspects of randomness. (Indeed, R is not significantly correlated with any other measure of randomness.) Some significant correlations were found between the various bi-gram measures, specifically between RNG and AA (r = 0.433, p = 0.008, two-tailed) and between AA and OA (r = –0.628, p < 0.001, two-tailed). These reflect the facts that a) AA and OA measure biases to the production of specific bigrams which, together, make up the RNG score and b) a bias towards one type of bi-gram (e.g. opposite associates) necessarily results in a bias away from other types of bi-grams (such as adjacent associates). The lack of any significant correlations involving the RR score conceivably reflects the limited range of this measure due to a floor effect, rather than the lack of association.
Participants performed at near ceiling levels on each of the auditory-vocal tasks. Mean response times were significantly faster in the go-no go task (624.6 msec) than the 2-back task (993.1 msec; t(27) = 12.47, p < 0.001), which in turn were significantly faster than in the digit-switching task (1173.3 msec; t(28) = 5.00, p < 0.001).3 Mean accuracy was significantly less in the 2-back task (0.947) than in the digit-switching task (0.981; W(34) = 70.0, p < 0.001) and than in the go-no go task (0.990; W(34) = 70.0, p < 0.001). Signal processing analysis on those tasks for which it is appropriate showed good sensitivity (2-back: d' = 1.301; go-no go: d' = 3.150). Further analysis of the auditory-vocal task data is reported in the appendix.
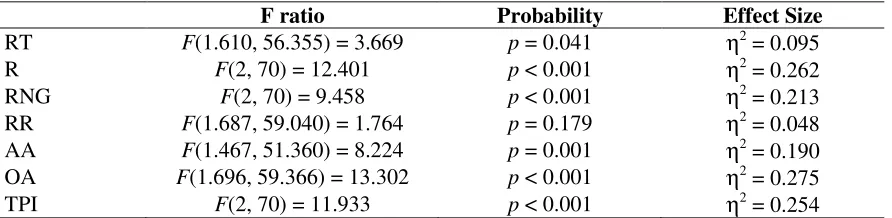
Effects of Secondary Tasks. Our primary interest is in the differential effects of the three secondary tasks. Thus, data from the control condition were ignored in the initial analysis of secondary task effects and one-way within-subjects ANOVAs were conducted on the data from the three experimental conditions. As shown in Table 2, there were significant effects of task on all dependent measures except RR, which in any case was near floor.
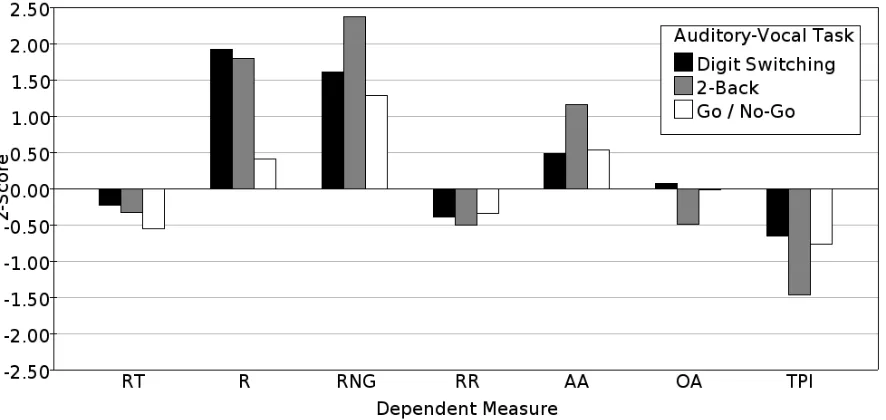
In order to consider the possible differential effects of the auditory-vocal tasks on each dependent measure, the control condition was used to establish baselines for each dependent measure, allowing us to determine whether concurrent performance of the different auditory-visual secondary tasks resulted in more or less extreme deviations from the baseline. Figure 2 shows how the various dependent measures pattern for the three dual-task conditions when all dependent measures in the experimental conditions are converted to z-scores with respect to their distribution in the control condition. Informally, it appears that R is affected greatly by concurrent performance of either the digit-switching task or the 2-back task, but only slightly by concurrent performance of the go-no go task. In contrast, all other measures of randomness appear to be most affected by concurrent performance of the 2-back task, with the digit-switching and go-no go tasks having similar, lesser, effects.
The reliability of the above observations was tested with a number of post-hoc t-tests using a Bonferroni correction to guard against type 1 errors. Given that there are three
3
auditory-vocal tasks (and hence three pair-wise comparisons) and the post-hoc comparison requires bi-directional hypotheses, we adopt a critical value of 0.05 ÷ 6 = 0.008. At this highly conservative level, participants generated letters significantly more rapidly when simultaneously performing the go-no go task than the digit-switching task (t(35) = 2.95, p = 0.003). Responses were also generated more rapidly in the go-no go task than in the 2-back task, though the difference was not significant at the adjusted level (t(35) = 2.17, p = 0.019). The sequences generated with the go-no go task were also characterised by significantly lower R scores (versus digit-switching: t(35) = 4.40, p < 0.001; versus 2-back: t(35) = 4.34, p < 0.001). In both cases (RT and R), the difference between the digit-switching task and the 2-back task did not approach significance (RT: t(35) = 0.68, n.s.; R: t(35) = 0.36, n.s.). To summarise, while responses in all dual-task conditions were generated more quickly than in the control condition (presumably due to a practice effect), responses were generated at a significantly slower rate in the digit-switching and 2-back conditions than in the go-no go condition. A similar effect occurs with R scores, with them being similarly (and significantly) affected when random generation was combined with the digit-switching and with 2-back tasks, but less affected when the secondary task was the go-no go task.
For the five other dependent measures (RNG, RR, AA, OA and TPI), Figure 2 shows that concurrent performance of the 2-back task had the greatest effect (in comparison to the control condition), with the digit-switching and go-no go tasks producing similar more moderate effects. Thus, RNG score was significantly greater in the 2-back condition than the digit-switching condition (t(35) = 2.82, p = 0.004) or the go-no go condition (t(35) = 3.78, p < 0.001), but did not differ reliably between the digit-switching and go-no go conditions (t(35) = 1.57, n.s.). This pattern was repeated for AA (2-back versus digit-switching: t(35) = 3.39, p = 0.001; 2-back versus go-no go: t(35) = 2.83, p = 0.004; digit-switching versus go-no go: t(35) = 0.37, n.s.), OA (2-back versus digit-switching: t(35) = 4.87, p < 0.001; 2-back versus go-no go: t(35) = 3.46; p = 0.001; digit-switching versus go-no go: t(35) = 0.87, n.s.), and TPI (2-back versus digit-switching: t(35) = 4.85, p < 0.001; 2-back versus go-no go: t(35) = 3.56; p = 0.001; digit-switching versus go-no go: t(35) = 0.64, n.s.).4
4
RR showed the same pattern of effects, though for this dependent measure the effects were not statistically significant: 2-back versus digit-switching: t(35) = 1.65, p = 0.053; 2-back versus go-no go: t(35) = 1.60, p = 0.059; digit-switching versus go-no go: t(35) = 0.54, p = 0.295. The failure of these tests to reach statistical significance is, we suggest, the result of a floor effect in the RR measure.
F ratio Probability Effect Size
RT F(1.610, 56.355) = 3.669 p = 0.041 η2
= 0.095 R F(2, 70) = 12.401 p < 0.001 η2 = 0.262 RNG F(2, 70) = 9.458 p < 0.001 η2 = 0.213 RR F(1.687, 59.040) = 1.764 p = 0.179 η2 = 0.048 AA F(1.467, 51.360) = 8.224 p = 0.001 η2
= 0.190 OA F(1.696, 59.366) = 13.302 p < 0.001 η2 = 0.275 TPI F(2, 70) = 11.933 p < 0.001 η2 = 0.254
[image:13.595.73.519.88.197.2]The effect of combining random generation with the auditory-vocal tasks may be summarised as follows: a) for all measures apart from response time, the go-no go task produced the least interference; b) the digit-switching and 2-back tasks had similar effects on R scores, resulting in significant increases in both scores (taking them further from their observed values in the control condition); however, c) on all measures of bi-gram associations (RNG, RR, AA and OA) and tri-gram associations (TPI), combining random generation with the 2-back task was found to consistently result in more interference (in the form of more extreme divergence from the control conditions) than combining it with either the digit-switching or the go-no go task. Moreover the digit-digit-switching and go-no go tasks had statistically equivalent effects on these measures. Thus, combining random generation with the 2-back task yielded a higher RNG score, fewer repeat responses, more adjacent responses, fewer opposite associates, and a lower turning point index than when either the digit-switching or the go-no go task was combined with random generation. The digit-digit-switching and go-no go tasks produced similar mean values for all five indices, which in all five cases were closer to the control means.
Discussion
The results of Experiment 1 suggest that, as hypothesised, the executive or control requirements of a complex task may be fractionated by combining that task with different secondary tasks that have different executive requirements, particular when the complex task produces multiple dependent measures that are potentially differentially dependent on different executive functions. Thus, if we assume that the digit-switching task primarily taps the executive function of set-shifting, the 2-back task primarily taps the executive function of
[image:14.595.80.523.117.327.2]memory maintenance, monitoring and updating, and the go-no go task primarily taps the executive function of response inhibition – assumptions to which we return both below and in the General Discussion – then the cognitive processes which are reflected in the R score (equality of response usage) appear to be dependent more on set-shifting and memory maintenance, monitoring and updating than on response inhibition, while the processes reflected in the measures of sequence stereotypy appear to be more dependent on memory maintenance, monitoring and updating than on either set-shifting or response inhibition.
This interpretation, in terms of the differential executive requirements of the auditory-vocal tasks, has clear implications for discriminating between the hypotheses based on the structural equation model of Miyake et al. (2000) and the more process-oriented accounts of Rapoport and Budescu (1997) and Baddeley et al. (1998) that served in part to motivate Experiment 1. Consider first the structural equation model endorsed by Miyake et al. Recall that on the basis of this model it was hypothesised that stereotyped response sequences would be more frequent when random generation was coupled with a response inhibition task (the go-no go task) than with a task tapping some other executive function. This was not found. Contrary to the model, no measures of response stereotypy (i.e., bi-gram or tri-gram association scores) were affected more by response inhibition task than by the other secondary tasks. This result cannot be taken as strong evidence against the Miyake et al. position on measures of prepotent associates, however, as it is possible that the response inhibition task was insufficiently challenging. In the go-no go task, inhibition of a response was required on only one in every six trials, accuracy was very high, and response times were generally fast.
More problematic for the position of Miyake et al. are the results related to equality of response usage. It was also hypothesised on the basis of Miyake et al.’s favoured structural equation model that this measure would be most disrupted when random generation was coupled with a memory updating / monitoring task. While equality of response usage was disrupted by such a secondary task, it was equally disrupted by the set-shifting secondary task. Paralleling the putative argument related to response inhibition, one might suggest that the set-shifting requirements of the digit-switching task are in some sense greater than the memory updating / monitoring requirements of the 2-back task, and thus the digit-switching task impacted more on equality of response usage than would have been the case if the two secondary tasks were balanced for their executive function difficulty. Note though that while response times in the digit-shifting task were significantly slower than in the 2-back task, accuracy was significantly higher. So an account in terms of differential difficulty of the executive requirements of the secondary tasks is not satisfactory. Thus, the predictions derived from the structural equation model found by Miyake et al. (2000) to produce the best fit to the data are not supported by the dual-task results.
The verbal process model fares better. On the basis of this account it was hypothesised that measures of randomness related to sequence stereotypy would be impaired when random generation was combined with a secondary memory updating / monitoring task. This is precisely what was found, with all five sequence stereotypy measures (RNG, RR, AA, OA and TPI) being most strongly affected (i.e., deviating more, either positively or negative) relative to control when the random generation task was coupled with the 2-back task. Thus, we interpret our results as supporting the claim that the 2-back task impairs memory monitoring / updating during the random generation task, leading to an impairment in the detection of patterns.
changes when coupled with the 2-back task: The number of adjacent associates increases at the expense of opposite associates and repeat responses. On the verbal process model, this suggests that for this version of random generation the response schema move to an adjacent position in the absence of effective memory monitoring / updating, is more likely to be selected (or at least not rejected) than the schemas move to the opposite position or repeat the previous response.
Neither the structural nor the verbal process accounts provide an immediate explanation of the other main feature of the data, namely that R, equality of response usage, was equally and significantly adversely affected when random generation was coupled with either the digit-switching or the 2-back task, but barely affected when random generation was coupled with the go-no go task. We have not considered how response frequencies might be balanced during random generation, but it would seem that there are two possibilities: either that a process of monitoring detects frequent candidate responses before they are produced and such responses are subsequently inhibited, or that monitoring detects infrequent responses and such responses are deliberately selected. Both possibilities imply that R is likely to be adversely affected if monitoring is impeded, as we assume it is when simultaneously completing the 2-back task. Thus, both accounts are consistent with the effect of the 2-back condition on R. However, the fact that R is significantly adversely affected by digit-switching suggests that this deliberate selection involves both memory and set-shifting functions.5
A further point worthy of comment concerns the number of repeat responses (the RR score) across the various conditions. The strong tendency to produce fewer repeat responses than would be expected by chance is frequently reported in random generation tasks (e.g., Baddeley et al., 1998; Rapoport & Budescu, 1997; Towse & Valentine, 1997), and it was apparent in our control condition (mean RR = 0.014, when chance would dictate RR = 0.100). However, the tendency to avoid such responses was even stronger in all dual-task conditions. This supports an account in which responses are automatically inhibited after they are generated, and in which this inhibition needs to be actively overcome in order to produce a repeat response (Baddeley et al., 1998; Towse & Valentine, 1997), rather than one in which repeat responses are rejected as part of the monitoring process.6
There is an alternative explanation for the results of Experiment 1 that we have not considered. The interference pattern could result from a single factor (task difficulty or cognitive load) if the various dependent measures are differentially dependent on that factor. In particular, the interference pattern could result if a) the 2-back task is harder than the digit-switching task which is in turn harder than the go-no go task, and b) the R score is heavily dependent on central resources and so is affected substantially by tasks of even moderate difficulty (i.e., both the 2-back and digit-switching tasks), but c) the various bi-gram scores are only mildly dependent on central resources and so are only substantially affected when random generation is combined with the most difficult task – the 2-back task. Experiment 2 is designed in part to rule out this possibility by considering interference effects on a further
5
An alternative possibility is that set-shifting is itself dependent on memory processes (Altmann & Gray, 2008). This may account for similar effects of the digit-switching and 2-back tasks on the R score. It would suggest, however, that all dependent measures should pattern similarly with respect to these secondary tasks. This is not what was observed.
6
primary task that is frequently held to require the executive function of set-shifting, the Wisconsin Card Sorting Test (e.g., Miyake et al., 2000). A second purpose of Experiment 2 is to further demonstrate the utility of the dual-task methodology for fractionating executive functions by applying it with a different primary task.
Experiment 2: Wisconsin Card Sorting Test
The Wisconsin Card Sorting Test (WCST), as described in the introduction, requires participants to use feedback (positive or negative) to sort cards according to a criterion that may change during the test without notice. Traditionally the test was considered to assess frontal function, with frontal patients typically producing high rates of perseverative error responses following a change by the experimenter in the sorting criterion. But the test is multi-componential (Reverberi et al., 2005; Stuss et al., 2000). In order to avoid perseverative responses, participants must respond appropriately given negative feedback. They must deduce that the previous criterion no longer applies, they must inhibit any response based on that criterion, they must deduce a new plausible criterion, and they must switch to this new criterion.
Miyake et al. (2000) endorse the view that perseverative errors on the task result from a failure by the participant to switch the sorting criterion in response to negative feedback. This is supported by their structural equation modelling, though as we have argued this support is not strong. Dunbar and Sussman (1995) argue for a related account of the origins of perseverative errors. They used a dual-task paradigm in which WCST was paired with a range of tasks varying in working memory requirements and found that perseverative errors were more frequent when the secondary task involved the phonological loop (e.g., when participants were required to repeat a nonsense syllable) than when it did not (e.g., when it involved addition or tone detection). Dunbar and Sussman interpret their results as indicating that perseverative errors arise from a failure to maintain information in the phonological loop. It is unclear what information must be maintained in the phonological loop to avoid such errors, but presumably it involves verbalisation of the sorting criterion hypothesised by the participant. In fact, more recent work suggests that verbal mediation may facilitate task switching (e.g., Baddeley, Chincotta & Adlam, 2001; Kirkham, Cruess & Diamond, 2003; see Cragg & Nation, 2010, for a review). The accounts can therefore be seen to be related.
Two alternative accounts of WCST errors come from the neuropsychological literature. Stuss et al. (2000) had patients with frontal brain lesions perform the WCST under several conditions, manipulating the degree of instructional support given about possible rules and rule changes. Different subgroups of frontal patients were prone to different types of error in the different conditions. Thus, patients with dorsolateral or superior medial frontal lesions were especially prone to perseverative errors, but superior medial patients tended to make fewer set loss errors – errors in which a string of correct responses that had obtained positive feedback is followed without obvious reason by an erroneous response – than patients with left or right unilateral dorsolateral lesions, while patients with inferior medial frontal lesions were specifically prone to set loss errors and relatively immune to perseverative errors. The implication of these results is that different regions of prefrontal cortex support different functions required for successful completion of the WCST.
underlying the sequence defined by the exemplars changed without warning. For some patients, poor performance on the test could be accounted for by poor working memory. This was not the case for left lateral patients, who appeared to be specifically impaired on inducing possible rules based on the known exemplars.
Together, these neuropsychological studies suggest that the processes involved in the generation and regulation of WCST performance may be fractionated, with separable processes responsible for the prevention of perseverative errors, the prevention of set loss errors, and the generation of candidate rules (i.e., sort by number, colour, or shape). This suggests a further set of hypotheses, namely that completion of the WCST with different secondary tasks that interfere with these subprocesses will bias participants towards different types of errors. More specifically, the view considered above that perseverative errors result from a failure to switch the sorting criterion implies that perseverative errors should increase when WCST is paired with a secondary task that loads on set-shifting (e.g., the digit-switching task) relative to secondary tasks of similar difficulty that do not (e.g., the 2-back task or the go-no go task).
Method
Participants. Forty-eight participants (19 male, 29 female; average age 26 years 9 months) took part in the experiment. Participants were recruited from the university’s volunteer participant panel, which includes undergraduate and postgraduate students, as well as interested laypeople. All participants were paid £5 for their effort. No participants completed both Experiments 1 and 2.
Design. As in Experiment 1, participants completed the primary task – which in this case was a computer-administered 64-card version of the Wisconsin Card Sorting Test – four times: first as a single task, and then in three dual-task conditions with each of three auditory-vocal tasks. The experiment therefore employed a within-subjects design where the independent variable (secondary task) had four levels: none, digit-switching, 2-back and go-no go. The key dependent variables were the standard ones for the WCST, namely number of categories achieved and the number and type of errors made in each condition. Accuracy on the secondary tasks was also recorded. The auditory-vocal tasks were exactly as in Experiment 1. Thus, the only difference between Experiment 1 and Experiment 2 was in the choice of visual-manual task.
The Wisconsin Card Sorting Test. The WCST was administered according to the “64A” procedure of Stuss et al (2000). Thus, 64 cards were used in each administration, the correct sorting category changed when participants achieved a sequence of 10 consecutive correct responses, and participants were not informed of such changes. The initial correct sorting category (colour, number or shape) was varied over blocks.
Procedure. Each participant completed four blocks of the Wisconsin Card Sorting Test.7 Prior to the first block, participants were familiarised with the sorting aspect of the task through four practice trials. They then completed the first block (i.e., 64 cards) of the WCST.
7
During the second, third and fourth blocks, participants were required to perform the WCST while simultaneously completing one of three auditory-vocal tasks. The order of completion of the auditory-vocal tasks was counter-balanced across participants, with all participants completing each task. In all cases, practice on the auditory-vocal tasks was given prior to performance of the dual-task condition, and the auditory-vocal tasks were continued for as many trials as needed for completion of one block of the WCST. Upon completion of the fourth and final block, participants were thanked, paid, and debriefed. The experimental session lasted approximately 30 minutes.
So as to avoid machine-related interference between concurrent tasks, one PC was used to administer the WCST and a second to administer the auditory-vocal tasks. Participants sat at a comfortable distance in front of the monitor attached to the PC that administered the WCST and interacted with that PC through a mouse operated by their preferred hand. In blocks 2, 3 and 4 they wore noise-reducing headphones through which auditory stimuli were presented and they directed their vocal responses to a nearby microphone. The experimenter sat behind the participant and recorded all responses to each auditory-vocal task.
Results
Descriptive Statistics and Preliminary Analyses. Participant performance on the Wisconsin Card Sorting Test was scored according to standard procedures (Heaton, 1981), yielding scores for total number of categories achieved, number of cards correctly sorted, number of trials to achieve the first category (TFC), number of classical perseverative errors (CPE) and number of non-perseverative errors (NPE). Since the number of errors varied across condition, an additional dependent measure was calculated – the proportion of errors that were perseverative (PP). This was computed as the ratio of the number of classical perseverative errors divided by the total number of errors. Means for all dependent measures in each condition are shown in Table 3.
Participants performed best in the control condition, achieving more correct sorts, more categories, taking fewer cards to obtain the first category, and making fewer errors of each type, despite them being naïve to the task. With the exception of the PP measure, all dependent measures were strongly inter-correlated (e.g., categories versus correct: r = 0.899, p < 0.001; categories versus TFC: r = –0.665, p < 0.001; categories versus CPE: r = –0.965, p < 0.001; categories versus NPE: r = –0.857, p < 0.001; but categories versus PP: r = 0.207, p = 0.159). This is to be expected. For a participant to achieve many categories s/he must sort most cards correctly, which in turn means that s/he must make relatively few errors (perseverative or non-perseverative). S/he must also achieve the first category relatively quickly.
Dependent
Variable Control
Digit-Switching 2-Back Go-No Go
Categories 3.77 (1.10) 2.00* (1.52) 2.67* (1.46) 3.21* (1.39) Correct 49.21 (6.74) 40.13* (9.95) 43.25* (9.85) 46.54* (7.72) TFC 14.08 (7.22) 33.27* (21.56) 23.79* (19.49) 21.00* (15.78) CPE 10.02 (4.81) 16.96* (8.15) 15.42* (6.34) 11.83* (6.03) NPE 4.77 (2.45) 6.92* (4.01) 5.33 (4.97) 5.63 (3.05) PP 0.69 (0.09) 0.71 (0.11) 0.77* (0.13) 0.68 (0.13)
As hypothesised, performance was poorest in the dual-task digit-switching condition, though the effect of this dual-task was not restricted to perseverative errors – it was accompanied by an increase in trials to first category (TFC) and an increase in non-perserverative errors (NPE). Because of this increase in non-perseverative errors, the proportion of errors that were perseverative (PP) was greatest not in the digit-switching condition but in the 2-back condition.
With respect to auditory-vocal task performance, and as in Experiment 1, mean response times were significantly faster in the go-no go task (762.3 msec) than in the 2-back task (1079.5msec; t(41) = 16.86, p < 0.001), which in turn were significantly faster than in the digit-switching task (1312.3msec; t(41) = 14.58, p < 0.001). The difference in mean accuracy on the digit-switching (0.897) and the 2-back (0.911) tasks was not significant (t(47) = 1.08), but accuracy on both tasks was significantly less than that on the go-no go task (0.935; digit-switching versus go-no go: W(48) = 336, p = 0.008, uncorrected; 2-back versus go-no go: W(48) = 367.5, p = 0.012, uncorrected). Signal processing analysis on those tasks for which it is appropriate showed good sensitivity (2-back: d' = 1.293; go-no go: d' = 2.896).
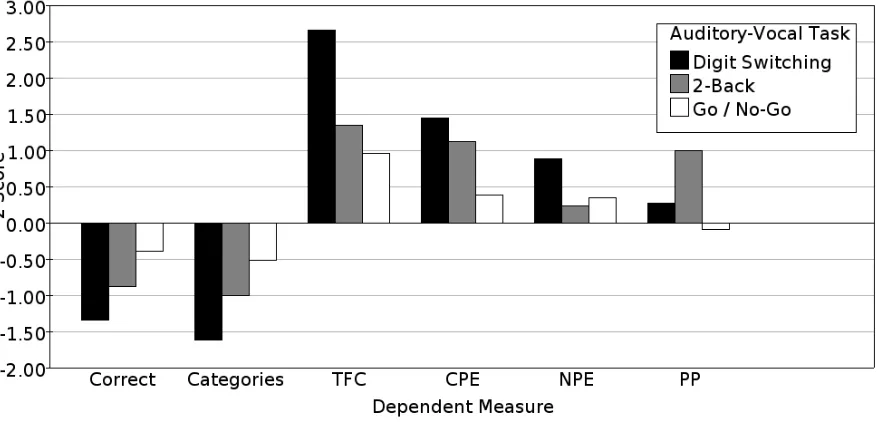
Effects of Secondary Task. In order to visualise the dual-task interference on the various dependent measures, all dual-task scores for all dependent measures were converted to z-scores based on the means and standard deviations derived from the control condition distributions. The result is shown graphically in Figure 3.
[image:20.595.82.523.104.315.2]It is clear from the figure that the digit-switching task has the greatest effect on the first five dependent measures, while the 2-back task generally has an intermediate effect with the go-no go task having the least effect. However, this pattern is not reflected for PP (the proportion of errors that are perseverative). Thus, while the number of classical perseverative errors is greatest for the digit-switching condition, the number of non-perseverative errors is also high in this condition, and so if error rate across conditions is controlled, the proportion
of errors that are perseverative is greater when WCST is combined with the 2-back task than when it is combined with either of the other auditory-vocal tasks.
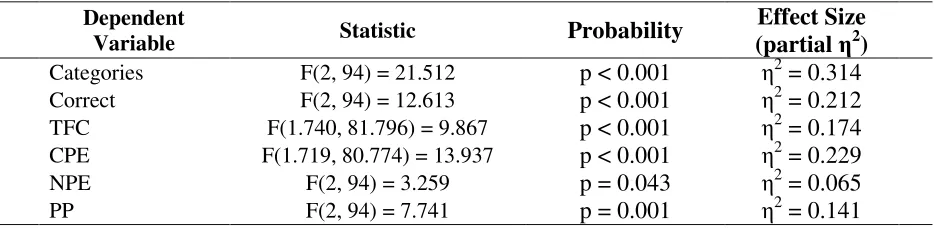
As in Experiment 1, all participants performed the control condition (WCST alone) prior to the three experimental conditions. Following the logic of analysis for Experiment 1, data from the control condition were therefore ignored and one-way ANOVAs were conducted on the data from the three experimental conditions. As shown in Table 4, there were significant effects of task on all dependent measures.
Post-hoc t-tests were performed to assess the reliability of the differential effects. Assuming a Bonferroni corrected critical value of 0.008 as in Experiment 1, significantly fewer categories were achieved in the digit-switching condition than in the 2-back condition (t(47) = 3.48, p = 0.001) and in the 2-back condition than in the go-no go condition (t(47) = 3.27, p = 0.001). Similarly, significantly fewer cards were correctly sorted in the digit-switching condition than the 2-back condition (t(47) = 2.51, p = 0.008), and in the 2-back condition than the go-no go condition (t(47) = 2.88, p = 0.003). Significantly more trials were required to obtain the first category during the digit-switching condition than in the 2-back condition (t(47) = 2.84, p = 0.003) or the go-no go condition (t(47) = 4.21, p < 0.001), but the difference between the 2-back condition and the go-no go condition was not significant (t(47) = 1.19, n.s.).
With respect to errors, more perseverative errors were made in the digit-switching condition than in the 2-back condition (t(47) = 1.52, n.s.), and more in the 2-back condition than the go-no go condition (t(47) = 4.52, p < 0.001), but only in the latter case was the difference statistically significant. The pattern for non-perseverative errors was similar, with more non-perseverative errors in the digit-switching condition than the go-no go condition (t(47) = 2.01, n.s.) and marginally more in the go-no go condition than the 2-back condition (t(47) = 0.41, n.s.). Only the difference between the extremes (i.e., between the digit-switching and 2-back conditions) reached corrected statistical significance (t(47) = 2.54, p = 0.007).
Turning to the derived measure, the proportion of perseverative errors was significantly greater in the 2-back condition than either the digit-switching condition (t(47) = 2.847, p = 0.003) or the go-no go condition (t(47) = 3.478, p = 0.001), but the measure did not differ reliably between the digit-switching and go-no go conditions (t(47) = 1.316, n.s.). Further analysis of the auditory-vocal task data is reported in the appendix.
Dependent
Variable Statistic Probability
Effect Size (partial η2)
Categories F(2, 94) = 21.512 p < 0.001 η2 = 0.314
Correct F(2, 94) = 12.613 p < 0.001 η2 = 0.212
TFC F(1.740, 81.796) = 9.867 p < 0.001 η2 = 0.174
CPE F(1.719, 80.774) = 13.937 p < 0.001 η2 = 0.229
NPE F(2, 94) = 3.259 p = 0.043 η2 = 0.065
[image:21.595.65.532.88.202.2]PP F(2, 94) = 7.741 p = 0.001 η2 = 0.141
Discussion
At first glance it appears that, as hypothesised, performance on WCST was more affected by a secondary task held primarily to involve set-shifting (the digit-switching task) than secondary tasks held primarily to involve other executive functions (the 2-back task and the go-no go task). However, the decrement in performance was evidenced not only by an increase in classical perseverative errors in the critical condition, but also by an increase both in non-perseverative errors and in the number of trials required to attain the first rule, and by a decrease both in cards correctly sorted and in categories achieved. Thus, the effect of the digit-switching task on the WCST was not selective.
This non-selectivity could be taken to suggest that the digit-switching task is simply more resource-intensive than the two other auditory-vocal tasks. Response times were, after all, slower in this task than in either of the other auditory-vocal tasks. Much of Figure 3, for example, is easy to interpret if the digit-switching task is harder than the 2-back task and that in turn is harder than the go-no go task. However, any attempt to account for these results by arguing that the secondary tasks vary along a single dimension (e.g., task difficulty) fails to account for the effects of secondary task on the perseveration proportion measure, which was significantly inflated in the 2-back condition, or for the effect of the 2-back condition on measures of bi-gram associations in Experiment 1. These imply, if anything, that the 2-back task is the most difficult of the three. A more subtle conclusion is therefore required.
What processes must occur following an error (and so negative feedback) on the WCST in order to avoid a subsequent error? One must internalise the negative feedback, reject the current hypothesis (e.g., that the sorting criterion is colour), and generate an alternative hypothesis (e.g., that the sorting criterion could be shape). Perseverative errors are likely to arise if one were to ignore negative feedback (through failure to monitor incoming information). In contrast, if one were to reject the current hypothesis but select an alternative at random, then both perseverative and non-perseverative errors are likely to arise. Thus, we suggest that the interference pattern supports a componential account of WCST in which simultaneous performance of the 2-back task impairs monitoring – a process essential to success on the 2-back task – while simultaneous performance of the digit-switching task impairs some other process such as hypothesis generation.
Since multiple factors may result in perseverative errors this componential analysis and the relation between the current studies and patient studies must remain somewhat tentative. In particular, it is conceivable that different factors lie behind the increase in perseverative errors reported here when the WCST is combined with the 2-back task than in the dual-task studies of Dunbar and Sussman (1995) and in the patient studies of Stuss et al. (2000). Most critically, however, the data appear to rule out any account of the interference effects based on a single task dimension (such as difficulty). As in Experiment 1, the results support a multi-component account of executive functioning. Equally, while the interference pattern is consistent with a set-shifting factor playing a major role in WCST performance, it does not support the single factor model (based on the set-shifting factor) endorsed by Miyake et al. (2000) arising from their SEM analysis.
General Discussion
different secondary tasks vary on a single dimension (e.g., task difficulty). Moreover, the interference patterns argue against the involvement of the specific executive functions attributed by Miyake et al. (2000) to random generation and WCST performance on the basis of statistical analysis of individual differences data. In contrast, they support an account of both tasks in which both set-shifting and memory updating / monitoring play critical roles.
Comparison of Experiment 1 and Experiment 2
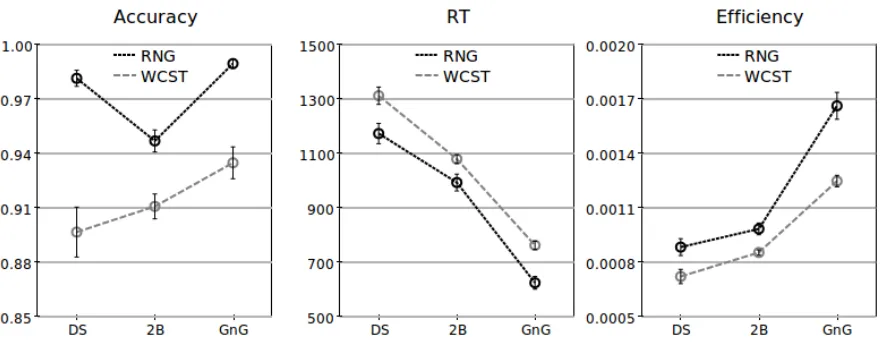
Experiment 1 and Experiment 2 differ only in the primary task used. Secondary task performance on the two experiments may therefore be directly compared. Figure 4 shows the effect of the different primary tasks (from Experiment 1 and Experiment 2) on secondary task accuracy, response time and efficiency (defined as accuracy divided by response time). All secondary tasks were performed more slowly and with more errors in Experiment 2 than in Experiment 1. Accuracy on the digit-switching task was particularly affected when that task was coupled with the WCST in comparison to when it was coupled with random generation, but as shown in the right-most panel, ranking secondary tasks by efficiency produces the same ordering in the two experiments.
[image:23.595.80.525.100.273.2]One reason why the data shown in Figure 4 are important is that rate of responding differed across the secondary tasks. Thus, the inter-trial interval of the digit-switching task was 2.0 seconds, but for the 2-back task it was 2.5 seconds and for the go-no go task it varied between 1.5 and 2.5 seconds. These rates were set during pilot work so as to allow sufficient time for participants to respond while still making each task moderately demanding. However, given this, participants may have developed different time-sharing strategies or different relative prioritisations of the primary and secondary tasks in the different experimental conditions across the two experiments. Analysis of response times to secondary tasks (presented above but shown graphically in Figure 4, centre panel) shows no evidence of varying task prioritisation over Experiment 1 and Experiment 2. Thus, while responses to the secondary tasks were slower in Experiment 2 than in Experiment 1, the rank ordering of response times to the secondary tasks did not vary across the experiments. Moreover, the