7386
A STUDY ON THE RELATIONSHIP BETWEEN BIRTH
WEIGHT OF CHILDREN AND ADOLESCENTS WITH
DISABILITIES AND THE CURRENT INCIDENCE OF
DISEASES IN INFORMATION SYSTEMS
1MYUNG JI JUNG, 2KWANG OK LEE, 3EUN SOOK LEE,
1 College of Medicine, Yonsei University, Wonju, South Korea 2 Department of Nursing, Sangmyung University, Cheonan, South Korea
3 Department of Nursing, Kyungdong University, Wonju, South Korea
E-mail: 1 [email protected], 2 [email protected], 3 [email protected]
ABSTRACT
Against the backdrop of increase in low birth weight babies recently in Korea, this study aimed to examine their health problems after growing up compared to those at the same age born with normal weight and to provide basic data in information systems for preventive measures. Particularly, the study tried to identify the effect of the weight at birth of children and youths with disability on their current health condition in information systems. The study was conducted for 2 months from May 6 to July 16, 2009 with children with disability, and chose 10 schools where teachers and parents gave consent, out of 50% of schools for children with disability selected randomly. Questionnaires were distributed to 2,163 students in elementary, middle, and high schools among children and youth with intellectual, physical, and both intellectual and physical disabilities nationally, and the survey was conducted. Respondents also included 949 parents of those students who agreed to participate. The survey consisted of structured 19 questions. As a dependent variable, the parents were asked to answer whether their children currently had diseases and if so, to name the diseases diagnosed at hospitals. As an independent variable, they were asked to write whether their children were born with low weight and how much they actually weighed at birth. General characteristics of study subjects were analyzed with a technical statistical analysis, and x2 test and one-way ANOVA were
applied to variables of general characteristics. The risk rate of diseases related to the birth weight was analyzed using multilevel logistic regression. In conclusion, those born as premature showed a higher risk of disease in school age and puberty and also a higher incidence of heart disease and other diseases than those born with normal weight.
Keywords: , Information Systems, Relationship, Birth Weight, Disability, Incidence Of Disease
1. INTRODUCTION
Birth weight not only correlates with mortality in infancy and early childhood, but is also known to influence physical and mental health. Many studies report that birth weight has an influence not just in infancy, but even in early childhood and post-childhood. With respect to birth weight, the mortality of infants born at less than 2,000g was found to be the highest at 126.6, and as birth weight increased, infant mortality showed a tendency to decrease, coinciding with most preceding research.1
Additionally, it was found that a normal-weight baby has a high probability of survival even in infancy2, and Xu et al. (1998) have reported that
mortality risks before the age of 15 were significantly higher for low birth weight infants of
1,500-2,499g than for infants weighing more than 2,500g, or normal birth weight infants.3 According
7387 is determined by social and economic factors and the circumstances of a specific time period. As clarified by a number of researchers, the ratio of low birth weight to normal birth weight infants is paradoxically increasing, despite socioeconomic development.5, 6 According to recent trends of
change in population dynamics in Brazil, the mortality rate of premature babies has decreased, whereas the mortality rate of low birth weight babies is ever increasing, in the midst of a period characterized by change in age structure, decrease in infant mortality, decrease in childbirth, and population aging.7
According to the 1993 infant death survey data of total births in Korea by study8 the most common
cause of infant death was found to be fetal growth disorders in premature babies, or low birth weight infants. Additionally, according to the 1966 census data on infant death in Korea, the birth weight group with the highest infant mortality rate was found to be those infants with a birth weight of less than 1,500g, with a mortality rate of 445.0. The group with the lowest infant mortality rate was found to be those with a birth weight of over 3,500g, with a mortality rate of 2.0. Risk of death during early childhood was 5.42 times (95% CI 1.80-10.49) greater for the under-1,500g birth weight group than the over-3,500g birth weight group. In addition, infant mortality with respect to birth weight in 1996 in Korea was found to be 254.6 in the under-1,500g group, 26.7 in the 1,500-2,499g group, and 1.2 in the 2,500-3,499g group; thus, with increase in birth weight, infant mortality drastically decreased. Overseas research shows characteristics similar to Korea; for example, Vanlandingham et al. (1988) analyzed death levels among 104,511 white births in six states in the US, finding that newborn mortality was 433.7 in the under-1,500g birth weight group and 2.0 in the 2,500-3,999g group.1
Furthermore, even with respect to health condition during the child’s growth period, low birth weight infants were surveyed to have a higher incidence and prevalence of a number of diseases than normal birth weight infants, and the WHO has classified low birth weight as a risk factor in heart diseases.1 As a result of continuous, intensive
observation for 25 years since the 1980s, the WHO has also reported that low birth weight has a correlation with diseases such as high blood pressure, angina, diabetes, and so on during or after one’s maturation.9-12
In the US alone, more than half a million premature babies are born every year, which is
coming to the fore as a serious health problem at the national level.13 According to reports prepared
by 440 institutions in 2003 related to diseases among 34,500 people comprising 65% of very low birth weight (VLBW) infants, a large number of infants in this category died after six to seven years, or were hospitalized due to a string of diseases. Among VLBW infants, births with weight less than 1,000g showed the highest disease state. In addition, according to research reports on a similar subject prepared by a number of research institutes in the US, the ratio of risk for extremely low birth weight (ELBW) infants greatly increases due to their low levels of health and underdeveloped nervous system.14
Bogin’s (1999) results showed a high prevalence of chronic diseases in such ELBW infants when they entered childhood and adolescence in about eight to nine years, while low birth weight infants also showed the same symptoms as ELBW infants after they grew up.15
According to recent statistics on Korea, the number of low birth weight infants below 2,5kg has shown a gradually increasing trend, with 4.0% in 2003, 4.2% in 2004, 4.3% in 2005, and 4.3% in 20068; as yet there has been no report concerning
what health difficulties low birth weight infants might suffer as they grow into school-age children and adolescents. Moreover, it is difficult to find existing research on children and adolescents with disorders. Thus, this study intended to research the birth status of disabled children and adolescents (premature or otherwise), the difference in disease risk ratio due to the weight of a low birth weight infant, and the sorts of diseases such infants suffer.
2. THEORETICAL BACKGROUND
Table 1. Definitions of birth weight categories and preterm birth.16
Category Defenition
Normal Birth Weight > 2500 and < 4000g Low Birth Weight < 2500g
Very Low Birth Weight < 1500g
7388 Italy, on April 2, 2016, including eminent internationally recognized experts in the field of obstetrics, neonatology, and nephrology.
All nephron-counting studies have been performed on autopsy samples. From 7 studies with nearly 500 subjects, we know that the average nephron number
is ∼ 1,000,000 per kidney.17 Human nephron
number is highly variable, however, ranging from
210,000 to1 2.7 million.17 This 13-fold variability
likely contributes to individual susceptibility to
hypertension and kidney disease.18 Significant
variability is already present at birth, highlighting the importance of early nephrogenesis. Nearly 60% of nephrons are developed in the third trimester of
pregnancy. 19 In preterm infants, nephrogenesis may
occur for up to 40 days after birth, but may be
abnormal 19-20 Nephron numbers have been found to
be reduced in infants who were born preterm or of
LBW.19 Importantly, however, it has been observed
in some animal models that low nephron numbers may also occur with normal birth weight, so the burden or risk of renal programming may be underestimated if birth weight is the only surrogate
marker considered.21
The goal of the workshop through multidisciplinary engagement was to highlight the association between fetal and childhood development and an increased risk of adult diseases, focusing on hypertension, and to suggest possible practical solutions for the future. Low birth weight (LBW), growth restriction, and preterm birth are the most consistent clinical surrogates for low nephron numbers and are associated with an increased risk of hypertension, proteinuria, and kidney disease later in life. This relationship is amplified by the development of acute kidney injury (AKI) in preterm infants, which may further reduce nephron numbers soon after birth, as well as by rapid catch-up growth or overfeeding during infancy or childhood in children born small, which may further augment the risk of hypertension and predispose to obesity and type 2 diabetes later in life. Many questions about the developmental origins of chronic renal disease, possible nutritional and pharmacologic interventions, as well as strategies for optimal follow-up and management of vascular, metabolic, and renal functions remain
unanswered. 22.
The first observations that adults who were born with LBW (defined as a birth weight <2.5 kg) were at a higher risk of premature cardiovascular death,
increasingly compelling epidemiologic and
experimental evidence has highlighted the
“programming” impact of intrauterine and early childhood stresses on organ development and
long-term organ functions. 8,23 LBW, growth restriction,
and preterm birth (defined in Table 1) have been the most accessible surrogate markers for intrauterine stress so far. Although programming associations between LBW, growth restriction, preterm birth, and hypertension have been studied the most, evidence pointing to associations between LBW and CKD, CVD, obesity, glucose intolerance, type 2 diabetes, and preeclampsia is also quite con
vincing..8,23,24 Until recently, research has largely
focused on LBW and preterm birth as markers for developmental programming of hypertension and
renal disease.16 Building on early epidemiologic
evidence linking LBW and adult CVD, Brenner et
al 25 hypothesized that developmental programming
in the kidney may result in a reduction in nephron number, which in turn may be a factor contributing to higher blood pressure and increased risk of chronic kidney disease(CKD). The authors hypothesized that a reduction in whole kidney glomerular surface area resulting from a programmed reduction in nephron number would enhance susceptibility to hypertension by limiting sodium (salt) excretory capacity and increase susceptibility to CKD through a reduced capacity to compensate for renal injury. Consistent with this
possibility, LBW, hypertension, and CKD.26 In
animal studies early on, feeding pregnant rats a low protein diet induced LBW in the offspring, which subsequently developed spontaneous hypertension that increased with age, chronic renal injury, and
premature death.27 The rat offspring also had
smaller kidneys and reduced nephron numbers, which strongly supports the nephron number
hypothesis. Although the magnitude of
programming effects observed often differs
between males and females28 and between
experimental conditions, many diverse animal studies also strongly support the association between adverse intrauterine conditions and a higher risk of hypertension and renal dysfunction
with age, as reviewed elsewhere.29 It is important
7389 LBW and preterm birth are both associated with an increased risk of elevated blood pressure in later life. Meta-analyses have shown that systolic blood pressure levels were higher in preterm or VLBW adolescents than in controls born at term (mean increase of 2.5 mm Hg; 95% confidence interval, CI, 1.7–3.3 mm Hg from 10 studies) and in subjects with birth weights <2.5 kg compared with ≥2.5 kg (mean increase 2.28 mm Hg; 95% CI, 1.24–3.33 from 9 studies). In the latter study, the odds ratio (OR) of overt hypertension was 1.21 (95% CI, 1.13–1.3) for those with birth weights <2.5 kg
compared with ≥ 2.5 kg. 24 A systematic review of
the impact of HBW on blood pressure, however,
also found a risk ratio of 1.18 (95% CI, 1.05–1.32 from 6 studies) for hypertension in children who had birth weights ≥ 4 kg compared with birth weights<4 kg, but this effect did not persist in
adults. 30 In a further meta-analysis of 13 studies
including 1,115 children aged 2–20 years exposed to diabetes during gestation, systolic blood pressure levels were found to be higher compared to controls (mean difference 1.88 mm Hg;95% CI, 0.47–3.28); however, this effect appeared to predominate in
males. 31 Similarly, a systematic review found that
systolic blood pressure levels were 2.39 mm Hg (95% CI, 1.74–3.05 from 18 studies) higher among young adults who had been exposed to
[image:4.612.315.527.363.554.2]preeclampsia. 32
Fig 1. Number of infants born small with low birth weight, and premature birth in low and middle in come
countries. 33
Worldwide, the incidence rates of LBW and preterm birth lie at around 15–20% and 11%,
respectively.34 Research has largely focused on
LBW and preterm birth as markers for developmental programming of hypertension and renal disease. .16 It is important to recognize that
many babies who are born yearly with birth weights above 2.5 kg (technically not LBW) still experienced intrauterine growth restriction (IUGR) and may be inappropriately small for gestational age (SGA)( Fig. 1 ).
In addition, preterm infants may also have either an appropriate, although low, birth weight for gestational age (AGA) or may be SGA if they experienced superimposed growth restriction ( Fig. 1 ).
Worldwide, the incidence rates of LBW and preterm birth lie at around 15–20% and 11%, respectively[33, 34] . There is, however, significant overlap between LBW, preterm birth, and SGA, with the total reaching around 36% of live births in
LMIC in 2010 .33.
Fig. 2. Prevalence of SGA, preterm birth, and LBW infants by United Nations Millennium Development Goal
regions in 2010 (reprinted with permission according to CC Creative Commons
Attribution-NonCommercialnoDerivs from Lee et al33
3. METHODOLOGY
3.1 Sampling and Data Collection
[image:4.612.99.319.429.690.2]7390 school parents. Mental retardation school 6 schools in Seoul, 1 in Daegu, 1 in Jeollabuk-do, 1 in Gyeongsangbuk-do, 1 in Gyeongsangnam-do and 1 in Seoul The questionnaire was distributed to 2,163 elementary and high school students among the
nationwide handicapped children with
disabilities,The study conducted a self-administered
survey, in which the survey subject responded as frankly as they could remember, targeting 949 school parents who agreed to participate. The tool used for this research was a structured questionnaire including a total of 19 questions comprising 16 questions about general characteristics, two questions about premature birth status, and one question about disease status, type of diseases, and so on.
3.2 Research tools and content
The tools of this study were structured questionnaires consisting of a total of 19 questions, including on general characteristics, 16 paragraph, 2 on premature birth, and 1 on disease condition and disease type. To determine whether their child is an independent variable at birth or a premature infant at birth, parents were asked to respond by selecting ○ or X and indicating when the child was and what was the weight at birth. For tThe dependent variable, the instruction was to select ○ or X to respond to the disease and the disease name of the disease.
.3.3 Analysis and Method
To process and analyze the collected data, this study used SAS Ver. 9.4 for Windows. Descriptive statistics were conducted with respect to research subjects’ general characteristics, and an -test and one-way ANOVA were conducted with respect to the variance of variables based on general characteristics. Additionally, the study conducted frequency analysis of the name of each disease and the number of subjects suffering from the disease. Overall disease risk rate due to birth weight was analyzed using multi-level logistic regression.
4. RESULTS
4.1 Correlation between Disabled Children’s and Adolescents’ Sociodemographic Variables and Present Disease Status
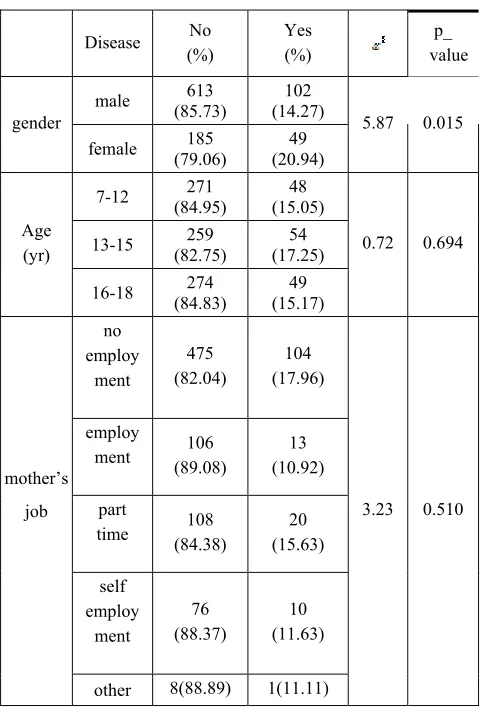
[image:5.612.306.548.296.652.2]Sociodemographic variables and present disease status by gender, female students were found to have a higher ratio of subjects with a disease than male students. This was statistically significant with a p-value of .015. In age, there were 48 elementary school students (15.05%), 54 middle school students (17.25%), and 49 high school students (15.17%), and middle school students’ prevalence was found to be highest, though this finding was not statistically significant. According to the current mother's job, the distribution of diseases among her children was also different. The highest rate for full-time housewives was 104 (17.96 %), while the lowest rate for regular working mothers was 13 (10.92 %).
Table 2. Correlation between Sociodemographic Factor and the Present Disease Status
* Only disease status is classified by target (patient to be chopped only)
In terms of disease status by type of disability, the rate of disability was 11 (20.75 %) for children
Disease No (%)
Yes (%)
p_ value
gender
male (85.73) 613 (14.27) 102
5.87 0.015 female (79.06) 185 (20.94) 49
Age (yr)
7-12 (84.95) 271 (15.05) 48
0.72 0.694 13-15 (82.75) 259 (17.25) 54
16-18 (84.83) 274 (15.17) 49
mother’s job
no employ
ment
475 (82.04)
104 (17.96)
3.23 0.510 employ
ment (89.08) 106 (10.92) 13
part
time (84.38) 108 (15.63) 20
self employ
ment
76 (88.37)
10 (11.63)
7391 with disabilities and teens with the highest rates of disease because they examined only physical diseases. The physical disease rate of children with both intellectual and delayed disabilities was 24 (20.34 %) among the target audience, similar to those with physical disabilities. P-value was not statistically significant, at 0.182.
Table 3. Comparison of disease status by disability
No disease (%)
disease
(%) p_value
Intellectual
disability (85.20) 668 (14.80) 116
3.39 0.182 Intellectual,
delayed disability
94 (79.66)
24 (20.34)
Delayed
disability (79.25) 42 (20.75) 11
* Only disease status is classified by target (patient to be chopped only)
4.2 Disease Risk in Childhood and Adolescence by Disabled Children’s and Adolescents’ Birth Weight
[image:6.612.316.524.323.439.2]As shown in Table 3, this study compared disease status during childhood and adolescence with birth weight in the case of children and adolescents with disabilities. For low birth weight infants under 2,500g, 39 persons (17.26%) were found to have a ratio of a disease, and this figure was statistically significantly higher (p = .006) than that of the 102 persons (14.89%) having prevalence among subjects whose birth weight was over 2,500g.
Table 4. Disease Risk of Children and Adolescents with Disabilities by Birth Weight
birth weight no disease (%)
disease
(%) p_value
Normal Birthweight
Infant
583(85.11) 102(14.89)
7.55 0.006 Low
Birthweight Infant(<2.5kg)
187(82.74) 39(17.26)
* Only disease status is classified by target (patient to be
chopped only)
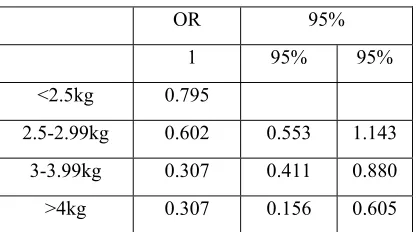
In examining the disease risk ratio in childhood and adolescence with respect to birth weight, the disease risk ratio for the 2,500-3000g birth weight group was 0.795 (0.553-1.143) times lower; the disease risk ratio for the normal birth weight group of 3000-4000g was 0.602 (0.411-0.880), and the disease risk ratio for the over-4000g group was 0.307 (0.156~0.605). Thus, it was found that the disease risk ratio was highest at the low birth weight level, and as birth weight increased, the risk ratio of suffering various diseases tended to gradually decrease. The group with the heaviest birth weight showed the lowest disease risk ratio, and results were statistically significant (Table 4).
Table 5. Comparison between Birth Weight and Disease Risk Ration
* Classification of only Disease Status by Subject (even for patients with multiple diseases, only disease existence/non-existence is marked)
4.3 Current Diseases in Children or Adolescents with Disabilities Born as Low or Normal Birth Weight Infants
The prevalence rates of 49 diseases were examined in children or adolescents with disabilities. Heart disease showed the largest difference between normal and low birth weight infants. Among children or adolescents suffering from heart disease, 11 subjects (62.5%) were low birth weight infants and six subjects (37.5%) were normal birth weight infants. This was the largest difference in prevalence rate. Prader-Willi syndrome showed the second largest difference. Seven subjects (66.7%) were low birth weight infants and three (33.3 %) were normal birth weight infants.
Table 6. Current Diseases in Children or Adolescents with Disabilities and Low Birth Weight Infants (Under 2,5kg)
OR 95%
1 95% 95%
<2.5kg 0.795
2.5-2.99kg 0.602 0.553 1.143
3-3.99kg 0.307 0.411 0.880
[image:6.612.90.299.604.708.2]7392 diseases/
low birth weight
<2.5kg (N=226)
yes(%)
Normal (N=685) no(%)
Total (N=911)
Epilepsy 9(3.98%) 27(3.94%) 36(7.92 %) Angelman syndrome 1(0.44%) 0(0%) 1(0.44%) Scoliosis 4(1.76%) 4(0.58%) 8(2.34%) Short stature 1(0.44%) 0(0%) 1(0.44%) Hemiplegia 0(0%) 1(0.14%) 1(0.14%)
Convulsion 13(17.70%) 26(3.80%) 39(21.5 %) Brain disease 2(0.88%) 4(0.56%) 6(1.44%) Rhinitis 1(0.44%) 3(0.42%) 4(0.86%) Renal disease 3(1.32%) 4(0.56%) 6(1.88%)
Heart disease 11(4.87%) 6(0.84%) 17(5.71 %) Diabetes mellitus 2(0.88%) 2(0.28%) 4(1.16%) Thyroid disease 1(0.44%) 3(0.42%) 4(0.86%) Pulmonary disease 2(0.88%) 0(0%) 2(0.88%) Asthma 0(0%) 2(0.28%) 2(0.28%) Allergy 0(0%) 2(0.28%) 2(0.28%) Tuberous sclerosis 1(0.44%) 1(0.14%) 2(0.58%) Cleft lip and cleft
palate 1(0.44%) 1(0.14%) 2(0.58%) Hemophilia 0(0%) 1(0.14%) 1(0.14%)
Large organ surgery 1(0.44%) 0(0%) 1(0.44%) Liver disease 1(0.44%) 0(0%) 1(0.44%) Visual disturbance 2(0.88%) 1(0.14%) 3(1.02%)
Hearing impairment 1(0.44%) 0(0%) 1(0.44%) Moyamoya 0(0%) 2(0.28%) 2(0.28%) Osteoporosis 1(0.44%) 0(0%) 1(0.44%) Strabismus 0(0%) 2(0.28%) 2(0.28%) Foot disease 0(0%) 2(0.28%) 2(0.28%) Cataract 1(0.44%) 0(0%) 1(0.44%) Otitis media 1(0.44%) 1(0.14%) 2(0.58%) Pulmonary
hypertension 1(0.44%) 0(0%) 1(0.44%) Tic 0(0%) 1(0.14%) 1(0.14%) ADHD 0(0%) 1(0.14%) 1(0.14%) Bronchiectasis 0(0%) 1(0.14%) 1(0.14%) Developmental
disability 0(0%) 1(0.14%) 1(0.14%) Essential tremor 1(0.44%) 0(0%) 1(0.44%) Congenital missing
teeth 0(0%) 1(0.14%) 1(0.14%)
Lymphedema 1(0.44%) 1(0.14%) 2(0.14%) Gluten intolerance 1(0.44%) 0(0%) 1(0.44%) Rett syndrome 1(0.44%) 0(0%) 1(0.44%)
Rheumatoid arthritis 0(0%) 1(0.14%) 1(0.14%) Knee joint disorder 0(0%) 1(0.14%) 1(0.14%)
Williams syndrome 0(0%) 1(0.14%) 1(0.14%) Phenylketonuria 1(0.44%) 0(0%) 1(0.44%) Prader-Willi
syndrome 7(3.1%) 3(0.42%) 9(3.52%) Total 73(32.3%) 107(15.62)180(47.95%)
* Indicate all duplicate diseases of the same person (a condition diagnosed by the doctor and currently under treatment)
5. DISCUSSION
In this study, we investigated and analyzed the risks of disease in children and adolescents with a focus on low birth weight infants weighing less than 2,500g at birth. With decreasing birth weight, children and adolescents were more easily exposed to various diseases, and birth weight was highly correlated with the prevalence rates of diseases in children and adolescents. Among previous studies on preterm infants, those analyzing only preterm infants showed a relationship between the prenatal period and diseases. The same results were found in this study.35 The prevalence rates of diseases were
examined in preterm infants weighing less than 2,500g and in normal birth weight infants. The prevalence rates of heart diseases and other rare diseases4 were higher in the preterm infants than in
the normal birth weight infants. In other studies, the prevalence rates of epilepsy, convulsions, and brain diseases in adolescents born as preterm infants were found to be lower than those in adolescents born as normal birth weight infants. However, in a study on particular diseases, including epilepsy and convulsions, the prevalence rates in preterm infants were found to be much higher than those in normal birth weight infants.11
7393 limitation.
Our validation study showed high correlations between self-reported birth weight and birth registry data.
6. CONCLUSIONS
In this study, we investigated and analyzed the risks of disease in children and adolescents with a focus on low birth weight infants below 2,500g in information systems. With decreasing birth weight, children and adolescents were more easily exposed to various diseases, and birth weight was highly correlated with prevalence rates of diseases in children and adolescents. This study found that risk of disease decreases in children and adolescents with increasing birth weight. With increasing birth weight, the prevalence rates of various diseases were statistically significantly lower.
REFRENCES:
[1] E.S.Lee, Risk factors in infant and early childhood mortality : Korean 1996 birth cohort, Thesis of Yonsei University, Seoul, 2003
[2] S. Hirve and B. Ganatra, “A prospective cohort study on the survival experience of under five children in rural western India”. Indian Pediatrics. Vol. 34, No. 11, 1997, pp.995~1001
[3] LM.Alessandri, HM. Chambers, C. Garfield, S. Vukovich and AW. Read, “Cumulative mortality in children aged 1 to 6 years born in Western Australia from 1980-89”. Archives of Disease in Childhood. Vol. 80, No. 1, 1999, pp.15~20
[4] J.Y.Ko, Social maturity of the preschooler according to birth weight. Thesis of Yonsei University, Seoul, 2000
[5] MCBM, Lima, G.S. Oliveira, C.O. Lyra, A.G. Roncalli and M.A.F. Ferreir, “The spatial inequality of low birth weight in Brazil”. Cien Saude Colet. Vol.18, No.8, 2013, pp.2443~2452
[6] A.A. Silva, L.M. Silva and M.A. Barbieri, “The epidemiologic paradox of low birth weight in Brazil”. Rev Saude Publica. Vol. 44, No. 5, 2010, pp.767~842
[7] J.A. Carvalho and L.L. Rodriguez-Wong, “The changing age distribution of the Brazilian population in the first half of the 21st century”. Cad Saude Publica. Vol. 24, No. 3, 2008, pp.597~605
[8] Y.J. Han, “A Study on the Estimation of Low-birth weight. Korea”. Institute for Health and Social Affairs. 2007, pp.1115~1123
[9] K.J. Collard, “Is there a causal relationship between the receipt of blood transfusions and the development of chronic lung disease of prematurity?” Med Hypotheses. Vol. 66, No. 2, 2006, pp.355~419
[10] D.M. Axelrod, V.Y. Chock and V.M. “Reddy, Management of the Preterm Infant with Congenital Heart Disease”. Clin Perinatol. Vol. 43, No. 1, 2016 Mar, pp.157~228 [11] E. Sellier, P. Uldall, E. Calado, S.
Sigurdardottir, M.G. Torrioli, M.J. Platt and C. Cans, “Epilepsy and cerebral palsy: Characteristics and trends in children born in 1976-1998”. Eur J Paediatr Neurol. Vol. 16, No.1, 2012 Jan, pp.48~55
[12] Y.Y. Chen, H.P. Wang, S.M. Lin, J.T. Chang, K.S. Hsieh, F.K. Huang, Y.H. Chiou and Y.F. Huang, “Pulmonary hemorrhage in very low-birthweight infants: Risk factors and management”. Pediatr Int. Vol.54, No.6, 2012 Dec, pp.743~747
[13] C.Y. Spong, B.M. Mercer, M. D’Alton, S. Kilpatrick, S. Blackwell and G. Saade, “Timing of indicated late-preterm and early-term birth. Obstetric Gynecol. Vol.118, No.2, 2011, pp.323~356
[14] C.E. Mercier, M.S. Dunn, K.R. Ferrelli, D.B. Howard, R.F. Soll, “Neurodevelopmental outcome of extremely low birth weight infants from the Vermont Oxford network: 1998-2003”. Neonatology. Vol..97, No.4, 2010 Jun, pp.329~367
[15] B. Bogin, “Evolutionary perspective on human growth”. Annu Rev Anthropol . Vol. 28, 1999, pp.109~153
[16] Koyanagi A, Zhang J, Dagvadorj A, et al: Macrosomia in 23 developing countries: an analysis of a multicountry, facility-based, crosssectional survey. Lancet 2013; 381: 476– 483.
[17] Bertram JF, Douglas-Denton RN, Diouf B, et al: Human nephron number: implications for health and disease. Pediatr Nephrol 2011; 26:1529–1533.
[18] Keller G, Zimmer G, Mall G, et al: Nephron number in patients with primary hypertension. N Engl J Med 2003; 348: 101–108.
7394 Accelerated maturation and abnormal morphology in the preterm neonatal kidney. J Am Soc Nephrol 2011; 22: 1365–1374. [21] Gilbert JS, Lang AL, Grant AR, et al: Maternal
nutrient restriction in sheep: hypertension and decreased nephron number in offspring at 9 months of age. J Physiol 2005; 565: 137–147. [22] WHO: Global Action Plan for the Prevention
and Control of NCDs, 2013–2020. http://www. who.int/nmh/events/ncd_action_plan/en/. [23] McMillen IC, Robinson JS: Developmental
origins of the metabolic syndrome: prediction, plasticity, and programming. Physiol Rev 2005; 5: 571–633.
[24] Mu M, Wang SF, Sheng J, et al: Birth weight and subsequent blood pressure: a meta-analysis. Arch Cardiovasc Dis 2012; 105: 99– 113.
[25] Brenner BM, Garcia DL, Anderson S: Glomeruli and blood pressure. Less of one, more the other? Am J Hypertens 1988; 1: 335–347
[26] Garcia-Garcia G, Jha V: CKD in disadvantaged populations. Kidney Int 2015; 87: 251–
[27] Zeman FJ: Effects of maternal protein restriction on the kidney of the newborn young of rats. J Nutr 1968; 94: 111–116. [28] Cheong JN, Wlodek ME, Moritz KM, et al:
Programming of maternal and offspring disease: impact of growth restriction, fetal sex and transmission across generations. J Physiol 2016; 594: 4727–4740.
[29] Luyckx VA, Brenner BM: The clinical importance of nephron mass. J Am Soc Nephrol 2010; 21: 898–910.
[30] Zhang Y, Li H, Liu SJ, et al: The associations of high birth weight with blood pressure and hypertension in later life: a systematic review and meta-analysis. Hypertens Res 2013; 36: 725–735.
[31] Aceti A, Santhakumaran S, Logan KM, et al:The diabetic pregnancy and offspring blood pressure in childhood: a systematic review and meta-analysis. Diabetologia 2012; 55:3114–3127.
[32] Davis EF, Lazdam M, Lewandowski AJ, et al: Cardiovascular risk factors in children and young dults born to preeclamptic pregnancies: a ystematic review. Pediatrics 2012;129:e1552– 1561.
[33] Lee AC, Katz J, Blencowe H, et al: National and regional estimates of term and preterm babies born small for gestational age in 138 low-income and middle-income countries in
2010. Lancet Glob Health 2013; 1:e26–e36. [34] World Health Organization: WHA Global