Full Length Research Article
MODELING THE DISTRIBUTION AND INCIDENCE OF BACTERIAL WILT ON
TOMATOES USING BINARY LOGISTIC MODELS
1, *
Ogeya O. Fredrick,
1LosengeTuroop,
2OtienoWashington and
1KyaloMung'atu
1
Jomo Kenyatta University of Agriculture and Technology, P.O Box 62000-00200, Nairobi, Kenya
2Center for Agriculture and Bioscience International, P.O. Box 633-00621, Nairobi, Kenya
ARTICLE INFO ABSTRACT
Strategies of managing and controlling devastating bacterial wilt of tomato are investigated by fitting binary logistic models to data consisting of dummy response variable of its incidents on reported cases to the plant clinics. Binary logistic methods are used for fitting such models to data describing the distribution and incidents of bacterial wilt (BW) caused by Ralstonia solanacearum on tomato crop. The approach overcomes some of the difficulties encountered when fitting ordinary least square regression to a dummy response variable. The study used secondary data obtained from a sample of 1980 reported cases to the plant clinics. The clinic sites were purposively. The results of the analysis showed the BW incidents were high in Kirinyaga, Nakuru and Embu (20.6%, 20.2% and 19.1% respectively).Bacterial wilt distribution a cross counties were significant (χ2 = 202.079, p-value<0.001). Minimum relative humidity and minimum temperature were significantly influencing bacterial wilt incidents. However, agro-ecological zones and precipitation were not significant from the models. Binary logistic models estimated efficiently the incidents and distributions of BW using the backward iteration process and corresponding residual deviance and Akaike Information Criterion.
Copyright©2016, Ogeya Fredrick et al. This is an open access article distributed under the Creative Commons Attribution License, which permits unrestricted use, distribution, and reproduction in any medium, provided the original work is properly cited.
INTRODUCTION
Globally, the trends in food production has been on a decline due to the incidences of pests and diseases which are causing around 800 million people to lack enough food and at least 10% of food produced is lost to diseases (Strange and Scott, 2005). Incidence of pests and diseases have contributed significantly to the reduction in food production in most agricultural regions (Oerke, 2006) and diseases are major problems for small scale farmers in the production of tomatoes and other crops (Yadessa et al., 2010). Tomato is the second leading crop in terms of production and value after potato (Geoffrey et al., 2014). It is widely used as vegetable across the world (Wani, 2011). In Kenya, tomato is majorly grown in the open field, but use of greenhouses has been adopted in the recent past in most regions (Geoffrey et al., 2014). Though greenhouses are essential for continuous production of tomatoes even during the adverse weather conditions, they provide optimal condition for rapid multiplication of
*Corresponding author: Ogeya O. Fredrick,
Jomo Kenyatta University of Agriculture and Technology, P.O Box 62000-00200, Nairobi, Kenya.
pathogens (Buschermohle and Grandle, 2012). In most cases poor practices in the farm leads to increase in the incidence of pests and diseases in the farms (Abawi and Widmer, 2000). These diseases reduces yield and quality of tomatoes (Oerke, 2006). Among the diseases, bacterial wilt caused by
Ralstoniasolanacearumis a disease of economic importance in
tomato production(Lebeau et al., 2011) and a major constraint to tomato production ( Hayward, 1991). It affects all varieties of tomato (Afroz et al., 2009). The bacterium is soil borne that persists in contaminated soils and is a vector transmitted (Wani, 2011). It has a wide host’s range of over 50 plant species (Kelman, 1998). The pathogen is difficult to control and devastates farms leading to losses of more than 90% when it infests tomatoes (Kishun, 1985). Though it is persistent and resistant to most available control measures, its manifestation changes with varying conditions and management practices (Bart et al., 1996). The use of disease free seedling was reported to delay disease onset and subsequent severity (Miller and Crosier, 2015). According to Chen et al., (2009), inducing resistance through gene silencing was reported to control bacterial wilt in tomato. Nutritional soil amendment with silicon is also known to control bacterial wilt in tomato (Ayana
et al., 2011). Bacterial wilt caused by Ralstonia olanacearum
ISSN: 2230-9926
International Journal of Development Research
Vol. 06, Issue, 07, pp.8662-8666, July,2016
DEVELOPMENT RESEARCH
Article History: Received 14th April, 2016
Received in revised form 26th May, 2016
Accepted 15th June, 2016
Published online 31st July, 2016
could infect roots and stems of many plants which are considered as alternative hosts (Wenneker et al., 1999) resulting in continuous spread across the tomato growing regions. The interaction of various environmental factors such as weather (temperature and rainfall), soil type and tillage practices determine the infection, distribution and survival of the pathogen. To clearly be able understand the contributions and interactions of these factors the use of model became important. Currently, the field of plant pathology embraces the use of statistical models to estimate the relationship between disease components to a number of environmental farm practices and host factors (Contreras-Medina, 2009).Various models are applied in understanding disease dynamics in crops and predicting diseases progression, development, distribution and epidemics (Calonnec et al., 2009).
Linear models are used in studying the relationship between the dependent variable and independent variable(s) (Wagner, 2013). Due to binary response variable, it was extended to generalized linear model that is efficient for nonlinear covariates (Hastie and Tibshirani, 1990). Use of linear regression models in a dichotomous (binary) dependent variable violates linearity assumptions (Poole and O’Farrell, 1970). Therefore, logistic model became useful (Haberman and Sinharay, 2010). It is efficient and gives various ways of coefficient interpretation and parameter estimation which are more intuitive (Adel, 2015). It is also efficient in estimating probabilities, odds and odds ratios (Hosmer and Lemeshow, 1997). Various studies have been conducted in disease incidence and distribution of bacterial wilt on tomatoes. However, applications of binary logistic model to study the disease incidents are few or not available, presumably due to difficulties in obtaining adequate data (Mila et al, 2004). The spread and devastation of BW in tomato production has been a major concern. The study used secondary data from cases farmers reported to plant clinics. The study would help in understanding the regional disease distribution and incidents on cases reported. The objective of this study was to determine the disease distribution and crop loss associated with bacterial wilt in the selected counties in Kenya and to build a statistical model to predict the bacterial wilt incidents. To achieve this goal, binary logistic tool was applied and the best model estimate selected based on the Akiake Information Criterion and residual deviance.
MATERIALS AND METHODS
The study used secondary data from 57 plant clinics in 13 counties in Kenya viz. Nakuru, Trans-Nzoia, Embu, Machakos, Nyeri, Kirinyaga, Kajiado, Kiambu, Bungoma, Marakwet, Narok, Tharakanithi and west Pokot County. These counties were not delimited according to weather patterns. Agro-ecological zones (AEZ) were therefore, used in considering weather aspects. Some AEZ overlap across counties and variations in the AEZs led to heterogeneity of environmental factors and farming activities. Purposive sampling technique was used to select clinics site, this was based on general plant health problems that farmers experience in counties. Within the counties, sites for clinic location were randomly selected. The response variable used was presence of bacterial wilt. The explanatory variables in the model were weather data, (minimum daily temperature, maximum daily
temperature, minimum relative humidity, maximum relative humidity and precipitation), development stage of crops and AEZ.
Independent variables
Daily temperature, precipitation and relative humidity were obtained from awhere climate data service provider(awhere Services, n.d.). The data output was based on the raster grid which are approximated to cell resolution of 9 by 9 km.According to Deberdt and Prior, (1999), humidity was important in modeling bacterial wilt distribution and incidents. Different agro-ecological zones (AEZ) were obtained from the Geographic Information System (GIS). The raster data enriched by climatic information from Kenya GIS was overplayed onselected regions to obtain the zones. Data processing was performed using box plots and Cronbach's alpha to check for anomalies and outliers then analyzed using R Statistical Programming Packages (version 2.15.3). Both descriptive and inferential statistics were used.The Akaike Information Criterion (AIC) and deviance values were used in selecting the best model.
Logistic regression model
The study used binary logistic regression model with a dummy variable response outcome (for either disease presence =1 or disease absence = 0) to investigate the distribution of bacterial wilt and other factors that influences it such as farming practices, AEZ, type of crop and weather. The binary logistic model for the disease presence in the ith field was analyzed using generalized linear models (Cook and Dixon, 2001).
Y= η + ξ = Χ' + e, (1)
Where ξ is a random component, η is linear relationship between the dependent variable and its predictors.The parameter η can be expressed using a log link function. It captures the form of relationship between the dependent variable and predictor expected value. Log link (µ)= exp (η) or η= log (µ), therefore, the impacts of predictor variables are multiplicative for k parameters. That is i = 1,2,3,…, k
Y= exp(b0)*exp(b1X1)*exp(b2X2)*… *exp(bkXk)
Where Y denotes the dependent variable, incidents of bacterial wilt in tomato on reported cases. Sample of 1980 cases of infested tomatoes were reported to the plant clinic between the year 2012 to 2013. Diseases incidents on the reported cases was dummy and coded 1 and 0 (presence or absence of disease respectively), the probability of disease incidents was modeled as follows: ) ( 1 ) ( ) | 1 ( 1 0 1 0 ij j j ij j j X Exp X Exp ij Xij Yij P ) ( 1 ) ( ) | ( Exp Exp ij Xij Yij P (1)
RESULTS
The reported cases to the plant clinics indicated that bacterial wilt incidents were observed in the twelve counties. However, in Elgeyo Marakwet, farmers did not report any case to the clinic. This maybepresumably due to other factors such as good farming practices or limited access to plant clinics. Bacterial wilt distribution a cross counties were significant (χ2 = 202.079, p<0.001). It was observed that Kirinyaga had the highest incidents of reported cases of the diseasefollowed by Nakuru and Embu (with mean percent 20.6%, 20.2% and 19.1% respectively). In Narok, West Pokot, Tharaka-Nithi, Kajiado and Kiambu counties, the cases of BW reported was 0.4%, 2.2%, 2.2%, 2.2% and 2.6% respectively (Fig. 1).
Binary logistic model results for the reported cases of bacterial wilt (BW)
Model 1
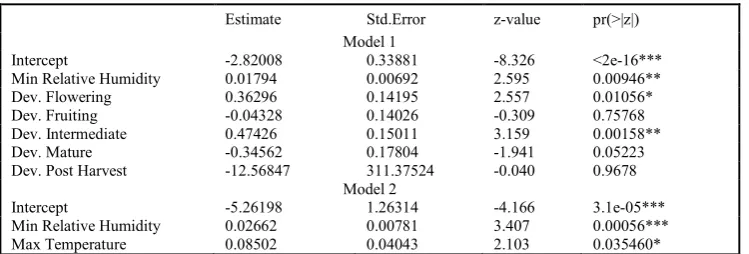
The full model was fitted using the weather variables viz temperatures and development stage of tomato. It was found average incidents of BW by 2.821. Minimum relative humidity was significant in disease incidents (z-value= 2.595 and p=0.00946) and a coefficient estimate of 0.0179. The development stages; flowering, intermediate and maturity were significantly influencing bacterial wilt incidents (Table 1). These development stages were presumably critical to farmers to pay maximum attention to the crop in the farm.In Model 2, bacterial wilt incident was modeled using only weather variables viz daily minimum temperature, maximum temperature, precipitation, minimum relative humidity and
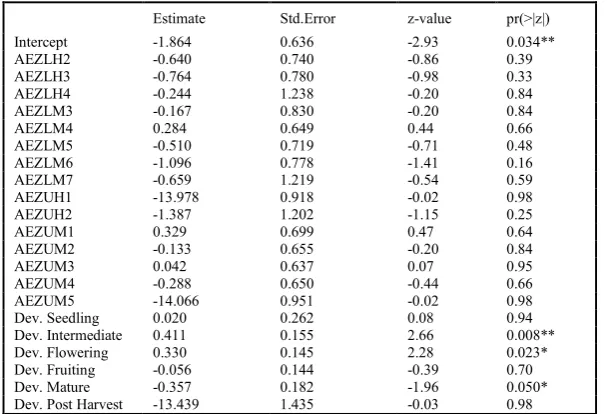
maximum relative humidity. Minimum relative humidity and maximum temperature were significantly influencing bacterial wilt incidents (Table 1). In this model, the overall disease incidents reduced by a magnitude of 5.261. Humidity had z-value= 0.0266 and p= 0.0006 while the maximum temperature coefficient of estimate was 0.085 and significantly influenced disease incidents (z-value = 2.103 and p= 0.0354) as shown in table 1. Agro-ecological zones (AEZ) were important in determining the bacterial wilt incidents. AEZ were classified into small zones upper midland, lower midland, upper highland and lower highland. It was found that AEZ was not significantly influencing BW distribution. This suggested that in the selected regions, bacterial wilt infestations might be affected by other factors (Table 2).
DISCUSSION
[image:3.595.155.444.232.375.2] [image:3.595.112.487.429.556.2]Bacterial wilt infests farms due to poor farming practices and environmental factors. A according to Mila et al., (2004) logistic model estimated efficiently disease distribution. Geographical regions and weather variables was important in modeling disease distribution. In model 1, it was found that farmers pay much attention to diseases in their crops at intermediate, seedling, flowering and maturity stage. Famers transplanting the seedlings in an infested farm due to poor farming practices would influence disease infestation at intermediate stage. Minimum relative humidity was significantly influencing bacterial wilt incidents (z=2.595, p=0.00946). However, minimum temperature, maximum temperature, rainfall and maximum relative humidity were not Figure 1. Reported cases of bacterial wilt on tomato crop at the plant clinics in thirteen counties
Table 1. Parameter estimates of the logistic regression model used to explain the incidence of bacterial wilt using weather parameters and development stage of tomato for model 1 and 2 using backward process method
Estimate Std.Error z-value pr(>|z|)
Model 1
Intercept -2.82008 0.33881 -8.326 <2e-16***
Min Relative Humidity 0.01794 0.00692 2.595 0.00946**
Dev. Flowering 0.36296 0.14195 2.557 0.01056*
Dev. Fruiting -0.04328 0.14026 -0.309 0.75768
Dev. Intermediate 0.47426 0.15011 3.159 0.00158**
Dev. Mature -0.34562 0.17804 -1.941 0.05223
Dev. Post Harvest -12.56847 311.37524 -0.040 0.9678 Model 2
Intercept -5.26198 1.26314 -4.166 3.1e-05***
Min Relative Humidity 0.02662 0.00781 3.407 0.00056***
Max Temperature 0.08502 0.04043 2.103 0.035460*
aSignificant codes: 0'***', 0.001'**', 0.01'*', 0.05'.', 0.1' ', 1
bMin Relative Humidity= Minimum Relative Humidity, Max Temperature= Maximum Temperature, Dev= Development stages of plant
significant on bacterial wilt (BW) incidence as reported to the plant clinic. From model 1, the residual deviance of 1532 and AIC 1546 was achieved from the adjusted model. This was an indication that based on full model, reduced model was efficient in estimating disease incidents. Refitted model showed that more of the reported cases on BW were observed at flowering, intermediate, and maturity stage of the tomato. It was presumable that during these stages of development farmers pay much attention on tomatoes. Temperature and precipitation was not significant. This would have been attributed by the fact that small scale farmers only plant during rainy season and solely depends on rainfall. Therefore, during dry season tomatoes are not in the field. Daily temperature and precipitation influences the distribution of bacterial wilt as it leads to its spread due to the runoff from the affected farms. According to Mila et al. (2004), temperature and precipitation increased the risk in BW incidence due to its tolerate up to a temperature of 32 C. Mew et al. (1977), also observed that bacterial wilt can survive under varied range 26 C to 32 C temperature that a crop may scorch out while BW still survive.
Model 2
In model 2, maximum and minimum temperature had a positive coefficient of estimate; none of the parameters measured was significantly influencing BW incidents on tomato. This would have been attributed by other factors such as good farming practices and type of irrigation method used by farmers. According to Mila et al. (2004),it was found that temperature and precipitation were important factors to consider when investigating bacterial wilt incidence as it requires optimal condition to survive. Considering the weather variables, the intercept was-5.844 (Table 4). The refitted model 2 was selected by comparing the AIC in the iterated models. Maximum temperature and minimum relative humidity in the refitted model 2 had an intercept of -5.262, an indication of reduction of bacterial wilt incidents (Table 2). Monthly maximum temperature was between 24 0C to 28 0C from January to December. The temperature achieved throughout the year was advantageous for the survival of
Ralstonia solanacearum as it can survive for long and in
varied temperature over 210C. Persley., (1986), found that R.
solanacearum can survive in the soil for long time and within
the range of 28 0C to 32 0C.
Model 3
The small-AEZ were not significant to the bacterial wilt incidents (Table 2). It is attributed to farm practices farmers adopted. According to Michel et al. (1997), various farm practices such as intercropping and soil amendment significantly reduces the population of BW of tomato. Although AEZ did not affect bacterial wilt incidents significantly, the coefficients of estimates were negative indicating a reduction on reported cases. A study in Nigeria, agro-ecological effect on bacterial wilt showed significant difference on its infestation under different environmental conditions (Ngeve and Nukenine, 2002). Therefore, studying disease distribution is essential in making decision for effective farming. Application of binary logistic model is efficient in modeling dummy response variables
Acknowledgement
I profoundly acknowledge all who have been very influential in my studies especially Jomo Kenyatta University of Agriculture and technology for coordination of the research and guidance support, Center for Agricultural Bioscience International for offering me opportunity to do research in their organization and Eastern Africa Agricultural Productivity Project for sponsoring my studies.
REFERENCES
Abawi, G. and Widmer, T. 2000. Impact of soil health management practices on soilborne pathogens, nematodes and root diseases of vegetable crops. Applied Soil Ecology, 15(1), 37–47. doi:10.1016/S0929-1393(00)00070-6 Afroz, A., Khan, M. R., Ahsan, N., and Komatsu, S. 2009.
[image:4.595.151.455.76.283.2]Comparative proteomic analysis of bacterial wilt Table 2. Parameter estimates of the logistic regression model used to explain the incidence of bacterial wilt in
relation to agro-ecological zones and development stage of tomato (model 3)
Estimate Std.Error z-value pr(>|z|)
Intercept -1.864 0.636 -2.93 0.034**
AEZLH2 -0.640 0.740 -0.86 0.39
AEZLH3 -0.764 0.780 -0.98 0.33
AEZLH4 -0.244 1.238 -0.20 0.84
AEZLM3 -0.167 0.830 -0.20 0.84
AEZLM4 0.284 0.649 0.44 0.66
AEZLM5 -0.510 0.719 -0.71 0.48
AEZLM6 -1.096 0.778 -1.41 0.16
AEZLM7 -0.659 1.219 -0.54 0.59
AEZUH1 -13.978 0.918 -0.02 0.98
AEZUH2 -1.387 1.202 -1.15 0.25
AEZUM1 0.329 0.699 0.47 0.64
AEZUM2 -0.133 0.655 -0.20 0.84
AEZUM3 0.042 0.637 0.07 0.95
AEZUM4 -0.288 0.650 -0.44 0.66
AEZUM5 -14.066 0.951 -0.02 0.98
Dev. Seedling 0.020 0.262 0.08 0.94
Dev. Intermediate 0.411 0.155 2.66 0.008**
Dev. Flowering 0.330 0.145 2.28 0.023*
Dev. Fruiting -0.056 0.144 -0.39 0.70
Dev. Mature -0.357 0.182 -1.96 0.050*
Dev. Post Harvest -13.439 1.435 -0.03 0.98
aSignificant codes: 0'***', 0.001'**', 0.01'*', 0.05'.', 0.1' ', 1
bAEZ= Agro-ecological zone, LH= Lower highland, LM= Lower midland,UH= Upper highland, UM= Upper midland, Dev=
susceptible and resistant tomato cultivars. Peptides, 30, 1600–1607. doi:10.1016/j.peptides.2009.06.005
Ayana, G., Fininsa, C., Ahmed, S., and Wydra, K. 2011. Effects of Soil Amendment on Bacterial Wilt Caused By Ralstonia Solanacerum and Tomato Yields in Ethiopia, 51(1. doi:10.2478/v10045-011-0013-0
Babtain, A. A. n.d.. Using Binary Logistic Regression n.d Probit Analysis to students ’ characteristics with the identification results of mental ability test : A Comparative Study, 1–13.
Buschermohle, M. J., and Grandle, G. F. 2012. W017-Controlling the Environment in Greenhouses Used for Tomato Production. The University of Tennessee Agricultural Extension Service.
Calonnec, Cartolaro, P., and Chadoeuf, J. 2009. Highlighting features of spatiotemporal spread of powdery mildew epidemics in the vineyard using statistical modeling on field experimental data. Phytopathology, 99(4), 411–422. doi:10.1094/PHYTO-99-4-0411
Chen, Y. Y., Lin, Y. M., Chao, T. C., Wang, J. F., Liu, A. C., Ho, F. I., and Cheng, C. P. 2009. Virus-induced gene silencing reveals the involvement of ethylene-, salicylic acid- and mitogen-activated protein kinase-related defense pathways in the resistance of tomato to bacterial wilt. Physiologia Plantarum, 136, 324–335. doi:10.1111/j.1399-3054.2009.01226.x
Contreras-Medina, L. 2009. Mathematical modeling tendencies in plant pathology. African Journal of …, 8(25),
7399–7408. Retrieved from
http://www.ajol.info/index.php/ajb/article/view/77754 Czepiel, S. A. 2002. Maximum likelihood estimation of
logistic regression models: theory and implementation. Available at Czep. Net/stat/mlelr. Pdf. Retrieved from http://www.czep.net/stat/mlelr.pdf
Deberdt, P., Quénéhervé, P., Darrasse, a., and Prior, P. 1999. Increased susceptibility to bacterial wilt in tomatoes by nematode galling and the role of the Mi gene in resistance to nematodes and bacterial wilt. Plant Pathology, 48, 408– 414. doi:10.1046/j.1365-3059.1999.00346.x
Geoffrey, S. K., Hillary, N. K., Antony, K. M., Mariam, M., and Mary, M. C. 2014. Challenges and Strategies to Improve Tomato Competitiveness along the Tomato Value Chain in Kenya. International Journal of Business and Management, 9(9), 205–212. doi:10.5539/ijbm.v9n9p205 Haberman, S. J., and Sinharay, S. 2010. The Application of the
Cumulative Logistic Regression Model to Automated Essay Scoring. Journal of Educational and Behavioral Statistics, 35(5), 586–602. doi:10.3102/1076998610375839 Hastie, T. J., and Tibshirani, R. 1990. Generalized additive models. Statistical Science. doi:10.1016/j.csda.2010.05.004 Hayward, A. C. 1991. Bacterial Wilt Caused By. In Annu.
Rev. PhYlOpathol. pp. 65–87).
Hosmer, D. W., Hosmer, T., Le Cessie, S., and Lemeshow, S. 1997. A comparison of goodness-of-fit tests for the logistic regression model. Statistics in Medicine, 16(May 1995),
965–980.
doi:10.1002/(SICI)1097-0258(19970515)16:9<965::AID-SIM509>3.0.CO;2-O Koehler K., Meeker, S. and C. 2001. Binary Response and
Logistic Regression Analysis.
Lebeau, a, Daunay, M.-C., Frary, a, Palloix, a, Wang, J.-F., Dintinger, J., … Prior, P. 2011. Bacterial wilt resistance in tomato, pepper, and eggplant: genetic resources respond to
diverse strains in the Ralstonia solanacearum species complex. Phytopathology, 101(January), 154–165. doi:10.1094/PHYTO-02-10-0048
Mew, T. W. 1977. Effect of Soil Temperature on Resistance of Tomato Cultivars to Bacterial Wilt. Phytopathology, 77, 909. doi:10.1094/Phyto-67-909
Michel, V., Wang, J. F., Midmore, D., and Hartman, G. 1997. Effects of intercropping and soil amendment with urea and calcium oxide on the incidence of bacterial wilt of tomato and survival of soil-borne Pseudomonas solanacearum in Taiwan. Plant Pathology, 46, 600–610. Retrieved from
http://onlinelibrary.wiley.com/doi/10.1046/j.1365-3059.1997.d01-45.x/full
Mila, a L., Carriquiry, a L., and Yang, X. B. 2004. Logistic regression modeling of prevalence of soybean sclerotinia stem rot in the north-central region of the United States.
Phytopathology, 94, 102–110.
doi:10.1094/PHYTO.2004.94.1.102
Miller, A. J. H., and Crosier, W. F. 2015. Association of Official Seed Analysts Society of Commercial Seed Technologists Pathogenic Associates of Tomato Seed : Their Prevalence , Relation too field disease and elimination.
Ngeve, J. M., and Nukenine, E. N. 2002. Genotype × environment effects on severity of cassava bacterial blight disease caused by, 763–770.
Oerke, E.-C. 2006. Crop losses to pests. The Journal of Agricultural Science, 144(01), 31–43. Retrieved from href="http://dx.doi.org/10.1017/S0021859605005708 Persley G. J, Batugal P., G. D. 1986. Bacterial Wilt Disease in
Asia and the South Pacific. Australian Centre for International Agricultural Research CI.P.O. Box 1571, Canberra, A.C.T. 2601, (13), 126–143.
Poole, M. a, and O’Farrell, P. N. 1970. The assumptions of the linear regression model. Transactions of the Institute of British Geographers, 52, 145–158.
Prior, P., Bart, S., Leclercq, S., Darrasse, a, and Anais, G. 1996. Resistance to bacterial wilt in tomato as discerned by spread of Pseudomonas (Burholderia) solanacearum in the stem tissues. Plant Pathology, 45, 720–726. doi:10.1046/j.1365-3059.1996.d01-9.x
Strange, R. N., and Scott, P. R. 2005. Plant disease: a threat to global food security. Annual Review of Phytopathology,
43(Figure 1), 83–116.
doi:10.1146/annurev.phyto.43.113004.133839
Wagner, H. H. 2013. Rethinking the linear regression model for spatial ecological data. Ecology, 94(11), 2381–2391. Wani, A. H. 2011. An overview of the fungal rot of tomato, 9,
33–38.
Wenneker, M., Verdel, M. S. W., Groeneveld, R. M. W., Kempenaar, C., Van Beuningen, a. R., and Janse, J. D. 1999. Ralstonia (Pseudomonas) solanacearum race 3 (biovar 2) in surface water and natural weed hosts: First report on stinging nettle (Urtica dioica. European Journal of Plant Pathology, 105(biovar 2), 307–315. doi:10.1023/A:1008795417575
Yadessa, G. B., van Bruggen, a. H. C., and Ocho, F. L. 2010. Effects of different soil Amendments on bacterial wilt caused by ralstonia solanacearum and on the yield of tomato. Journal of Plant Pathology, 92(2), 439–450.