ISSN Online: 2156-8561 ISSN Print: 2156-8553
Interactive Effect of Different Nitrogen and
Potash Levels on the Incidence of Bacterial Leaf
Blight of Rice (
Oryza sativa
L.)
Nazer Manzoor, Nadeem Akbar*, Shakeel Ahmad Anjum, Iftikhar Ali, Muhammad Shahid,
Abdul Shakoor, Muhammad Waseem Abbas, Khyzer Hayat, Waqas Hamid, M. Asim Rashid
Department of Agronomy, University of Agriculture, Faisalabad, Pakistan
Abstract
An experiment was conducted at Rice Research Institute, Kala Shah Kaku in 2010 during kharif season to study the influence of nitrogen (N) and potash (K) on severity of Bacterial leaf blight (BLB) of rice (Oryza sativa L.) aimed at improving productivity. The experiment was laid out in randomized complete block design with factorial arrangement with three replications. Treatments comprised of: 0 kg N ha−1, 75 kg N ha−1, 100 kg N ha−1, 125 kg N ha−1 and 0 kg
K ha−1, 50 kg K ha−1, 75 kg K ha−1, 100 kg K ha−1. Data on disease severity and
paddy yield were recorded using standard procedures. Paddy yield was af-fected significantly by various combinations of N & K. In case of bacterial leaf blight, minimum diseased incidence percentage was observed when nitrogen alone was applied @ 75 kg∙ha−1 in contrast to fertilizer applied @ 125 kg N ha−1
+ 50 kg K ha−1 which showed maximum diseased incidence percentage.
Maximum paddy yield (4.32 t∙ha−1) was recorded when rice was fertilized @ 75
kg N ha−1 + 100 kg K ha−1 as compared to sole fertilization of 75 kg K ha−1 that
produced minimum paddy yield (2.40 t∙ha−1). Maximum gross income, net
returns and benefit cost ratio were obtained where rice crop was fertilized @ 75 kg N ha−1 and 100 kg K ha−1.
Keywords
Rice, Bacterial Leaf Blight, Paddy Yield, Harvest Index, Benefit Cost Ratio
1. Introduction
Rice (Oryza sativa L.) is an important cereal crop and nearly more than half population of the world subsists on it. It is the third largest crop in Pakistan after wheat and cotton [1]. Despite higher potential, average yield of rice in Pakistan
How to cite this paper: Manzoor, N., Akbar, N., Anjum, S.A., Ali, I., Shahid, M., Shakoor, A., Abbas, M.W., Hayat, K., Ha-mid, W. and Rashid, M.A. (2017) Interac-tive Effect of Different Nitrogen and Potash Levels on the Incidence of Bacterial Leaf Blight of Rice (Oryza sativa L.).
Agricultur-al Sciences, 8, 56-63.
http://dx.doi.org/10.4236/as.2017.81005
Received: December 1, 2016 Accepted: January 16, 2017 Published: January 19, 2017
Copyright © 2017 by authors and Scientific Research Publishing Inc. This work is licensed under the Creative Commons Attribution International License (CC BY 4.0).
is 2.38 t∙ha−1 which is lower than most countries in the world. This low
produc-tion is attributed to delayed sowing, low plant populaproduc-tion, imbalance fertilizer use and disease attack especially Rice blast and Bacterial leaf blight [2]. Rice blast and BLB of rice are more widespread in Pakistan [3]. The bacterial leaf blight disease is reported to induce 50% or even greater losses in severe cases. Losses in the Tropical Asia varied 2% - 74% depending upon location, weather conditions, crop stage and cultivar [4].
Effective control of the disease had not been achieved by chemical methods
[5]. Under prevailing conditions commercial resistant varieties are generally scarce and current varieties are susceptible to these diseases thus reducing their potential due to disease attack. Cultural practices such as fertilizer rate, sowing time and irrigation etc. played an important role for the control of these diseases
[6]. So, there is a need to emphasize over the cultural techniques for the effective management of these diseases. The plant diseases are influenced by specific ge-notype, fertilizer input and climatic conditions, which vary yearly [7]. Different plant nutrients and their balanced use played a significant role in reducing pest and disease infestation, which results in higher returns through enhanced yields and better quality [8]. The cultural control may include the alteration of nitro-gen (N) and potash (K) levels and investigating the appropriate doses for the control of these diseases. Optimum fertilization of N and K induces disease to-lerance in plants.
It is a fact that excessive N application predisposes plants to disease caused by obligatory parasitic pathogens [9]. Excessive use of N fertilizers could result in more leaf growth that was over succulent and more susceptible to certain diseas-es [10]. It was found that BLB incidence considerably exaggerated with increas-ing rate of N fertilizer [11]. On the other hand, it was found that low N fertilizer use increased susceptibility to disease attack. BLB was considerably more severe on the vulnerable cultivars when N fertilizer was added in low rates. Nitrogen deficiency induced modification of many morphological and physiological pa-rameters, limitation of growth, leaf number and leaf area [12]. It found that narrow brown leaf spot was more severe in low N treatments [13][14][15]; they also emphasized on the positive role of N fertilization for minimizing disease in-cidence [7].
Contrarily, [21] found that K did not affect the disease severity of Anthrac-nose crown rot (Colletotrichum fragariae) on strawberry plants. K fertilization did not have a noticeable effect on disease severity scores. Similarly, [13] inves-tigated the effect of K fertilization on the severity of Narrow brown leaf spot in rice. The present study was therefore planned to evaluate the influence of N and K solely or in combination, on the incidence of BLB of rice.
2. Materials and Methods
A research to study influence of N and K levels on the severity of BLB was con-ducted at Rice Research Institute (RRI), Kala Shah Kaku, Lahore, during kharif season, 2010. The experiment was laid out in a Randomized Complete Block De-sign (RCBD) with factorial arrangement comprising three replications using net plot size of 2.25 m × 6.0 m. The treatments of an experiment comprised; 0 kg N ha−1 (control), 75 kg N ha−1, 100 kg N ha−1, 125 kg N ha−1 and 0 kg K ha−1
(con-trol), 50 kg K ha−1, 75 kg K ha−1, 100 kg K ha−1. Thirty days old nursery of Super
Basmati was transplanted manually in puddled field on 16th July, 2010.
Phos-phorous fertilizer was added @ 75 kg∙ha−1. Whole of the phosphorus and zinc
was applied at the time of soil preparation. Full dose of K were added to the plots just before transplanting of rice nursery according to respective treatments. N was added in two splits i.e. 1/2 of N was applied just after transplantation of nursery and remaining 1/2 half dose was applied 30 days after transplanting (DAT). Machete 60EC was applied @ 2 t/ha to control weeds just after four days of transplanting. The remaining (fallow) weeds were controlled manually. ZnSO4
(35%) was applied @ 12.5 kg∙ha−1 at 12 DAT. Rice was inoculated with
Xantho-monas oryzae pv. oryzae following clipping method at tillering and heading stage. Pathogen was inoculated by piercing method. The leaves were inoculated at booting stage. Paddy yield was recorded after harvesting each plot and was converted into t∙ha−1. Data regarding BLB incidence was analyzed following
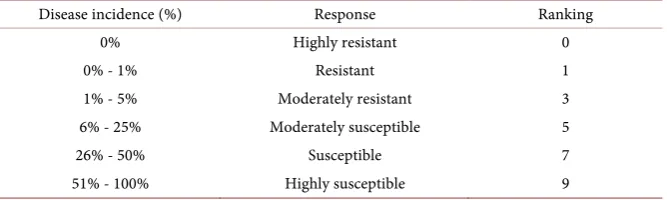
dis-ease rating scales (Table 1) developed by IRRI [22]. Percent disease incidence was calculated according to the formula as follows:
Disease Incidence (%) = (Total lesion area)/(Total leaf length) × 100
Statistical Analysis
[image:3.595.207.541.635.735.2]The data obtained were analyzed statistically by using Fisher analysis of variance technique and difference among treatment means was compared by using least
Table 1. Disease rating scale for assessment of BLB in rice crop.
Disease incidence (%) Response Ranking
0% Highly resistant 0
0% - 1% Resistant 1
1% - 5% Moderately resistant 3
6% - 25% Moderately susceptible 5
26% - 50% Susceptible 7
significant difference test (LSD) at 5% probability level. The differences were only considered when significant at p < 0.05 [23].
3. Results and Discussion
The analysis of variance confirmed the statistically significant variation among the different rates of nitrogen (N) application as well as among the different rates of potassium (K) application. Moreover, interactive effects of N and K ap-plication were also found to be statistically significant.
The results showed that disease incidence of bacterial leaf blight (BLB) in rice decreased as K application increased at 0 kg ha−1 N but this decreased was not
statistically significant over control (no application of N and K). However, at 75 kg ha−1 N, K application decreased the disease incidence significantly. The
min-imum disease incidence of BLB (15.76%) in rice was observed when 75 kg ha−1 N
was applied with no application of K and these results were followed by the ap-plication of 75 kg ha−1 N with 100 kg ha−1 K where disease incidence was 21.22%.
However, application of 75 kg ha−1 N with 0 kg ha−1 K was statistically at par
with the application of 75 kg ha−1 N with 100 kg ha−1 K but statistically
signifi-cant from all other combinations of N and K in terms of disease incidence in rice. Maximum disease incidence in rice was observed when 125 kg ha−1 N was
applied with 50 kg ha−1 K followed by control (no application of N and K)
(Table 2). The percent diseased leaf area showed a parabolic trend to various N fertilization levels at 0 kg K ha−1 i.e. more where no N was applied, decreased by
55% when N application was made at the rate of 75 kg N ha−1, and again
in-creased by 11.9% to 26.6% at 100 kg N ha−1 to 125 kg N ha−1 against control (0 kg
N ha−1). At 50 kg K ha−1 level, the percent diseased leaf area remained unaffected
with N fertilization from 0 kg N ha−1 to 100 kg N ha−1, however percent diseased
leaf area (% DLA) reaches at its maximum at 125 kg N/ha. On the other hand, percent diseased leaf area (% DLA) remained unaffected with any rate of N at 75 kg K ha−1 level. The percent diseased leaf area (% DLA) once again showed a
pa-rabolic trend at 100 kg K level where comparatively high percent diseased leaf area (% DLA) was recorded in treatment without N fertilization and it decreased by 24.48% at 75 kg N ha−1 level. A further increase of N fertilization by 25 kg N
ha−1 (i.e. 100 kg N ha−1) did not contributed any way to percent diseased leaf area
(% DLA). However, when N fertilization was increased up to 125 kg N ha−1 the
percent diseased leaf area (% DLA) again increased by 33%. Percent diseased leaf area (% DLA) varied differently in relation to N fertilization at different K rates. Irregular trend was seen at different K levels however, 75 kg N ha−1 to 100 kg N
ha−1 gave lower percent diseased leaf area (% DLA) as compared to control and
125 kg N ha−1. Based on results, it was deduced that BLB could be minimized by
a better combination of N and K rather to apply these nutrients in a haphazard manner. So for better management of disease a balanced combination of N and K should be applied. It is suggested that K:N ratio is more important than the effect of each individual nutrient in blast development [18].
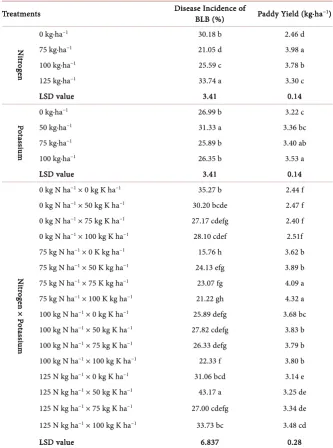
Table 2. Effect of nitrogen and potassium on the diseases incidence of bacterial leaf blight and paddy yield of rice.
Treatments Disease Incidence of BLB (%) Paddy Yield (kg∙ha−1)
N
itro
ge
n
0 kg∙ha−1 30.18 b 2.46 d
75 kg∙ha−1 21.05 d 3.98 a
100 kg∙ha−1 25.59 c 3.78 b
125 kg∙ha−1 33.74 a 3.30 c
LSD value 3.41 0.14
Po
tas
si
um
0 kg∙ha−1 26.99 b 3.22 c
50 kg∙ha−1 31.33 a 3.36 bc
75 kg∙ha−1 25.89 b 3.40 ab
100 kg∙ha−1 26.35 b 3.53 a
LSD value 3.41 0.14
N
itr
og
en
×
P
ota
ssi
um
0 kg N ha−1 × 0 kg K ha−1 35.27 b 2.44 f 0 kg N ha−1 × 50 kg K ha−1 30.20 bcde 2.47 f 0 kg N ha−1 × 75 kg K ha−1 27.17 cdefg 2.40 f 0 kg N ha−1 × 100 kg K ha−1 28.10 cdef 2.51f 75 kg N ha−1 × 0 K kg ha−1 15.76 h 3.62 b 75 kg N ha−1 × 50 K kg ha−1 24.13 efg 3.89 b 75 kg N ha−1 × 75 K kg ha−1 23.07 fg 4.09 a 75 kg N ha−1 × 100 K kg ha−1 21.22 gh 4.32 a 100 kg N ha−1 × 0 kg K ha−1 25.89 defg 3.68 bc 100 kg N ha−1 × 50 kg K ha−1 27.82 cdefg 3.83 b 100 kg N ha−1 × 75 kg K ha−1 26.33 defg 3.79 b 100 kg N ha−1 × 100 kg K ha−1 22.33 f 3.80 b 125 N kg ha−1 × 0 kg K ha−1 31.06 bcd 3.14 e 125 N kg ha−1 × 50 kg K ha−1 43.17 a 3.25 de 125 N kg ha−1 × 75 kg K ha−1 27.00 cdefg 3.34 de 125 N kg ha−1 × 100 kg K ha−1 33.73 bc 3.48 cd
LSD value 6.837 0.28
Note: Values sharing the different letters differ significantly at 0.05 probability; NS = Non-Significant.
K application. However, at 75 kg N ha−1, K application increased paddy yield
significantly. Further increase in N dose along with K didn’t influence paddy yield significantly. Maximum paddy yield (4.32 t∙ha−1) was recorded with the
ap-plication of 75 kg ha−1 N with 100 kg ha−1 K followed by 75 kg ha−1 N with 75 kg
ha−1 K. Application of 75 kg ha−1 N with 100 kg ha−1 K was statistically at par
with the application of 75 kg ha−1 N with 75 kg ha−1 K but statistically significant
to 100 kg N ha−1. This increase in yield was attributed to more number of panicle
bearing tillers, more 1000 kernel weight and more number of kernels per panicle at 75 kg N ha−1 and 100 kg N ha−1. This increase in yield was supported by [15];
they found an increase in yield with increased N rates. An increase in yield with increasing N fertilization was observed. However, there was a significant de-crease in yield at 125 kg N ha−1 irrespective of different K levels. This decrease in
yield may be due to high disease percentage [6] [19]. Similarly, an increase in yield up to 85 kg N ha−1 was observed beyond this level decrease in yield was
at-tributed to accumulative effect of N toxicity and disease severity. The yield also displayed a positive increase with increase in K fertilization [2]. These results were advocated by [17] they explained that potassium fertilization increased the yield over the control.
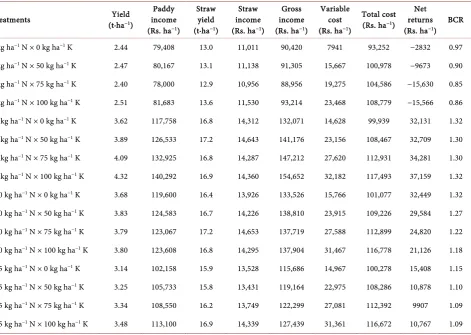
Economic analysis revealed that application of 75 kg N ha−1 with 100 kg K ha−1
gave maximum gross income of Rs. 154,652 ha−1 (Table 3). The highest gross
income at this level is attributed to highest yield at the fertilization rate. Applica-tion of 75 kg N ha−1 with 100 kg K ha−1 gave maximum net returns amounting
Rs. 37159. The highest cost benefit ratio of 1.32 was obtained by 75 kg N ha−1
with 100 kg K ha−1 and 100 kg N ha−1 and 0 kg K ha−1. The production level at T8
[image:6.595.66.538.387.722.2]is favored for lower disease severity.
Table 3. Economic analysis of different application rates of N and K in rice.
Treatments (t∙haYield −1)
Paddy income (Rs. ha−1)
Straw yield (t∙ha−1)
Straw income (Rs. ha−1)
Gross income (Rs. ha−1)
Variable cost (Rs. ha−1)
Total cost (Rs. ha−1)
Net returns (Rs. ha−1) BCR 0 kg ha−1 N × 0 kg ha−1 K 2.44 79,408 13.0 11,011 90,420 7941 93,252 −2832 0.97
0 kg ha−1 N × 50 kg ha−1 K 2.47 80,167 13.1 11,138 91,305 15,667 100,978 −9673 0.90
0 kg ha−1 N × 75 kg ha−1 K 2.40 78,000 12.9 10,956 88,956 19,275 104,586 −15,630 0.85
0 kg ha−1 N × 100 kg ha−1 K 2.51 81,683 13.6 11,530 93,214 23,468 108,779 −15,566 0.86
75 kg ha−1 N × 0 kg ha−1 K 3.62 117,758 16.8 14,312 132,071 14,628 99,939 32,131 1.32
75 kg ha−1 N × 50 kg ha−1 K 3.89 126,533 17.2 14,643 141,176 23,156 108,467 32,709 1.30
75 kg ha−1 N × 75 kg ha−1 K 4.09 132,925 16.8 14,287 147,212 27,620 112,931 34,281 1.30
75 kg ha−1 N × 100 kg ha−1 K 4.32 140,292 16.9 14,360 154,652 32,182 117,493 37,159 1.32
100 kg ha−1 N × 0 kg ha−1 K 3.68 119,600 16.4 13,926 133,526 15,766 101,077 32,449 1.32
100 kg ha−1 N × 50 kg ha−1 K 3.83 124,583 16.7 14,226 138,810 23,915 109,226 29,584 1.27
100 kg ha−1 N × 75 kg ha−1 K 3.79 123,067 17.2 14,653 137,719 27,588 112,899 24,820 1.22
100 kg ha−1 N × 100 kg ha−1 K 3.80 123,608 16.8 14,295 137,904 31,467 116,778 21,126 1.18
125 kg ha−1 N × 0 kg ha−1 K 3.14 102,158 15.9 13,528 115,686 14,967 100,278 15,408 1.15
125 kg ha−1 N × 50 kg ha−1 K 3.25 105,733 15.8 13,431 119,164 22,975 108,286 10,878 1.10
125 kg ha−1 N × 75 kg ha−1 K 3.34 108,550 16.2 13,749 122,299 27,081 112,392 9907 1.09
125 kg ha−1 N × 100 kg ha−1 K 3.48 113,100 16.9 14,339 127,439 31,361 116,672 10,767 1.09
4. Conclusion
Rice blast responded significantly to N fertilization. Both deficiency and exces-sive use of N promoted disease severity. BLB also responded significantly to K fertilization. Both deficiency and excessive use of N promoted BLB disease se-verity. Lower diseased leaf area (% DLA) was observed where N was applied at the rate of 75 - 100 kg∙ha−1. Results revealed that balanced nutrition is required
to BLB. As the rate of N fertilizer was increased the demand for potassium also increased. Super Basmati gave best paddy yield, highest harvest index value, higher gross income, maximum net returns, higher benefit cost ratio and more resistance against BLB when fertilized @ 75 kg N ha−1 & 100 kg K ha−1.
References
[1] Anonymous (2010) Economic Survey of Pakistan 2009-10. Ministry of Food
Agri-culture and Livestock Division (Economic Wing), Government of Pakistan, Isla-mabad, 22-23.
[2] Chaudhary, A.U., Hussain, M., Iqbal, J. and Ali, M.A. (2009) Effect of Nitrogen Doses on Incidence of BLB in Rice.Journal of Agricultural Research, 3, 253-257. [3] Ou, S.H. (1985) Rice Diseases. 2nd Edition, Commonwealth Mycological Institute,
Kew, 380 p.
[4] Davierwala, A.P., Reddy, A.P.K., Lagu, M.D., Ranjekar, P.K. and Gupta, V.S. (2001) Marker Assisteel Selection of Bacterial Blight Resistant Gene in Rice. Biochemical
Genetics, 7-8, 261-178.https://doi.org/10.1023/A:1010282732444
[5] Reissing, W.H., Heinrich, E.A., Listinger, I.A. and Barrian, A. (1986) Illustrated Guide to Integrated Pest Management in Rice. Tropical Asia IRRI, Manaila Philip-pines, 411 p.
[6] Myint, S.S., Nyut, H.K., Ko, H.K. and Thein, M.M. (2007) Study on the Effect of Different Urea Fertilizer Rates and Plant Populations on the Severity of Bacterial Blight of Rice. Journal of Agriculture & Development in the Tropics & Subtropics, 2, 161-167.
[7] Krupinsky, J.M. and Tanaka, D.L. (2001) Leaf Spot Diseases on Winter Wheat In-fluenced by Nitrogen, Tillage, and Haying after a Grass-Alfalfa Mixture in the Con-servation Reserve Program. Plant Disease, 85, 785-789.
https://doi.org/10.1094/PDIS.2001.85.7.785
[8] Magnen, H. (2008) Balanced Crop Nutrition: Fertilizing for Crop and Food Quality.
Turkish Journal of Agriculture and Forestry, 3, 183-193.
[9] Gothoskar, S.S., Scheffer, R.P., Walker, J.C. and Stahmann, M.A. (1995) The Role of Enzymes in the Development of Fusarium Wilt of Tomato.Indian Phytopathology, 3, 381-387.
[10] Sharma, P. (2007) Vegetables Diseases, Diagnosis and Biomanagement. Aavishkar Publishers, Distributors, Jaipur India, 218.
[11] Matho, J. and Schure, P.S.J. (2001) “Kersek”, a Bacterial Disease of Rice. Contribu-tion, General Agriculture Research Bogor, 117, 1-17.
[12] Ruckstuhl, M. (1998) Population Structure and Epidemic of Bipolaris sorakiniana in Rice-Wheat Cropping Pattern in Nepal. In: Duveiller, E., Dubin, H.J., Reeves, J. and Mchab, A., Eds., Helminthosporium Blights of Wheat Spot Blotch and Tan Spot, CIMMYT, Veracruz, 1328 p.
K Application on the Occurrence and Severity of Narrow Brown Leaf Spot in Dif-ferent Rice Varieties. Journal of Plant Protection Sciences, 1, 51-54.
[14] Bockus, W.W. and Davis, M.A. (2003) Effect of Nitrogen Fertilizers on Severity of Tan Spot of Winter Wheat. Plant Disease, 77, 508-510.
https://doi.org/10.1094/PD-77-0508
[15] Chaurasia, P.C.P. and Duveiller, E. (2006) Management of Leaf Blight (Bipolaris
sorokiniana) Disease of Wheat with Cultural Practices. Nepal Agriculture Research
Journal, 7, 63-69.
[16] Harris, G. (1997) Potassium Deficiency in Cotton Linked to Leaf Spot Disease. Bet-ter Crops, 2, 10-12.
[17] Jayasena, K. and Brennan, R. (2007) Potassium Deficient Soil Is More Susceptible to Powdery Mildew Diseases. Department of Agriculture and Food, Western Australia Farmnote 216.
[18] Prabhu, A.S., Barbosa, M.P. and Filipp, M.C. (1999) Relationship between Potas-sium Fertilization and Panicle Blast Severity in Upland Rice. Pesquisa Agropecuária Brasileira, 9, 1729-1732.
[19] Tajani, M., Douira, A., Haloui, N.E. and Benkirane, R. (1993) Impact of Fertiliza-tion on Disease Development and Yield Components. Cahiers Options Mediterra-neennes,3, 95-99.
[20] William, J. and Smith, S.G. (2001)Correcting Potassium Deficiency Can Reduce Rice Stem Diseases. Better Crops, 85, 7-9.
[21] Smith, B.J. (2009) Influence of Nitrogen, Phosphorus, and Potassium on the Severi-ty of Strawberry Anthracnose Crown rot. Acta Horticulturae, 842, 235-238. https://doi.org/10.17660/ActaHortic.2009.842.37
[22] IRRI (International Rice Research Institute) (2004) Rice, Almanac. 3rd Edition, In-ternational Rice Research Institute, Los Baños, 59-235.
[23] Steel, R., Torrie, J. and Dickey, D. (1997) Principles and Procedures of Statistics. A Biometrical Approach. 3rd Edition, McGraw Hill Book Co., New York.
Submit or recommend next manuscript to SCIRP and we will provide best service for you:
Accepting pre-submission inquiries through Email, Facebook, LinkedIn, Twitter, etc. A wide selection of journals (inclusive of 9 subjects, more than 200 journals)
Providing 24-hour high-quality service User-friendly online submission system Fair and swift peer-review system
Efficient typesetting and proofreading procedure
Display of the result of downloads and visits, as well as the number of cited articles Maximum dissemination of your research work
Submit your manuscript at: http://papersubmission.scirp.org/