Predictive Model for Finance Industry using Machine Learning
Algorithms and a Study on its Performance Analysis
Mrs. Sona Shaju K
M. Tech Student
Department of Computer Science & Engineering
Thejus Engineering College, Thrissur, India, India
Abstract— Machine learning which is a process of learningthe machine with available data to think like humans is a part of artificial intelligence and has a vast scope as the future technology. It can be used for almost all sectors for predictive analysis, cognitive services, virtual assistance, video surveillance, risk management, fraud detection etc. In this paper, it is concentrating on how the machine learning can be applicable for predicting risk assessment and fraud detection in finance sector which have some imbalanced data sets. Finance sector is the wealth backbone of any country, so risk assessment and fraud detection has great importance. Risk assessment is the process of identifying vulnerabilities to an organization by identifying risk involved in each and every new plans, policies or investments. This paper concentrates on risk level detection of loan application and insurance claim. Fraud detection is the process of finding fraud activities, events or transactions. It can be associated with several fields like money transaction, network intrusion etc. In this paper, fraud money transaction is detected. These all areas contain imbalanced data and these data sets bear with the minority and majority class problems which will hardly affect the prediction accuracy. This paper suggests a predictive model for risk assessment and fraud detection using three efficient machine learning algorithms after applying undersampling technique on data and compares the accuracy difference of them, on imbalanced and resampled data sets with the leading machine learning algorithms Random Forest, SVM (support vector machine) and ANN (Artificial Neural Network). This paper is implemented using Qt IDE and OpenCV library using C++ language. The paper analyses the parameters of each algorithm and tries to find out the solution to increase the efficiency of each algorithm by changing these parameters.
Key words: Machine Learning, Finance Sector, Risk Assessment, Fraud Detection, Accuracy, Algorithm Parameters
I. INTRODUCTION
Machine learning has great influence on finance sector which includes a wide range of companies and organizations involved with money, like money lending, investing, insuring and securities issuance and trading services. Machine learning (ML) can be used to find the interesting and useful information from the data. It can be applied on important processes like risk management and fraud predictions. Appropriate decisions should be taken throughout these stages by the decision maker to avoid the great loss.
Risk assessment gives a clear picture about the risk involved in whatever new activities the concerning company is performing and helps to take sensible measure to control the risks. It is a part of managing the health and safety of the businesss. The risk levels involved in the loan approval
process and insurance claim process is detected in this paper using the three leading algorithms and the most efficient algorithm is suggested. Fraud detection helps the company to categorize the genuine and fraud activities and can help to reduce the money loss. Whether a money transaction is fraud or not is detected in this paper.
ML can contribute well for the appropriate decision making process by learning the machine with available data set and by training the machine with efficient machine learning algorithms. If the available data set contains the classification of each instance, then supervised learning algorithm is used. If the data set doesn’t contain the classification, then unsupervised methods are used and if the data set gives classification for only some instance, then the machine have to extract the rule through its experience and reinforced techniques are used. In this paper supervised learning algorithms are used because of the classification is already given in the data set. Algorithms perform differently for the different data set. The reasons are the size of data set, number of attributes, imbalance problem, missing values and value type of data set.
Data is the most important thing in machine learning and it can be collected through different ways. Some available data are huge which should be handled as big data and some are not. Most data sets available in finance sector are imbalanced data sets which consist of majority and minority class problems. This is a situation where the number of instances in one class is significantly lower than the number of instances in another class. This problem can affect the accuracy rate of predictions done by the algorithms. All algorithms don’t perform well with the imbalanced data. Resampling techniques should be used for overcoming this problem. Different types of resampling techniques are there, but in this paper Random under sampling technique which is a data level resampling techniques is used.
II. RELATED WORK
In[1] ‘Data Mining: Current Applications & Trends’ by Sedhant Sethi says that, large amount of data is available, but these data has no use until it is changed into some useful information. This information can be extracted from the available raw data and these information is required to be processed and scanned for taking useful and accurate decisions and predictions (or forecasting). This paper also describes the different applicable areas where data mining can be used-education, banking, retail industry, telecommunication, forecasting, science and engineering, web mining, fraud detection, intrusion detection, financial data analysis, business analytics etc.
laundering, fraud financial statement, loan disbursement etc. Sivakumar swamy N and Prof.Sanjeev C.Ligareddy in their work ‘Fraud detection using data mining technique’ [3] says about the online fraud detection using data mining technique. It is a survey paper clearly defines the underlying technical problems and covers more relevant fraud types, methods, and techniques. They well studied about different dataset on insurance fraud, fraud in credit transactional data and Fraud in home insurance are analyzed and overall percentage of fraud activities are analyzed. Performance measurements of supervised, unsupervised and semi-supervised data mining algorithms are well studied. Decision tree, Bayesian network and neural networks are used for the fraud detection. Bagging is used to combine the results of separate algorithms to find the best cost effective model. Two studies on telecommunications data show that supervised approaches achieve better results than unsupervised ones
In ‘Implementation of Data Mining Techniques in Upcoding Fraud Detection in the Monetary Domains’,[6] Dr.Mrs Ananthi Sheshasayee and Surya Susan Thomas gives an insight into the various data mining Techniques which are efficient in detecting upcoding frauds especially in the healthcare insurance sector in India.
In ‘Fraud Detection Based-on Data Mining on Indonesian e-Procurement System (SPSE)’ [4] Hasan Asyari Arief, G.A. Putri Saptawati and Yudistira Dwi Wardhana Asnar focuses on detection of potential fraud that occurs in the procurement process via the Indonesian The performance measures like SAR(Square error), accuracy ROC curve, misclassification cost(cost model). Misclassification costs are calculated based on total investigation cost and the salvage value of the bidding price that occurs in a project EProcurement System (SPSE). Potential fraud activities include corruption, collusion and tender fixation. The dataset consists of missing values and inconsistencies. In this paper they are proposing a new fraud detection method using supervised learning algorithms. They conclude that Naive Bayes algorithm with 14 attributes produces the best performance with accurate result compared to the other fraud detection techniques.
Mr.Suresh Yaram in his paper, ‘Machine Learning Algorithms for Document Clustering and Fraud Detection’,[7] says that document clustering can be used for grouping unstructured data and classification techniques can be used for financial fraud detection in banking, financial services and insurance industry. Decision Tree, Random Forest and Naïve Bayes are performed on an insurance claim dataset to find fraud insurance claims. These are implemented using ‘R tool’ which is a well-known data mining tool.
Jaoud West and Maumitha Bhattacharya in their work,’ An Investigation on Experimental Issues in Financial Fraud Mining’[7] trying to figure out the three key experimental issues in financial fraud detection using data mining. They are choice of detection algorithm, performance metrics, and feature selection. Feature selection is a particularly complicated problem for financial fraud detection due to the imbalanced nature of data. The simulations were performed on the UCSD credit card fraud
of nine detection algorithms both on their own and combined with seven feature selection algorithms.
Qiang Liu in his paper,’ A Survey on Security Threats and Defensive Techniques of Machine Learning: A Data Driven View’,[19] addresses security threats of data mining techniques like and give a systematic survey on them from two aspects, the training phase and the testing/inferring phase. They categorize current defensive techniques of machine learning into four groups: security assessment mechanisms, counter measures in the training phase, those in the testing or inferring phase, data security and privacy. Finally, they provide five notable trends in the research on security threats and defensive techniques of machine learning, which are worth doing in-depth studies in future.
Haoyue Liu in their work ‘Decision tree rule-based Feature Selection for Large-scale Imbalanced Data’, [11] proposes a feature selection approach based on a decision tree rule for imbalanced data used in fault diagnosis, fraud detection, text categorization etc. The experiment was done over dataset from Santander Bank. The results show that this approach can achieve higher Area under the Curve (AUC) and less computational time. Decision tree rule based feature selection approach is based on a classification and regression tree (CART) algorithm. This algorithm forms decision trees by using historical data with pre-assigned classes for all observations. A CART is a binary decision tree that is constructed by splitting data into two parts with maximum homogeneity. Tree is built by using recursive splitting of nodes. The best splitting nodes are chosen by searching all possible variables and all possible values. The splitting criterion for the CART algorithm is called Gini index.
A method for improving the c4.5 is introduced in the paper “Improved Algorithm of C4.5 Decision Tree on the Arithmetic Average Optimal Selection Classification Attribute” [15] by Bin Nie,Jigen Luo, Jianqiang Du,Lin Peng. First computing the information gain of selection classification attribute, and then get an attribute of the information gain which is higher than the average level; Secondly, computing separately the arithmetic average value of the information gain ratio and information gain of the attribute, and then select the biggest attribute of the average value and set up a branch decision; Finally, to use recursive method to build a decision tree.
Anomaly detection using random forest is described in the paper “Anomaly Detection using Random Forest: A Performance Revisited”[18] by Rifkie Primartha, Bayu Adhi Tama. Random forest is a classifie rensemble used for classification or regression task. It is another variant of bagging ensemble proposed by Breiman . In some cases, it performs better than boosting and faster than bagging and boosting. The original version of random forest could be taught as a version of bagging where the base classifier is a random tree.
The Decision Tree (DT) classifier is a method that has been used as a preprocessing step for SVM in recent years. DT has also been combined with SVM to face multi class problems. Such a method is introduced in “Data Selection Using Decision Tree for SVM Classification”[14] by Asdrubal Lopez-Chau. Novel data reduction method for SVM based on DT. The method applies a DT to detect regions with low entropy, then a number of examples is chosen giving preference to those ones that are furthest from the center of that region.
III. RISK ASSESSMENT
Risk in financial sector is regarded as the threat to the steady flow of income. It is the possibility that something unpleasant or damage or negative impact can happen. The risk assessment plan of a finance service operator ensures that exposure to either financial loss is contained. According to the international organization of standardization (ISO) risk management should create a value. Risk assessment is a part of decision making which will help the decision maker to understand the situation along with the possible outcomes[24].Credit risk/default risk/financial risk is the main risk faced by the finance sector in approving the loan application by a debtor. Sometimes those applicants don’t pay back the money and will result in heavy capital loss. If these type of customers increases, it will increase the bad debt and affect the existence of the organization. So, appropriate decision should be taken in the loan sanctioning process after analyzing the financial status of the applicant. How much risk is involved in sanctioning a insurance claim is also predicted in though the proposed predictive model.
IV. FRAUD DETECTION
It is done to find the illegal or not genuine activities performed in an organization. If it is happening for a finance sector, it is very difficult to find out. Because of enormous number of transactions handled by most institutions versus the relatively small number of fraudulent transactions, the speed with which technology allows fraudsters to operate, poor or incomplete data, and the lack of information sharing among financial institutions. By combining proprietary data sets with industry benchmarks and government information, financial institutions can use artificial intelligence, machine learning, and analytics in the fight against financial fraud [25]. Fraud activity can be happened in several fields like network intrusion, money transaction, cybercrime, identity theft, money laundering etc[]. This paper concentrates on detecting a fraudulent money transaction. Money laundering is the main fraud activity happening in money transaction. The huge amount of illegal money is converted in to legal money by doing large number of small transactions. In simple words it can said as, just a process of converting black money into white money.
V. ARCHITECTURE
VI. METHODOLOGY
A. Undersampling for imbalanced data sets
Imbalanced data set deals with majority and minority class problems. This is a very crucial problem in fraud detection and risk assessment. The predictive model developed by using this type of data set show less accuracy. The situation is the number of instances in one class is very much less than the number of class in the class. For e.g.: in fraud transaction detection data set, the number of fraud will be less compared to the non-fraud instances. So, the classification algorithms performed on this will do the prediction with high error rate. Sometimes no instances of the minority class are predicted even if it is producing a high accuracy. If an event is less than 5% of the total data, that instances are considered as rare ones[]. A minimum percentage of each class is required in the training set, otherwise the machine can’t learn the data and form the rule (or pattern). 98% accuracy outcome given by a classifier algorithm with an event rate 2% cannot be considered if it classifies all instances only as the majority classes. Performance analysis of algorithms cannot be done, because the performance is evaluate on the confusion matrix generated on the basis of actual and predicted classifications. Publically available data sets from ‘Kaggle’, a well-known site for data set is used for the experiment. ALL the data set were in csv format and all of them are converted into excel format. Resampling should be done on this imbalanced data for better result. Different resampling techniques are used today like undersampling, oversampling, Smote etc.
1) Undersampling:
2) Oversampling:
It increase the number of minority instances by replicating it until it is balanced with the majority classes.But it cause overfitting problem.
3) SMOTE (Synthetic minority over-sampling technique): Synthetic instances of minority classess are created by taking a small subset of minority classes and added with the original data. This new data set is then used further. This is not suitable for high dimensional data(data set with more number of attributes).
a. Risk assessment data sets
1) The German data set from kaggle is used. This is a real time data set consists of 1000 instances and 21 attributes and two classifications are there, approve and disapprove. Approved instances involved low risk and disapproved instances involved high risk. Number of approved instances are 700 and nonapproved are 300(30 % of total data). This data set does not show imbalanced problem. The data set gives information about the approved and disapproved loan applications from a Bank. Among the information available from the data set a few are given below,
1) Status of current account 2) Loan purpose
3) Loan amount 4) Employment 5) Marital status 6) Credit history 7) Guarantor
8) Dues correctly paid or not etc
2) The second data set used is prudential life insurance data set from kaggle itself. It consists of 59381 instances with 127 attributes and some missing values and continuous values.1-8 levels of risk are given as classification (8 classes). This data has high imbalance problem. Among this 59381 instances, risk level 3 is only 1.7% of the total instances and all other risk levels except risk level 8 are below 20 % . Only risk level 8 has 32.8 % . For doing this experiment only 13841 instances are taken after applying under sampling technique, because of memory problem and still it contains imbalance problem. Some information in the data set are: Insurance policy details, Employment details, Medical history data, Age, BMI (body mass index) etc
b. Fraud Detection data sets
Paysim data set is taken from kaggle which gives information about ‘fraud’ and ‘nonfraud’ transactions. This data set consists of 1000000 transactions with 10 attributes and two classes. Fraud class and nonfraud class. This data set has high imbalance problem.The information included in this data are: old balance, new balance, transaction type etc. Only 5999 instances are considered because of memory problem. Among this 5999 instances 5948 instances are classified as frauds and remaining 52 is classified as nonfraud which is only (.87 %) of the total instances. The under sampling technique is performed on this data set and the new data set consists of 3845 instances with 2861 nonfraud class and 984 (26 %) frauds.
B. Applying Machine Learning Algorithms
Three leading classification algorithms are used for training purpose. Random Forest, SVM (Support vector machine), ANN (Artificial neural network).
1) Random Forest:
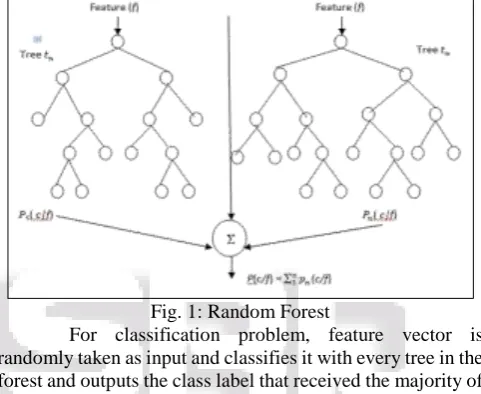
[image:4.595.308.549.249.446.2]Random forest is a supervised learning algorithm which will works well for classification and regression problems. Random tree is the collection of trees which is called forest mostly trained with the “bagging” method[]. Random forest builds multiple decision trees and merges the result of each tree to get an accurate prediction. The tree consists of a root node and child nodes. Each internal node represents the test on the features and the branches represents the outcome of the test and leaf node represents a label or a particular number of feature.
Fig. 1: Random Forest
For classification problem, feature vector is randomly taken as input and classifies it with every tree in the forest and outputs the class label that received the majority of “votes”. If this is used for regression, the output will be the average of the outputs over all the trees in the forest. All the trees are using same parameters but performed on different training set. Feature vector for input is selected randomly with replacement using bootstrap method. The classification error is estimated internally during the training. The training is done using randomly selected features using sampling with replacement, some vectors are left out. This is called oob data(out of bag).The classification error is calculated using this oob. The parameters of random forest are[]:
1) Max_depth : depth of the tree
2) Min-sample_count : Minimum sample count needed at the leaf node
3) Max_categories : value of a categorical variable to find the suboptimal split
4) Calc_var_importance : calculate the importance of variable
5) Nactive_vars : size of randomly selected features 6) Max_num_of_trees_in_the_forest: maximum number of
trees in the forest.
7) Forest _accuracy : sufficient accuracy(OOB error) 8) Termcrit_type : learning termination criteria
2) SVM (Support Vector Machine):
It is a supervised and binary classifier which which train the labeled data and outputs a line which separates the instances[].
W=x2 + y2
It checks whether the data is linearly separable or not. If it is not linearly separable, the data is converted into a high dimensional area and outputs the hyperplane which can place between the two classes.
f(x) = β0 + βTx Support vecots are the points nearest to the line or hyperplane, the points in the data set.
[image:5.595.309.548.102.254.2]Fig. 2: svm classification with line(linearly seperable )
Fig. 3: svm classification with hyperplane
Eventhough it is a binary classifier, it can be used for classifying more than two classes. This can be used for both classification and regression problems. It can be used for larger data sets as the training time with SVMs can be high. The parameters are[]:
1) C : regularization parameter of error term
2) Kernel : kernel type to be used in the classifier .It can be linear,polynomial,rbf, sigmoid, precomputed or callable (default is ‘rbf’)
3) Degree : degree of poly(ignored by others, default value is 3)
4) Gamma : kernel coefficient of rbf
Two types of training is possible in SVM. One is usual train and the other one is ‘auto’ type. ‘Auto’ type gives more accuracy because in auto type, first a particular number of instances are taken and and do the classification. Then the gamma value of that output is taken and again train using the whole data. SVM can’t read continous values and perform poor for imbalanced data.
C. ANN (Artificial neural network)
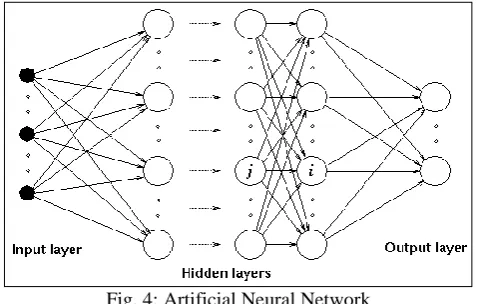
A neural network usually involves a large number of neurons operating in parallel and arranged in layers. The first layer is the input layer which receives the raw input information -- analogous to optic nerves in human visual processing. Next comes the hidden layers. Each successive layer receives the output from the layer preceding it, rather than from the raw input the last layer is the output layer which produces the output of the system. Neural networks are sometimes described in terms of their depth, including how many layers
they have between input and output, sometimes they are described on the basis of number of neurons used in the layers.
Fig. 4: Artificial Neural Network
In feed forward neural networks, a weight is added with every input and a bias is added with the hidden layers and an activation function is performed .Normally a sigmoid function is used. There are many types of activation functions—linear, sigmoid, hyperbolic tangent etc.
Each class receives a value and the class with maximum value is taken as the predicted class. Back propagation is done to adjust the value or to reduce the error by adjusting the weight and bias. This is a very powerful algorithm and can adapt with any situation. Moreover it can use used for complex tasks. This algorithm also doesn’t perform well for imbalanced data.
VII. EXPERIMENTAL RESULTS.
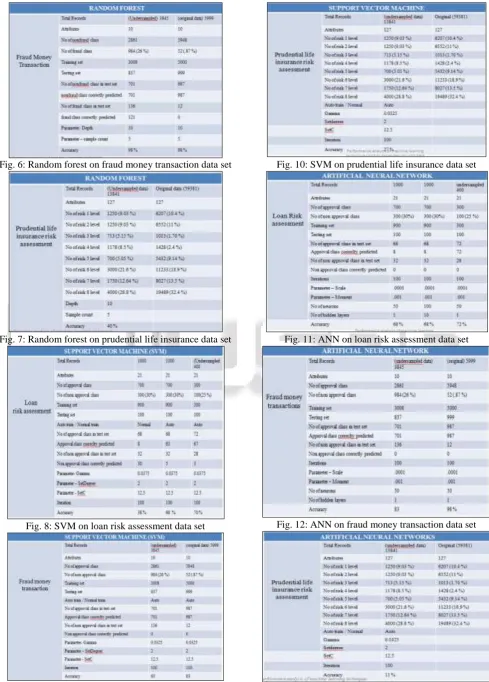
Experiment was done by performing the above explained three algorithms on risk assessment(2 data set) and fraud detection data set(1 data set). Before applying the algorithm the data set is well processed and cleaned. All the missing values are changed, continuous values are converted into discrete and resampling was done for solving the imbalanced data set problem. Undersampling technique is used to solve the imbalanced data problem. Then the performance of three algorithms for the three data sets are compared. The accuracy difference on balanced and unbalanced data is well studied. Then the maximum accuracy obtained by each algorithm on the basis of parameter change is examined. As a conclusion the best algorithm for handling risk assessment and fraud detection is suggested.
[image:5.595.319.537.608.754.2]Fig. 6: Random forest on fraud money transaction data set
Fig. 7: Random forest on prudential life insurance data set
[image:6.595.51.541.66.749.2]Fig. 8: SVM on loan risk assessment data set
Fig. 10: SVM on prudential life insurance data set
Fig. 11: ANN on loan risk assessment data set
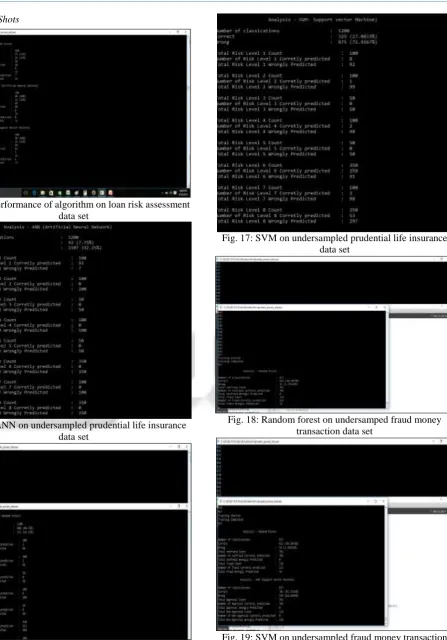
A. Screen Shots
[image:7.595.309.547.66.283.2]Fig. 14: Performance of algorithm on loan risk assessment data set
[image:7.595.46.287.69.258.2]Fig. 15: ANN on undersampled prudential life insurance data set
[image:7.595.48.286.270.475.2]Fig. 16: Random forest on undersampled prudential life insurance data set
Fig. 17: SVM on undersampled prudential life insurance data set
Fig. 18: Random forest on undersamped fraud money transaction data set
Fig. 19: SVM on undersampled fraud money transaction data set
VIII. CONCLUSION AND FUTURE WORK
[image:7.595.48.284.479.692.2] [image:7.595.307.548.481.683.2]accuracy for undersampled data sets. Then the parameters of algorithms are changed and repeated the experiment to get the maximum accuracy. Random forest is performing efficiently for all the cases. It gives an accuracy of 77 % for the loan risk assessment data set when the depth and sample count is adjusted to 10 and 5 and the event rate is 30 %, whereas SVM and ANN shows accuracy less than this. It gives a maximum accuracy of 98 % on fraud money transaction data set when the data is undersampled with event rate 26 %. Again it produces only 40% accuracy on fraud money transaction data set with event rate of each class less than 20 %, but the highest accuracy than the other two algorithms. So, it can be concluded that, classes in the available data set should balance with each other. Mostly the event rate should be greater than 25%, then only algorithms will provide better accuracy. Random forest can be considered as the best algorithm for imbalanced data set and can be used as an efficient algorithm for risk assessment and fraud detection prediction in finance sector. Undersampling is a best solution for solving the imbalance data problem. It can reduce the run time and memory when the data set is huge.
Stock prediction is an another important part of finance sector, so the best algorithm suits for this should be examined as the future work. Some more parameters of algorithms should also be considered in the further works.
REFERENCES
[1] Sidhanth Sethi, Dheeraj Malhothra, Neha Varma, “ Data mining current Applications and Trends” , IJIET, Vol-6, Issue-4, 2016
[2] Rashi Bansal, Nishant Gaur, Dr.Shailendra Narayan Sigh, “ Outlier Detection:Applications and Trends in Data Mining” , 6th International Conference - Cloud System and Big Data Engineering (Confluence), 2016, IEEE
[3] Shivakumar Swamy N, Prof.Sanjeev. C.Lingareddy, “ Fraud Detection using Data Mining”, IJIET , Vol-4, Issue-1, 2014
[4] Hasan Ansari Arief, Putri Saptawati, Yudistira Dwi, Woudhana Ansar, “ Fraud Detection based on Data Mining an Indonesian E-procuremnt system(SPSE)”, IEEE 2016
[5] R.Meenatkshi, Sivaranjari, “ Fraud Detection on Fianancial Statement using Data Mining Techniques and Performance Analysis”, IJITA, 2016
[6] Dr.Mrs.Ananthi Sheshasayee, Surya Susan Thomas,” Implementation of Data Mining techniques in upcoding fraud detection in the monetary domains”, ICIMA (International Conference on Innovative Mechanism for Industry Applications), 2017
[7] Suresh Yaram, “ Machine learning algorithms for document clustering and fraud detection “, ICDSE( International conference on Data Science and Engineering), IEEE 2016
[8] Swathi Jadhav, Hongmai He, Karl Jenkins, “ Academic review: Application of data mining techniques in finance industry”, International journal of soft computing and artificial Intelligence, Vol-4, Issue-1, 2016
(International conference on industrial electronics and applications, IEEE 2016
[10]Cheista coddy, Vitaly Ford, Ambareen Siraj, “ Decision tree learning for fraud detection in consumer energy consumption”, International conference on machine learning and application”, IEEE 2015
[11]Haoyue Liu, Mengchu Zhou ,” Decision tree rule based feature selection fpr large scale imbalanced data”, IEEE 2017
[12]Elena Drabikova, Erica Feckova Skabul Akova, “ Decision trees- a powerful tool in mathematical and economical modeling”, IEEE 2017
[13]Kaigi Zou, Wenning Sen, Hongzhi Yu, Fenxin Liu, “ ID3 decision tree in fraud detection applications”, international conference on computer science and electronics engineering, IEEE 2012
[14]Asdr´ubal L´opez-Chau¸ Xiou Lee, Wen Yu “Data Selection Using Decision Tree for SVM Classification”, 24th International Conference on Tools with Artificial Intelligence, IEEE 2012
[15]Bin Nie,Jigen Luo,Jianqiang Du,Lin Peng, Zhuo Wang,Ai Chen, “Improved Algorithm of C4.5 Decision Tree on the Arithmetic Average Optimal Selection Classification Attribute”, International Conference on Bioinformatics and Biomedicine (BIBM), IEEE 2017 [16]Priyanga Chandrasekar, Kai Qian, Hossain Shahriar¸
Prabir Bhattacharya, “Improving the Prediction Accuracy of Decision Tree Mining with Data Preprocessing”, 41st Annual Computer Software and Applications Conference, IEEE 2017
[17]Y. Grichi1, Y. Beauregard1, T. M. Dao,” A Random Forest Method for Obsolescence Forecasting”, IEEE 2017
[18]Rifkie Primartha, Bayu Adhi Tama,” Anomaly Detection using Random Forest: A Performance Revisited”, International Conference on Data and Software Engineering (ICoDSE), IEEE 2017
[19]Qian Liu, Pan Liu, Wentao Zao, Wei Ca , Shui yu, Vectror C.M , Leug, “A Survey on Security Threats and Defensive Techniques of Machine Learning: A Data Driven View”, IEEE 2016
[20]Sachin Bhaskart, Vijay Bahadur Singh, A. K. Nayak,” Managing Data in SVM Supervised Algorithm for Data Mining Technology”, IEEE 2014
[21]http://medium.com/@Synced/how-random- forest-algorithm-works-in-machine-learning-3c0fe15b6674 [22]http://
medium.com/machine-learning-101/chapter-2-
svm-support-vector-machine-theory-f0scikit-learn.org/stable/modules/generated/sklearn.svm.SVC.ht ml
[23]
http://www.hackerearth.com/blog/machine- learning/simple-tutorial-svm-parameter-tuning-python-r/
[24]
https://www.capgemini.com/wp-content/uploads/2017/07/fraud_solution_for_financial_s ervices_with_sas.pdf