University of East London Institutional Repository:
http://roar.uel.ac.uk
This paper is made available online in accordance with publisher policies. Please
scroll down to view the document itself. Please refer to the repository record for this
item and our policy information available from the repository home page for further
information.
Author(s): Palmer-Brown, Dominic; Lee, Sin Wee.
Article title: The Analysis of Network Manager’s Behaviour using a Self-Organising
Neural Networks
Year of publication: 2005
Citation: Donelan, H.; C. Pattinson; D. Palmer-Brown and S. W. Lee. (2005). “The
Analysis of Network Manager’s Behaviour using a Self-Organising Neural Networks.”
International Journal on Simulation: Systems, Science and Technology, 6 (9) 22-32.
Link to published version:
I. J. of SIMULATION Vol. 6 No 9 22 ISSN 1473-804x online, 1473-8031 print
THE ANALYSIS OF NETWORK MANAGERS’ BEHAVIOUR
USING A SELF-ORGANISING NEURAL NETWORK
H. DONELAN
1, C. PATTINSON
1, D. PALMER-BROWN
3and S.W. LEE
2Computer Communications Research Group1 Computational Intelligence Research Group2
Leeds Metropolitan University. School of Computing and Technology3,
University of East London, UK ([email protected])
Abstract: We present a novel neural network method for the analysis and interpretation of data that describes user interaction with a training tool. The method is applied to the interaction between trainee network managers and a simulated network management system. A simulation based approach to the task of efficiently training network managers, through the use of a simulated network, was originally presented by Pattinson [2000]. The motivation was to provide a tool for exposing trainee network managers to a life like situation, where both normal network operation and ‘fault’ scenarios could be simulated in order to train the network manager. The data logged by this system describes the detailed interaction between trainee network manager and simulated network. The work presented here provides an analysis of this interaction data that enables an assessment of the capabilities of the network manager as well as an understanding of how the network management tasks are being approached. A neural network architecture [Lee, Palmer-Brown, Roadknight 2004] is adapted and implemented in order to perform an exploratory data analysis of the interaction data. The neural network architecture employs a novel form of continuous self-organisation to discover key features, and thus provide new insights into the data.
Keywords: Network Management, Neural Networks, Data Analysis, Self-Organisation, Unsupervised Learning.
1. INTRODUCTION
A simulation based approach to the task of efficiently training network managers through the use of a simulated network was originally presented by [Pattinson, 2000]. The motivation was to provide trainee network managers with realistic, ‘hands-on’ experience without disrupting a live network. The approach makes use of a production-standard network management platform, interacting with processes (model agents) representing network entities. This simulation tool has been successfully used in the training of network managers. Tasks are set such as exploration exercises to identify active components of a network and the control of simulated ‘fault’ conditions. The trainee needs to quickly establish how to approach a given task, which devices need to be interrogated and what parameters need to be monitored in order to obtain information on the status of the network. The trainee selects commands that to the best of their knowledge represent the most appropriate course of action required to manage the network and data describing their actions is computer logged. It is this data that is being analysed here through the use of a neural network (NN) in order to assess the effectiveness of the network manager from how the tasks are being approached. The data includes a description of the commands issued by the trainee that request current values of, or set up processes to monitor,
various parameters. Also the node/device within the network that the command is directed at, as well as any associated variables, and a date and time stamp for each command. There are a total of 23 commands that the trainee may use and these can be divided into groups defined by the layer (or networking protocol) that they apply to or type of action being performed {Interface, IP, TCP, UDP, ICMP, SNMP and monitoring actions}. The commands are used to request current values of, or set up processes to monitor, various parameters and are divided into groups defined by the layer (or networking protocol) that they apply to.
I. J. of SIMULATION Vol. 6 No 9 23 ISSN 1473-804x online, 1473-8031 print relationships between variables that are extremely
difficult, if not impossible to discover by human eye or thought process and that therefore offer new information about the data. An unsupervised technique has been adopted as this requires no a priori knowledge about the data. Classes or categories are formed by the NN according to attributes of the data and it is then necessary to uncover what properties determine how the data has been classified.
Neural Networks have previously been applied to data types that face similar challenges to those faced here. For example the use of self-organising maps successfully demonstrated [Shalvi and DeClaris, 1998] an unsupervised NN approach to clustering medical data. Medical data typically requires a large amount of pre-processing in order to extract the useful information and tends to be numeric and textual interspersed. In these ways the data is very similar to that being examined here. There have been many projects involving NNs for user data analysis and pattern discovery. For example NNs can be used for learning relations between textual data to aid the construction of hypertext computer assisted learning material [Zhang et al, 2001]; and Mullier et al [2002] used them for identifying hypermedia browsing patterns.
2. THE NEURAL NETWORK
Developments of Adaptive Resonance Theory (ART)
Several variations of the original ART [Grossberg, 1976] have been introduced. ART1 [Carpenter and Grossberg, 1987a] self-organises recognition categories for arbitrary sequences of binary input sequences; ART2, operates on either binary or analogue inputs [Carpenter and Grossberg, 1987b]. Further development has seen the creation of ART2-A [Carpenter et al, 1991a], which is 2 or 3 orders of magnitude faster than ART2. Fuzzy ART [Carpenter et al, 1991b], incorporated computations from fuzzy set theory. Extensions to ART networks to allow supervised learning, supervised multi-layer, and self-growing systems [Palmer-Brown, 1992; Tan, 1997] have also been introduced.
Performance-guided ART (P-ART) Architecture
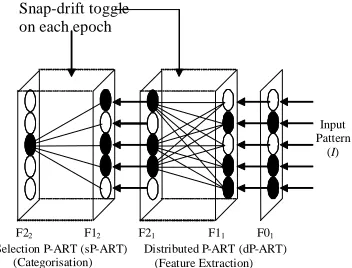
[image:3.612.342.518.71.205.2]The P-ART network is a modular, multi-layered architecture as shown in Fig. 1 [Palmer-Brown, et al 2003, Lee et al 2004].
Figure 1: P-ART Network
It is composed of 2 modules, a d-istributed, feature extraction P-ART (dP-ART) network, and categorization, classification or s-election P-ART (sP-ART). The F11↔ F21 connections of dP-ART
network and F12 ↔ F22 of sP-ART are via
weighted bottom-up and top-down connections that are modified during the learning stage. For clarity, only the connections from the F1 layer to the active (winning) F2 node in each P-ART module are shown in Fig 1.
On presentation of an input pattern at the input layer, F01, dP-ART will learn to group the input
patterns according to their general features using the novel learning principles of the snap-drift algorithm recently developed by Lee and Palmer-Brown [Lee et al, 2002, 2003, 2004]. The version used here differs in that it is fully self-organising, toggling between snap and drift learning modes on successive epochs.
The ‘Snap-Drift’ Algorithm
In an environment where new patterns are introduced over time, the learning utilises a novel snap-drift algorithm based on fast, convergent, minimalist learning (snap) and cautious learning (drift). Snap is based on a modified form of ART; and drift is based on Learning Vector Quantization (LVQ) [Kohonen, 1990]. In general terms the snap-drift algorithm is stated in equation (1).
) ( ) _ _
(Fast Learning ART LVQ
w=α +σ
(1)
In this paper,
α
andσ
are toggled between (0,1) and (1,0) at the end of each epoch. The point of this is to perform two complementary forms of feature discovery within one system. The ART style learning acquires features characterized by the intersection of patterns, whereas LVQ performsSnap-drift toggle on each epoch
Input Pattern
(I)
F22 F12 F21 F11 F01
Selection P-ART (sP-ART) (Categorisation)
I. J. of SIMULATION Vol. 6 No 9 24 ISSN 1473-804x online, 1473-8031 print clustering, discovering features that are averaged
across patterns. Thus, the dual approach of snap-drift tends to be more rapidly convergent than LVQ by itself, since ART is rapidly convergent, whilst settling on some features that LVQ alone would not find by biasing clustering/grouping towards features that are strongly present in most of the member patterns of the grouping being formed.
The Distributed P-ART (dP-ART) Learning
On presentation of an input pattern, the bottom-up activation is calculated. Then the D F21 nodes with
the highest bottom-up activation are selected.
} M ,..., 2 , 1 J | T max{
TJ = J =
(2)
D is set to 3 in this application. The three F21 nodes
learn according to equation (3), where wji= top-down weights vectors; I = binary input vectors, and β = the drift speed constant = 0.5.
)) ( ( ) ( ) ( ) ( ) ( ) ( old Ji old Ji old Ji new Ji w I w w I w − + + ∩ = β σ α (3)
When
α
=1, w updates simply to:) w I (
w Ji(old )
) new (
Ji = ∩
(4)
This invokes fast minimalist learning, causing the top-down weights to reach their new asymptote on each input presentation.
) old ( J
J I w
w → ∩
(5)
In contrast, when
σ
= 1 w is given by equation (6).)) w I ( w (
w Ji(old )
) old ( Ji ) new (
Ji = +β −
(6)
This causes a simple form of clustering or LVQ at a speed determined by β. Overallthe learning is a combination of the two forms of adaptation as the mode is toggled between snap and drift. The novel bottom-up learning of the P-ART is a normalised version of the top-down learning given in equation (7),where wiJ(new) = top-down weights of the network after learning.
| w |
w
w (new)
iJ ) new ( iJ ) new ( Ji = (7) 3. METHODOLOGY
Although the specific aim here is to provide a novel interpretation of the interaction data described, a general aim is to devise a methodology that can be applied to any ‘interaction’ or ‘user behaviour’ data, and minimises the pre-and post-processing through the definition of a structured approach. There are several considerations that need to be given to the method and the stages of transformation the data must undergo before it is suitable as an input to a NN. A generalised methodology has been developed and realised in the form of a set of procedures that embrace the following processes: (i) Pre-processing: conversion of the ‘raw user data’ into a form suitable for input to the NN; (ii) Selection of optimal NN parameters; (iii) Post-processing: manipulation of the results in order to provide a novel and intelligent analysis. Stages (i) and (ii) are summarised in relation to the network management data below and Stage (iii) is discussed in the results section.
Data Collection and Initial Assessment
There are some fundamental issues regarding the data that need to be addressed initially such as: How much data is available? Is there a constant output of data? Is there sufficient data to adequately train and test the network? The performance of a NN is dependent on the training data. The training data must be representative of the task being learnt and tends to be chosen through trial and error before finding an acceptable training data set [Callan, 1999]. The production of the network management data is on-going but for the purposes of this paper a sample has been used: 55 datasets are analysed, where a single dataset represents a trainee undertaking a one network management task. Once the data has been collected it is imperative that a certain level of understanding is reached about it in order to fully understand what is hoped to be achieved through the analysis and to enable appropriate encoding of both the components of an event and the event as a whole.
Structure and Context
The next consideration in pre-processing the data is how to structure the encoded data in order to ensure all appropriate variables contribute towards the NN’s decision making and is in a form suitable for input to a NN. The data is initially primary encoded into a list of consecutive events, where an
I. J. of SIMULATION Vol. 6 No 9 25 ISSN 1473-804x online, 1473-8031 print the relevant information. This takes the following
form:
{Action – Node Description – Duration} (8)
Action describes the command issued by the student, Node Description refers to which device the command relates to and whether it is active or inactive and Duration is the time taken to issue the command. Determining the structure of an event is the first level of encoding and the resulting event is called the primary encoded data. This process reduces the feature space and simplifies the data therefore care must be taken to ensure relevant information is not excluded.
Another consideration is how to interpret the context of the data. Although the data is in a serial format, relationships between consecutive and subsequent events may be an important factor that needs to be considered. When the NN receives an input vector, it compares it to previously stored input patterns and then either puts it into the class that most closely matches it, or if no such class exists, creates a new one. Any patterns that are being identified within the data are so across input vectors. Therefore the length and quantity of data within each input vector is extremely important. The investigation requires several stages where each stage can be described in terms of the length of the input vector, which is a multiple of events (1xEvent, 2xEvent etc.). The first stage is simply concerned with the occurrence of individual events, i.e. an input vector is equal to 1 event. Whilst this provides information on the significance of each of the different events within a network management session, no information is afforded on the context of events. The second stage of investigations tackles the contextual aspect of the data. An input vector presented to the NN comprises 2 or more consecutive events. Consecutive input vectors comprise overlapping events as illustrated in the following equation, where in represents the n-th input vector and En the n-th event. [En En+1]
represents the concatenation of 2 consecutive events.
in-1 = [En-1 En], in = [En En+1], in+1 = [En+1 En+2],
etc.
(9)
Coding the Network Management Data
Once the structure of an event has been established, each component that makes up the event can be individually coded and the coded components concatenated to form the overall input vector. It is necessary to know how many different values each
of these components may take to facilitate the implementation of an appropriate coding scheme.
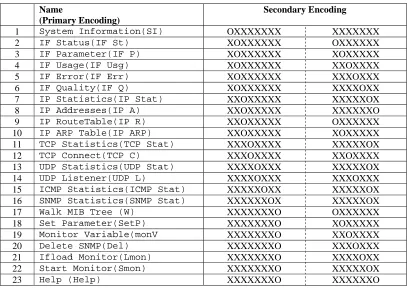
The coding scheme for the Action component is illustrated in Table 1 in terms of the possible actions, their primary encoded form, and the final coded format (‘O’ represents binary ‘1’ and ‘X’ binary ‘0’). The first segment of the codeword defines which category or layer the action belongs to, such as IP or TCP. The second segment distinguishes between the different actions within a category.
The second component of an event is the Node Description. Again, the codeword is segmented. The first part indicates whether the node is active (O) or inactive (X) and the second part is used to distinguish between the active nodes.
Finally, the third component is the Duration. This is the time stamp of the current event minus the time stamp of the previous event and is useful as it gives an indication of the time taken to execute a command. For this component a coarse coding scheme [Eurich et al, 1997] is used, where neighbouring sub-divisions are allocated codewords that differ from each other by 1 bit position. Thus, the duration difference between otherwise similar events, is reflected in the Euclidian distance between their respective patterns.
Neural Network Parameters
I. J. of SIMULATION Vol. 6 No 9 26 ISSN 1473-804x online, 1473-8031 print Table 1: Encoded Action Component of an Event
Name
(Primary Encoding)
Secondary Encoding
1 System Information(SI) OXXXXXXX XXXXXXX
2 IF Status(IF St) XOXXXXXX OXXXXXX
3 IF Parameter(IF P) XOXXXXXX XOXXXXX
4 IF Usage(IF Usg) XOXXXXXX XXOXXXX
5 IF Error(IF Err) XOXXXXXX XXXOXXX
6 IF Quality(IF Q) XOXXXXXX XXXXOXX
7 IP Statistics(IP Stat) XXOXXXXX XXXXXOX 8 IP Addresses(IP A) XXOXXXXX XXXXXXO 9 IP RouteTable(IP R) XXOXXXXX OXXXXXX 10 IP ARP Table(IP ARP) XXOXXXXX XOXXXXX 11 TCP Statistics(TCP Stat) XXXOXXXX XXXXXOX 12 TCP Connect(TCP C) XXXOXXXX XXOXXXX 13 UDP Statistics(UDP Stat) XXXXOXXX XXXXXOX 14 UDP Listener(UDP L) XXXXOXXX XXXOXXX 15 ICMP Statistics(ICMP Stat) XXXXXOXX XXXXXOX 16 SNMP Statistics(SNMP Stat) XXXXXXOX XXXXXOX
17 Walk MIB Tree (W) XXXXXXXO OXXXXXX
18 Set Parameter(SetP) XXXXXXXO XOXXXXX
19 Monitor Variable(monV XXXXXXXO XXOXXXX 20 Delete SNMP(Del) XXXXXXXO XXXOXXX 21 Ifload Monitor(Lmon) XXXXXXXO XXXXOXX 22 Start Monitor(Smon) XXXXXXXO XXXXXOX
23 Help (Help) XXXXXXXO XXXXXXO
Table 2: Encoded Node Description Component of an Event
Model Primary Encoding
Secondary Encoding
192.9.200.1 1 1 O OXXXXXXXXXXXXX
192.9.200.2 1 2 O XOXXXXXXXXXXXX
192.9.200.3 1 3 O XXOXXXXXXXXXXX
192.9.200.4 1 4 O XXXOXXXXXXXXXX
192.9.200.5 1 5 O XXXXOXXXXXXXXX
192.9.200.6 1 6 O XXXXXOXXXXXXXX
194.9.177.7 1 7 O XXXXXXOXXXXXXX
194.9.177.8 1 8 O XXXXXXXOXXXXXX
194.9.177.9 1 9 O XXXXXXXXOXXXXX
194.9.177.10 1 10 O XXXXXXXXXOXXXX
194.9.177.11 1 11 O XXXXXXXXXXOXXX
194.9.177.18 1 12 O XXXXXXXXXXXOXX
194.9.177.19 1 13 O XXXXXXXXXXXXOX
194.9.177.66 1 14 O XXXXXXXXXXXXXO
Inactive node 0 0 X XXXXXXXXXXXXXX
Table 3: Encoded Duration Component of an Event
Duration Primary Encoding Secondary Encoding
0:00:00 t0 XXXXX
0:01:08 t1 XXXXO
0:02:17 t2 XXXOO
0:03:25 t3 XXXOX
0:05:42 t5 XXOOO
…... ……. ……
I. J. of SIMULATION Vol. 6 No 9 27 ISSN 1473-804x online, 1473-8031 print
4. RESULTS
P-ART is implemented in C++. The inputs are binary vectors and the output is a corresponding column of numbers indicating the output class. A total of 2700 input vectors are input to the NN and evaluated here. Actions are referred to by number or primary encoded format. These and their basic functions are summarised in Table 4.
Firstly, it is necessary to assess the number and size of the output classes that have been formed, i.e. how many output nodes of the NN are used and how many input vectors are assigned to each of these. The results are easily rearranged, grouped and manipulated in order to make different comparisons. Results are reorganized and displayed by output node in order to visualise the input vectors grouped within each output class.
The second stage is to establish which of the classes formed are major, significant and minority classes. Major classes are the most commonly used classes, significant classes are smaller but still populated sufficiently have an impact on conclusions, whereas minority classes are those that are only used once or twice and have little impact so are disregarded. Once the results are grouped by output class the key or dominant features of each group are established. A dominant feature is defined as a feature common to over 90% of the input vectors within that class. It may take a single value or a group of values, e.g. action 1 (SI) or actions 2-6 (all IF type actions). A class maybe defined by a single dominant feature, such as an action, or by several, such as action and node. Where the dominant features are discussed the terminology {action ; node ; duration} is adopted. For example { 12 ; 1/- ; - } represents an output class where a majority of the input vectors within this class are action 12 (TCP C) implemented on an unspecific active node.
1xEvent
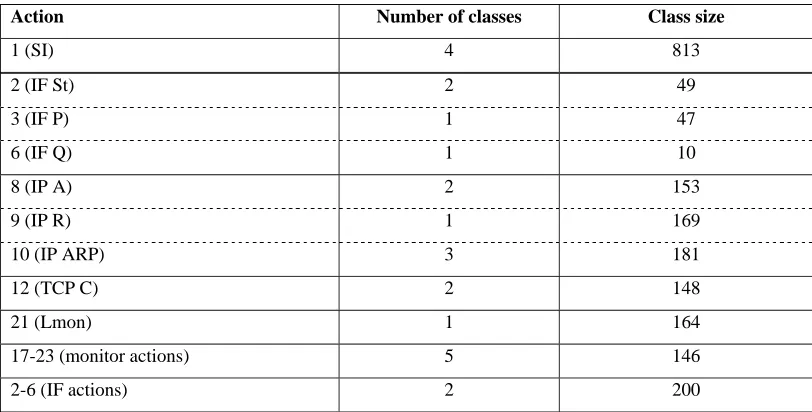
These results provide information on the significance of events. Table 5 summarises some of the classes that have an action or group of actions
as a dominant feature along with their size (combined size where more than one class exists with the same feature).
Action 1 (SI) is by far the most frequently used action. This is expected as this is the conventional method by which to obtain standard information regarding the network devices. Action 21 (Lmon) is also a common action which is also expected as this enables the monitoring of interface (network card) loads and is a common networking requirement.
In respect to types of actions, it is the IP actions that are the most commonly applied, which implies a good use of commands. IP layer actions and action 12 (TCP C) reflect requirements to determine network topology through address structure and are encouraged methods of exploration. The groups of actions that appear as dominant features, include monitoring actions, IF actions and much less commonly, actions 11-16 (TCP, UDP, ICMP and SNMP layer actions). This illustrates a much more occasional use of these types of commands compared to other layers.
Due to the way the NN has grouped certain inputs it is possible to compare classes that feature actions directed at an inactive node with those directed at active nodes. For example, the four output classes associated with action 1 (SI) are summarised in terms of their dominant features and size in Table 6.
I. J. of SIMULATION Vol. 6 No 9 28 ISSN 1473-804x online, 1473-8031 print Table 4: Summary of Actions
Primary Encoding Description of functionality
1 SI Display information of the system group
2 IF St Display information of the interfaces
3 IF P Display interface parameter like speed
4 IF Usg Display interface statistics
5 IF Err Display interface statistics
6 IF Q Show error and discard rate for each interface
7 IP Stat Display statistics and parameters of IP layer
8 IP A Show IP addresses used by this device
9 IP R Display routing table
10 IP ARP Display other devices its been in contact with
11 TCP Stat Display statistics and parameters of TCP layer
12 TCP C Display status of existing TCP connections
13 UDP Stat Display statistics and parameters of UDP layer
14 UDP L Display status of existing USP listener 15 ICMP Stat Display stats and parameters of ICMP layer
16 SNMP Stat Display stats and parameters of SNMP layer
17 W Walk through MIB tree and print object values
18 SetP Set SNMP parameters
19 monV Monitor an SNMP variable in a stripchart
20 Del Delete the monitoring proceess
21 Lmon Set up monitoring process
22 Smon Start monitoring process
[image:8.612.102.508.385.591.2]23 Help List choice of actions
Table 5: Dominant Features for 1xEvent Results
Action Number of classes Class size
1 (SI) 4 813
2 (IF St) 2 49
3 (IF P) 1 47
6 (IF Q) 1 10
8 (IP A) 2 153
9 (IP R) 1 169
10 (IP ARP) 3 181
12 (TCP C) 2 148
21 (Lmon) 1 164
17-23 (monitor actions) 5 146
2-6 (IF actions) 2 200
Table 6: Major Output Classes Featuring ‘SI’
Output Class
Dominant Features Class Size
5 { 1 ; 1/9 ; 1-5 } 64
14 { 1 ; 0/0 ; 1 } 215
16 { 1 ; 1/- ; 1-7 } 455
I. J. of SIMULATION Vol. 6 No 9 29 ISSN 1473-804x online, 1473-8031 print
2xEvent and 3xEvent
Where as the 1xEvent results are useful to determine the frequency of specific events, the 2xEvent and 3xEvent results can be used to identify relationships between consecutive events.
A strong relationship exists between action 1 (SI), and the monitoring actions. Several output classes (combined size of 241) have been created that illustrate this action both preceding and following a monitoring action.
Another interesting observation is the formation of several output classes that feature inactive nodes as dominant features in consecutive events. For the 2xEvent results, four output classes are formed that feature an inactive node in both events. One of these is a major class (size 105) and contains instances when the SI command is repeatedly implemented on an inactive node. This behaviour implies an ineffective use of the SI command, both due to its repetition and it being directed at an inactive node. Major classes where inactive nodes appear as dominant features in both events of an episode make up 7% of the overall major classes for the 2xEvent results. Extending this investigation to the 3xEvent results to determine how common it is that three consecutive events feature an inactive node, it is seen that four classes are formed. One is of a significant size (33) and again shows repeated use of the SI command on an inactive node.
As expected from the 1xEvent results, the SI command features most prominently. For the 2xEvent results it is a dominant feature of four out of the fourteen major classes (45%) and is a dominant feature of both events in three of these.
For the 3xEvent results, many of the classes formed are not defined by multiple specific dominant features. This is because although the input vector length has increased the vigilance parameter has remained the same in order to encourage a more generalised clustering of the input patterns.
One interesting result is the output classes that highlight events that follow action 1 (SI) – i.e. what the trainee manager does once basic system information has been obtained. The most popular course of action following SI is a repetition of the same action (combined size 165). The network management simulator has a functionality that allows the selection of multiple nodes and the application of a single action to each of the nodes selected. Whilst this feature exists, it is not an efficient method for collating information on the network as redundant information is gathered and therefore has implications on the bandwidth
required due to unnecessary network traffic being generated. The output classes discussed here, with the repetition of the command over 3 consecutive events, implies the use of this simulator feature, which in turn implies lack of consideration of the way in which the exploration of the network is conducted. In comparison, the preferred course of action to follow the SI action is the use of IP layer commands to provide a more thorough and yet directed interrogation of network devices. This does appear as a dominant feature, but less frequently than the repeated use of SI (combined size 49).
5. CONCLUSIONS
A methodology has been devised and a neural network architecture developed that provides a platform from which the analysis of different types of user behaviour or interaction data can be performed. The methodology provides a technique that minimises the complexity of the task by means of a structured approach to both the pre-processing of the user interaction data and interpretation of the results.
A novel method for the analysis of interactions between a network manager and a network management training platform has been presented. The method can be used to uncover hidden patterns in user behaviour and therefore provide novel insights into that behaviour.
The output classes formed by the NN can be used to compare instances of good and bad practice and reveal patterns embedded within the data that are difficult to recognize through other methods. The results identified both commonly occurring combinations of events and other interesting, though less common, sequences of events. Whilst a great deal of information has been accumulated in relation to the commands or actions performed by the network manager as well as the nodes within the network that these actions are directed towards, little information has been gleaned on the duration of these events. A reason for this may be that a large proportion of the durations fall within the first few increments of the overall range of values (i.e. t0 and t1). It may therefore be beneficial to
modify the input coding scheme applied to this component of an event to allow it to be more influential in the forming of the output classes.
I. J. of SIMULATION Vol. 6 No 9 30 ISSN 1473-804x online, 1473-8031 print It is also intended to develop an on-line feedback
system that responds to real-time operation of the simulated network with critiques in response to the approaches chosen by the trainee network manager. The overall project can be broken down into three stages, as illustrated in Figure 3. Stage I has been described here, along with an initial attempt at stage II. Planned stages include development of integrated post-processing operations to enable automated definition of the dominant features of the clusters formed, including equation synthesis based on the weights [Roadknight et al 1997] and event sequence recognition, which is analogous to phrase recognition in natural language, which has previously been tackled with simple recurrent neural networks [Palmer-Brown et al, 2002]. The algorithms will be developed to allow analyst influence on the type of clusters or groupings being
formed (Stage II), possibly using reinforcement learning based on performance feedback, which has already been developed with snap-drift [Palmer-Brown et al 2003].The eventual aim is to develop and integrate a real-time system to provide informative feedback to the user of the Network Management Simulator (trainee), as part of the on-line tutoring, to support and enhance learning and teaching strategies within the training tool (Stage III). The feedback system would respond to real-time operation of the simulated network with advice in response to the approaches chosen by the trainee network manager. An example would be for the system to respond to the excessive use of the SI command with “The recommended course of action following SI is the use of IP layer commands to provide a more thorough and directed interrogation of network devices.”
Figure 3: Developmental Stages of the Project
6. REFERENCES
Callan R. 1999, “The Essence of Neural Networks”. Prentice Hall, Europe.
Carpenter G.A. and Grossberg S. 1987, “A Massively Parallel Architecture for a Self-Organising Neural Pattern Recognition Machine,”
Computer Vision, Graphics and Image Processing, Vol. 37. Pp54-115.
Carpenter G.A. and Grossberg S. 1987, “ART2: Self-Organization of Stable Category Recognition
Codes for Analogue Pattern”. Applied Optics, Vol. 26. Pp4919 -4930.
Carpenter G.A., Grossberg S. and Rosen D.B. 1991, “ART 2-A: An Adaptive Resonance Algorithm for Rapid Category Learning and Recognition”. Neural Networks, Vol. 4. Pp493-504.
Neural Network for pattern recognition and
classification
Analysis of Results
Development of adaptive algorithms Development of real-time, on-line feedback Network
Management Training Tool
Production of data describing trainee's interaction with training tool
Modular neural network architecture, using novel learning algorithms
Develop algorithms in NN to automate feature definition and
allow external influence of cluster
formation Integrated software
on NM platform to identify pre-defined patterns of interest and provide on-line feedback to user Stage I
I. J. of SIMULATION Vol. 6 No 9 31 ISSN 1473-804x online, 1473-8031 print Carpenter G.A., Grossberg S. and Rosen D.B.
1991, “Fuzzy ART: Fast Stable Learning and Categorization of Analogue Pattern by an Adaptive Resonance System”. Neural Networks, Vol. 4. Pp759 - 771.
Eurich C.W., Schwegler H. and Woesler R. 1997, “Coarse Coding: Applications to the Visual System of Salamanders”. Biol. Cybern., Vol. 77. Pp41-47.
Grossberg S. 1976, “Adaptive Pattern Classification and Universal Recoding. I. Parallel Development and Coding of Neural Feature Detectors”. Biol. Cybern., Vol. 23. Pp121 - 134.
Kohonen T. 1990, “Improved versions of learning vector quantization”. In Proceedings of Int. Joint Conf. Neural Networks, Vol. 1. Pp545-550.
Lee S.W., Palmer-Brown D., Tepper J. and Roadknight C. 2002, “Performance-guided Neural Network for Rapidly Self-Organising Active
Network Management”. In Soft Computing
Systems: Design Management and Applications, A. Abraham et al (Eds.), IOS Press. Pp22-31.
Lee S.W., Palmer-Brown D., Tepper J. and Roadknight C. 2003, “Snap-Drift: Real-time Performance-guided Learning”. in Proceedings of Int. Joint Conf. Neural Networks, Vo1. 2. Pp1412 – 1416.
Lee S.W., Palmer-Brown D. and Roadknight C. 2004, “Performance-guided Neural Network for Rapidly Self-Organising Active Network Management”. Neurocomputing, 61C. Pp5 - 20.
Miles M.B. and Huberman A.M. 1994, “Qualitative Data Analysis”, Second Edition. SAGE Publications.
Mullier D.J., Hobbs D.J. and Moore D.J. 2002, “Identifying and Using Hypermedia Browsing Patterns”. Journal of Educational Multimedia and Hypermedia, No.11 (1). Pp31-50.
Palmer-Brown D. 1992, “High Speed Learning in a Supervised, Self Growing Net”. In Proc. of Int. Conf. on Artificial Neural Networks, Vol. 2, 1159-1162.
Palmer-Brown D., Lee S.W., Tepper J. and Roadknight C.M. 2003, “Fast Learning Neural Nets with Adaptive Learning Styles”. In Proc. of the 17th European Simulation Multiconference.
(ESM2003). Pp118 – 123.
Palmer-Brown D., Tepper J. and Powell H. 2002, “Connectionist Natural Language Parsing”, Trends in Cognitive Sciences, 6(10).
Pattinson C. 2000, “A simulated network
management information base”. Journal of
Network and Computer Applications, 23. Pp93-701.
Roadknight C.M., Balls G., Mills G. and
Palmer-Brown D. 1997, “Modelling Complex
Environmental Data”, IEEE Transactions on Neural Networks, 8(4).
Shalvi D. and DeClaris N. 1998, “An Unsupervised Neural Network Approach to Medical Data Mining Techniques”. In Proc. of IEEE Int. Joint Conf. Neural Networks. Pp171-176.
Tan A.H. 1997, “Cascade ARTMAP: Integrating Neural Computation and Symbolic Knowledge Processing”. IEEE Trans. Neural Networks, Vol. 8, No. 2. 237 – 250.
Zhang S., Powell H. and Palmer-Brown D. 2001, “Methods for Concept Extraction using ANNs and Stemming Analysis and Their Portability Across
Domains”. In Proc. of the 2nd Workshop on
Natural Language Processing and Neural Network
(Tokyo, Japan). Pp62 - 79.
7. BIOGRAPHY
I. J. of SIMULATION Vol. 6 No 9 32 ISSN 1473-804x online, 1473-8031 print COLIN PATTINSON is a Principal
Lecturer in Computer Communications, and leads the Computer Communications Research Group at the School of Computing, Leeds Metropolitan University, Leeds, UK, and is the School’s research manager. He received the B.Sc. degree in Computational Science from the University of Leeds in 1982, and the Ph.D., also from the University of Leeds in 1986. His research interests include the use and development of network management systems and network performance issues. He is currently involved in teaching a variety of computer network-related modules at B.Sc. and M.Sc. levels, and is also supervising four doctorate students. His major research interest has been in developing a network management training system, using simulation to represent the behaviour of a network, and has presented this work at conferences and seminars in Australia, Spain, Turkey and Germany. It was recently profiled in the 9th September 2003 issue of the computer trade periodical Computer Weekly.
DOMINIC PALMER-BROWN is
professor of neurocomputing and Associate Head, School of Computing and Technology, University of East London, UK. In recent years, he has maintained research links with a number of organisations, including British Telecom Research Labs, The Centre for Ecology and Hydrology, and several universities. A key focus of his research is neurocomputing and related methods of adaptation and learning in cognitive science, intelligent data analysis, and pattern recognition. Dominic has published about 60 international conference and journal papers and supervised 12 PhDs, since completing his own PhD on an adaptive resonance classifier in 1991. His interests have principally concerned supervised and performance-guided ART, enhanced MLPs for intelligent data analysis, and architectures incorporating MLPs and SRNs for thematic knowledge extraction and natural language processing. He was editor of the review journal Trends in Cognitive Sciences during 2000-2 before rejoining Leeds Metropolitan University. In 2005 he was appointed to his present post.