Study of frequency selective surfaces on radar cross section reduction
7
0
0
Full text
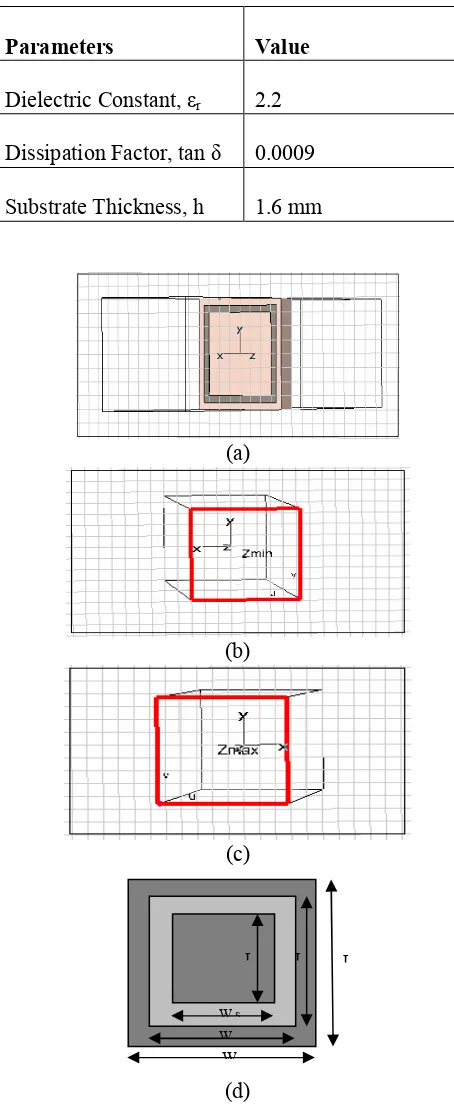
(2) International Journal of Integrated Engineering (Issue on Electrical and Electronic Engineering). 2. FSS DESIGN SPECIFICATIONS. 1. INTRODUCTION The use of the radar cross section reduction, RCSR [1] is one of the techniques that can reduce radar cross section, RCS. The most common technique that had been used is shaping of the periodic structure [2]. Although the shaping of the periodic structure can be used to reduce the RCS by minimizing the area presented of the radar but it also has significant disadvantages. In this study, frequency selective surfaces, FSS are proposed in order to minimize the radar cross section which can offer a significant improvement in the radar cross section technology. The structure of the frequency selective surface consists of the periodic array of dipole slots with the non-metallic ground plane [3]. By applying FSS technique, the transmission and reflection properties of FSS array can be achieved and the possibility of reducing radar cross section has been investigated. The main objectives of this study are to minimize the radar cross section by applying frequency selective surface technique and to observe the relationship between the angle of incidence and the transmission/reflection coefficient due to radar cross section reduction. While varying the incidence angles, there have the change in frequency and reflection/transmission plot. As the incidence angles increased, the resonance frequency has been increased and transmitted signal is getting higher. Based on the value of reflection/transmission properties, the radar cross section has been calculated using equation 1.1 [4]:. Slot Patch Substrate h. ε. Fig. 2.1: Structure of dielectric substrate. Table 2.1: Substrate (Rogers RT5880) Specifications.. Parameters. Value. Dielectric Constant, εr. 2.2. Dissipation Factor, tan δ. 0.0009. Substrate Thickness, h. 1.6 mm. (a). (b) where. Prt = Received power Prs = Return signal Strength A = Area of the flat plate, m2 σ = Radar cross section, dBm2. (c). L. Ws W. W. (d). L. L.
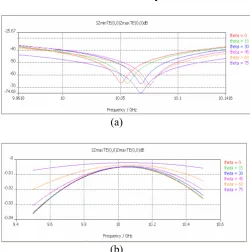
(3) International Journal of Integrated Engineering (Issue on Electrical and Electronic Engineering). Fig. 2.2 Geometry structure of the frequency selective surface using (a) CST Microwave Studio (c) Zmin port excitation (c) Zmax port excitation (d) theoretical design.. A single layer FSS array as shown in Fig. 2.2 (a) has been simulated in the CST Computer Software at the X-Band frequency range. The FSS array has been designed using Rogers RT5880 as the substrate materials which dielectric constant is 2.2 and the dissipation factor is 0.0009. With the dimensions of the substrate elements is 4 mm length and 4 mm width, patch element is 3.5 mm length and 3.5 mm width and the slot element is 3 mm length and 3 mm width, the FSS array has been simulated in order to obtain the minimum reflection.. Zmax to port Zmax. The FSS array design has been integrated to reduce the radar cross section as shown in fig. 2.3. 3. RESULTS & ANALYSIS 3.1 Effect of Varying Angles of Incidence to the Transmission and Reflection Response.. Table 2.2 : Design Specifications of Frequency Selective Surfaces.. Substrate Patch Slot. L 4mm Lp 3.5mm Ls 3mm. (a). W 4mm Wp 3.5mm Ws 3mm INTEGRATED. (b) Fig. 3.1: Simulated Result of the (a) Reflection and (b) Transmission Response by varying Angles of Incidence.. FSS. CST. MATLA. Call via command line Export data by ASCII Code. RCS. MATLA. EXCEL. Call via command line option. Fig. 2.3 Flow of the FSS array study on the RCS Reduction.. In this study, simulated results have been carried out using the CST computer software which gives better performance on simulating the FSS array. Fig. 3.1 (a) and (b) shows the performance of the reflection/transmission and resonance frequency as the incidence angles have been varied from 0 to 75 degrees. The change in resonant frequency occurred because of the resonance frequency is not strongly dependent on the angles of incidence [5]. Table 3.1: Simulated Value of the Resonant Frequency and S11 and S21 curve by varying the Incidence Angles.. Theta, θ Frequency, (degree) GHz (a) (b) Fig. 2.4: (a) Surface current distribution (b) E-field intensity on the patch elements at theta = 75 degree.. Fig. 2.2 (b) and (c) shows the Zmin and Zmax port excitation during the simulation on the reflection/transmission response. Minimum reflection was excited from port Zmin to port Zmax while maximum transmission was excited from port. 0 15 30 45 60 75. 10.0500 10.0566 10.0679 10.0760 10.0746 10.0680. S11 curve, dB -66.46 -66.63 -67.04 -67.87 -69.73 -74.68. S21 dB. curve,. -0.004856 -0.004837 -0.004717 -0.004329 -0.003442 -0.001965.
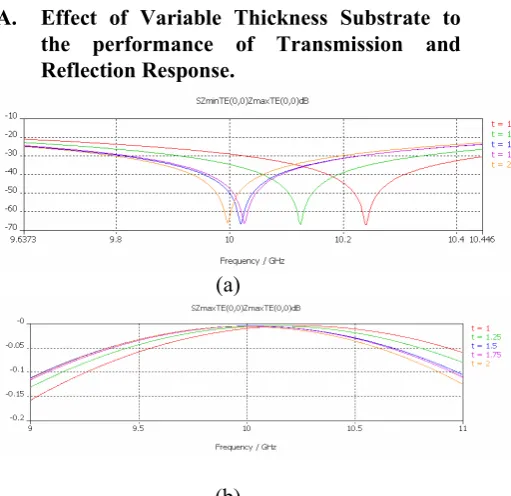
(4) International Journal of Integrated Engineering (Issue on Electrical and Electronic Engineering). The performance of the reflection response can be minimized due to the decreasing of the incidences angles as shown in table 3.1. The minimum reflection response occurred when the angles of incidence is equal to 75 degree which is -74.68 dB. While, for the transmission response, the RCS can be reduced as the transmitted signal is higher than the reflected signal and the maximum transmitted signal occurred when the incidence angle at 75 degree which is equal to -0.001965 dB. From the table 3.1, it shows that in order to reduce RCS, the best performance is occurred at the oblique angles of incidence [6]. Moreover, the minimum RCS at 75 degree’s incidence angles can be proved by referring to the Fig. 2.4. It shows that, the surface current distribution on the patch elements is lower which almost 0 A/m. While for the electric field components, it can be observed that the electric field intensity is lower due to the patch elements. Because of the electric field intensity (V/m) is proportional with the volume current density, thus the volume current density (A/m2) on the patch elements is lower and the minimum reflection can be obtained. A.. Effect of Variable Thickness Substrate to the performance of Transmission and Reflection Response.. material [7]. Substrate thicknesses are indeed an important consideration in designing the FSS array. Table 3.2: Simulated Value of the Resonant Frequency, S11 and S21 curve using Different Substrate Thicknesses. Thickness, mm. Frequency, GHz. 1 1.25 1.5 1.75 2. 10.24 10.13 10.02 10.01 9.998. S11 curve, dB -66.74 -66.68 -65.58 -66.09 -65.23. S21 curve, dB -0.003953 -0.004280 -0.004651 -0.005127 -0.005688. During the simulation, the substrate thickness is varied from 1 mm to 2 mm. By increasing the substrate thickness, the resonant frequency and the transmission response are decreased but the reflection response has been increased. In order to reduce RCS, the minimum reflection response occurred when the substrate thickness is equal to 1 mm which is equal to -66.74 dB. While for the transmission response, the signal is transmit more when the substrate thickness is equal 1 mm. The detail results were shown in table 3.2. The best performance due to reduce the RCS is observed at 10.24 GHz of the resonance frequency and the substrate thickness is equal to 1mm. The performance of the substrate thickness is better when the thinner substrate material is used because of the of the radiation loss through the substrate materials. The lowest radiation loss has been occurred as the substrate material has been decreased [8]. B.. Integration Workflow from MATLAB to CST Computer Model.. (a). INTEGRATED COM MATLAB. CST MWS Call via command line option. (b) Fig. 3.2 Reflection and Transmission Response of the FSS array for Different Substrate Thicknesses.. Both of Fig. 3.2 (a) and (b) are the simulation results that had been carried out from the CST computer model using different thickness of the substrate. Fig. 3.3: Integration Workflow between MATLAB and CST Computer Model.. Fig. 3.3 shows the workflow how the interface between MATLAB and CST computer model has been done using command line option in the MATLAB. The command line writing in the MFile Editor has been called the CST computer model and the interfaces between both of the computer.
(5) International Journal of Integrated Engineering (Issue on Electrical and Electronic Engineering). model have been successes. By using the Computer Object Model (COM), it enables the interaction between MATLAB and CST computer software. The main command that had been used to call the CST computer model is actxserver and this command act to create the COM server and returns the COM object. The object that is return by the actxserver is the CST computer model. In the CST computer model, the transmission/reflection plots have been displayed. C. Integration Workflow from CST Computer Software to MATLAB. INTEGRATED. CST MWS. EXCEL. Export data by ASCII Code. MATLAB. (a). Call via command line option. Fig. 3.4: Flow of the integration between CST MWS and MATLAB.. Fig. 3.4 above shows the integration workflow in order to get the transmission and reflection response in the MATLAB. From the CST MWS, the transmission and reflection response were exported using the ASCII code to the EXCEL computer software. From EXCEL computer software, by using the load command written in the MATLAB’s M-File Editor, the data in the EXCEL computer software have been call and the transmission and reflection plot have been displayed in the MATLAB computer software. Fig. 3.5 (a) show the transmission and reflection response when the incidence angle had been varied while Fig. 3.5 (b) showed the transmission and reflection plot for different substrate thickness. It shows that the reflection and transmission plots observed in the MATLAB computer software were quite similar with the CST computer software. From fig. 3.6 (a) and (b), the results show that the value of the resonant frequency and reflection response at the 75 degree’s incidence angles is quite similar between each other. From the CST MWS, the resonance frequency is equal to 10.068 GHz while from the MATLAB 7 the resonance frequency is equal to 10.07.. (b) Fig. 3.5 (a) Reflection and Transmission plot by varying the Incidence Angles (b) Transmission and Reflection plot for Different Substrate Thicknesses generated from MATLAB 7.. D. Comparison on Reflection Response using CST MWS and MATLAB.. For the reflection plot, the value that has been carried out from CST MWS is equal to -74.68 dB while from MATLAB 7 is equal to -74.68 dB. From the results above, it shows that, CST MWS can be integrating between MATLAB in order to get the transmission/reflection response of the FSSs design..
(6) International Journal of Integrated Engineering (Issue on Electrical and Electronic Engineering). Table 3.3: Calculated value of RCS using MATLAB computer software.. Theta, (degree) 0 15 30 45 60 75. (a). 10.05 10.06 10.07 10.08 10.07 10.07. RCS, dBm2 -4417 -4429 -4447 -4607 -4854 -5577. Based on the results that have been shown in Fig. 3.7 and Table 3.3, maximum RCS occurs when the incident signal and observer is located at the normal incidence (theta = 0 degree) [9]. While for the oblique angles of incidence, the RCS have been reduced until the lowest RCS which is equal to 75 degree. At the 75 degree’s incidence angles, the value of RCS is equal to -5577 dBm2 which is the minimum value of RCS from the minimum value of reflection response. Therefore, in order to reduce the RCS, the incident signal must be transmitted at the oblique angles of incidence which were equal to 15o, 30o,45o, 60o and 75o. The best performance in reducing RCS occurred at 75 degree’s incidence angles.. (b) Fig. 3.6: Reflection Response for theta = 75 degree using (a) CST MWS and (b) MATLAB 7.. E. Radar Cross Section Reduction. i). θ Frequency, GHz. Effect of Different Incidence Angles on theii) Radar Cross Section.. F. Effect of Different Substrate Thicknesses on the Radar Cross Section.. Radar Cross Section By Varying Angle Of Incidence. Radar Cross Section By Varying The Substrate Thickness. 0. 0. theta = 0 theta = 15 theta = 30 theta = 45 theta = 60 theta = 75. -1000. t=1 t = 1.25 t = 1.5 t = 1.75 t=2. -500. -1000 -2000. -3000. R C S (d B m 2 ). R C S (d B m 2 ). -1500. -2000. -2500. -4000. -3000. -5000. -3500. -6000 9.5. -4000 9.6. 9.7. 9.8. 9.9. 10 Frequency(GHz). 10.1. 10.2. 10.3. 10.4. 10.5. -4500. Fig. 3.7: Plot of radar cross section based on different angles of incidence.. Radar cross section is dependent on the direction where the energy is illuminates. And it has been proved based on the simulated results that, the RCS value is maximized when the angle of incidence is equal to zero degree.. 9. 9.2. 9.4. 9.6. 9.8. 10 Frequency(GHz). 10.2. 10.4. 10.6. 10.8. 11. Fig. 3.8: Plot of radar cross section based on different substrate thicknesses.. Fig. 3.8 and Table 3.4 show the simulated results based on the MATLAB’s calculation. From the results above, it can be concluded that, the value of RCS is not really dependent on the substrate thickness..
(7) International Journal of Integrated Engineering (Issue on Electrical and Electronic Engineering). Table 3.4: Calculated value of RCS by using MATLAB computer model.. Thickness, mm 1 1.25 1.5 1.75 2. Frequency, GHz 10.24 10.13 10.02 10.01 9.996. RCS, dBm2 -4424 -4446 -4424 -4388 -4351. The RCS’s value is not stable due the change of the substrate thickness. Due to the theoretical study, the RCS is dependent on the shape, material composition, size of the body and frequency of the incident electromagnetic wave [10]. 4. CONCLUSION In this study, design of frequency selective surfaces, FSS with analysis the different angles of incidence and thickness have been demonstrated using CST computer model in order to reduce the RCS. The interfaces between MATLAB and CST computer model have been developed to see the reliability of the two computer models. Based on the transmission and reflection responses for different incidence angles and substrate thicknesses, the minimized values of RCS have been presented. There are limitations due to computer model while doing the integration between CST 2009 and MATLAB 7. ACKNOLEDGEMENT Thanks to technical help from RF and Microwave Laboratories during the implementation of the project.. REFERENCES [1] David C.Jenn.Naval Postgraduate School. “Radar Cross Section.” RF and Microwave Encyclopedia. Volume 5. MC Graw Hill. pp. 4036. [2] David C.Jenn.Naval Postgraduate School. “Radar Cross Section.” RF and Microwave Encyclopedia. Volume 5. MC Graw Hill. pp. 4036-4037. [3] Wenfei Hu, Raymond Dickie, Robert Cahill, Harold Gambler, Yusof Ismail, Vincent Fusco, David Linton, Norman Grant, Simon Rea. ‘‘Liquid Crystal Tunable mm Wave Frequency Selective Surface’’, IEEE MICROWAVE AND WIRELESS COMPONENTS LETTERS, Vol. 17, No. 9, Sepetember 2007. pp. 667-669.. [4] Annapurna Das, Sisir K Das (2001). “Microwave Engineering” MC Graw Hill. pp. 507-509. [5] Kamal Sarabandi and Nader Behdad “A Frequency Selective Surfaces with Miniaturized Elements”, IEEE TRANSACTIONS OF ANTENNAS AND PROPAGATIONS, Vol. 55, No. 5, May 2007. pp. 1239-1245. [6] Ghaffer I.Kiani, Kenneth L.Ford, Karu P.Esselle, Andrew R.Wiley, and Chinthana J. Panagamuwa “Oblique Incidence Performance of a Novel Frequency Selective Surface Absorber”, IEEE TRANSACTIONS OF ANTENNAS AND PROPAGATIONS, Vol. 55, No. 10, October 2007. pp. 2931-2934. [7] Guo Qing Luo, Wei Hong, Zhang-Cheng Hao, Bing Liu, Wei Dong Li, Ji Xin Chen, Hou Xing Zhou and Ken Wu “ Theory and Experiment of Novel Frequency Selective Surface based on Substrate Integrated Waveguide Technology”, IEEE TRANSACTIONS OF ANTENNAS AND PROPAGATIONS, Vol. 53, No. 12, December 2005. pp. 4035-4043. [8] Annapurna Das, Sisir K Das (2001). “Microwave Engineering” MC Graw Hill. pp. 63-64. [9] David C.Jenn.Naval Postgraduate School. “Radar Cross Section.” RF and Microwave Encyclopedia. Volume 5. MC Graw Hill. pp. 4036. [10] David C.Jenn.Naval Postgraduate School. “Radar Cross Section.” RF and Microwave Encyclopedia. Volume 5. MC Graw Hill. pp. 4031..
(8)
Figure

+2

Related documents
[3] Hasan Yildirim* & Baris Altun; Usage of Molasses in Concrete as A Water Reducing and Retarding Admixture; Material Science Division, Faculty of Civil
Information content and task performance: A study of older Information content and task performance: A study of older workers.. Hatem
The paper also offers a better understanding of security objectives and finally it offers an analysis and categorizes the attacks based on security goals into
The purpose of this study is to explore the relationship between of self-directed learning and employees’ perceptions of Senge’s (1990) five learning
The concrete cylindrical specimens were subjected to several tests : compression and splitting tensile tests, measurement of modulus of elasticity, heating – cooling
Since these two groups are now being produced a t different seasons of the year, due to the greater rapidity with which the controls breed, we sought to ascertain just
‘‘Wild type’’ is a wild-type silkworm breed (7532); ‘‘wild type- left,’’ refers to the left wing, and ‘‘wild type-right’’ to the right wing of the wild-type silkmoth whose
A visual surveillance system is considered as an important part of human action recognition. Recognizing human action is an integral part of Computer vision application.
