A Control Strategy for Smoothing Active Power
Fluctuation of Wind Farm with Flywheel Energy Storage
System Based on Improved Wind Power Prediction
Algorithm
*
J. C. Wang, X. R. Wang#
School of Electrical Engineering, Southwest Jiaotong University, Chengdu, China Email: *[email protected]
Received March, 2013
ABSTRACT
The fluctuation of active power output of wind farm has many negative impacts on large-scale wind power integration into power grid. In this paper, flywheel energy storage system (FESS) was connected to AC side of the doubly-fed in-duction generator (DFIG) wind farm to realize smooth control of wind power output. Based on improved wind power prediction algorithm and wind speed-power curve modeling, a new smooth control strategy with the FESS was pro-posed. The requirement of power system dispatch for wind power prediction and flywheel rotor speed limit were taken into consideration during the process. While smoothing the wind power fluctuation, FESS can track short-term planned output of wind farm. It was demonstrated by quantitative analysis of simulation results that the proposed control strat-egy can smooth the active power fluctuation of wind farm effectively and thereby improve power quality of the power grid.
Keywords: Wind Power Generation; FESS; Wind Power Prediction; Improved Time-series Algorithm; Active Power Smooth Control
1. Introduction
With large-scale wind power integration into grid, the fluctuation of active power output of wind farm has turned the operation and control of power system much more difficult [1]. It’s shown by researches that the wind power fluctuation of various time scales will have dif-ferent impacts on difdif-ferent aspects of power system, such as power quality, system reserve capacity, energy dis-patching, etc. [2, 3]. Therefore, the study on smooth con-trol of active power of wind farm contributes to improve the power supply reliability of wind power integration and the level of accepting large-scale wind power by system [4].
As an effective measure to smooth the fluctuation of wind power, energy storage technology has drawn more and more attention [5]. Making the output active power of wind turbine to track given smooth power curve by controlling generator speed and pitch would reduce wind energy utilization efficiency [6, 7]. Instead, energy stor-age device doesn’t have such a weakness. In references
[8, 9], the Battery Energy Storage System (BESS) has smoothed the wind power fluctuation. However, the BESS has some shortcomings, such as high cost, heavy environmental pollution and high period maintenance expense etc. [3, 10]. By contrast, flywheel energy storage system (FESS) is features with rapid charging and dis-charging, long periodic service life and environmental pollution free, which is applicable to smooth short-term wind power fluctuation [11]. In reference [12, 13], FESS is used to realize smooth control over active power out-put of wind farm. A FESS is designed and a reference power calculation method based on filter is studied to determine the operation state of the FESS in reference [13]. However, in these control methods, the role of FESS to track planned output of wind power has not been taken into consideration and corresponding control strategies are seldom discussed in research.
This paper proposed a new FESS control strategy ap-plicable to smooth short-term wind power fluctuation on the platform of doubly-fed induction generator (DFIG) and FESS power generation system. Reference power of FESS is given based on improved ultrashort-term wind power prediction algorithm and power curve modeling.
The energy storage system can track short-term planned output power of wind farm and smooth the wind power fluctuation simultaneously. A simulation system referred to reference [13] was established on the Matlab/Simulink for analysis, which proved the correctness and effective-ness of the proposed smooth control strategy.
2. Power Generation System with FESS
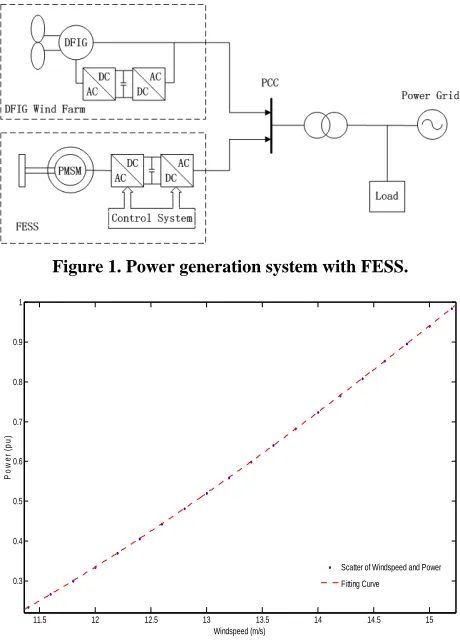
Refer to Figure 1 for the structure of power generation system with FESS [14]. The system is composed of DFIGwind farm, synchronous generator (power grid) as well as load and FESS. FESS is connected to AC side of the wind farm converter. The FESS contains drive motor, flywheel rotor, bearing support system, converters, etc. High-speed permanent magnet synchronous motor (PMSM) is adopted as drive motor for FESS to ensure wide speed range and rapid dynamic response. Flywheel rotor acceleration to charge and its deceleration to dis-charge can be realized by controlling the PMSM. Thus, mutual transfer between electric energy and mechanical energy can be achieved. Converters of both the FESS and the DFIG can be controlled to implement maximum power point tracking (MPPT) of the wind turbine and smooth the output power of wind farm to some extent.
3. Active Power Smooth Control
3.1. Wind Power Prediction Algorithm
The smooth control strategy is based on ultrashort-term wind power prediction algorithm. FESS is used to track the predicted wind power [15] and to smooth the high frequent and irregular output power fluctuation. The ul-trashort-term wind power prediction algorithm mainly includes persistence approach [16], time-series algorithm [17], wind speed–power curve modeling [18], etc. Time- series algorithm was used in this paper to predict wind speed, owning to the persistence of wind speed and other atmospheric conditions within a short period [16] and fewer input parameters necessary for time-series algo-rithm. Then, in accordance with the relationship between actual wind power and corresponding sequential wind speed, a model was built to convert predicted wind speed into predicted wind power.
Refer to the following for the process of wind speed prediction algorithm.
Step1. Wind speed from supervisory control and data acquisition (SCADA) of wind farm is used as input. Step-length sequential wind speed before current time t is read as input and stored in the data structure of Map.
( ) v t
Step2. Initialize weight parameters and learning rate with least square method; normalize data in Map.
Step3. Predict wind speed at time t+1 with time-series algorithm and reverse normalize results.
Step4. Update weights; t = t+1.
If multistep prediction is processed, the predicted wind speed at time t+i shall be used as actual wind speed at time t+i for input to obtain the predicted wind speed of i-length after time t.
From the perspective of overall property, the power characteristic piecewise function for wind turbine in ref-erence [19] can be simplified as Equation (1):
( ), 0 ( )
0,
cut off
cut off
f v v v
P v
v v
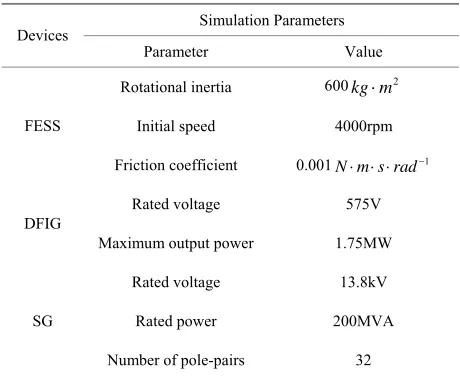
(1) Wind Power characteristic curve is when actual wind speed is between 0 and cut-out wind speed. can be fitted through scatter diagram of actual wind power and corresponding sequential wind speed. Trust region method based on nonlinear minimization is used for curve fitting. Figure 2 ( section) is shown the scatter points of actual wind speed and power as well as the fitting curve of a typical DFIG (Rated capacity 1.5MW and rated wind speed 15m/s).
( ) f v
( ) f v
( ) f v
The fitted function is Equation (2):
3 2
( ) -0.0007723 0.0391 - 0.4298 1.197
f v v v v (2)
[image:2.595.308.538.401.723.2]Residual sum of squares (RSS), R-square, adjusted R-square, and root-mean-square error (RMSE) are intro-duced as indexes for evaluating curve fitting effect [18].
Figure 1. Power generation system with FESS.
11.5 12 12.5 13 13.5 14 14.5 15 0.3
0.4 0.5 0.6 0.7 0.8 0.9 1
Windspeed (m/s)
P
o
w
e
r (p
u
)
Scatter of Windspeed and Power Fitting Curve
[image:2.595.307.540.401.522.2]RSS = 6.418, R-square = 0.9774, Adjusted R-square = 0.9771, RMSE = 0.2119. The closer RSS and RMSE to 0 and R-square and adjusted R-square to 1, the better the curve fitting effect will be. Therefore, it can be seen that the simplified model can fit wind speed–power scatter favorably, converting predicted wind speed to predicted power of wind turbine.
Consider the complicated real-time dispatching of wind farm, the following improvements have been made based on the aforementioned ultrashort-term prediction algorithm.
1) Simulate a stop command when the wind turbine is under overhaul condition. If this command works, no ultrashort-term prediction will be carried out.
2) Suppose that the real-time power of wind turbine at current time t is 0 and the planned stop time is t2 (t2>t), if (t2-t) is smaller than the selected length of prediction step, persistence approach shall be used to predict within time range (t2-t), i.e. the predicted power equals to real-time power of previous moment.
3) The phenomenon that wind speed is smaller than cut-in speed leads to the stop of wind turbine. Probability model shall be used for determination in this situation. Analyze the points that wind turbine power was 0 and corresponding wind speed was less than cut-in wind speed (3m/s) from Jan. 2012 to Sept. 2012 of one wind farm (hereinafter referred to as stop point). Find out 3 consecutive wind speed points (named as the point 1, the point 2 and the point 3, the point 3 is the point closest to the stop point on time axis) before stop points. Each 3 points makes a group. Figure 3 has demonstrated the frequency number distribution drawing of all 3 consecu-tive points in front of the stop points of one wind turbine in wind farm from Jan. 2012 to Sept. 2012.
It can be seen from above figure that the wind speed of almost all points is less than 4m/s. Calculate the descent rate between 3 points in each group, i.e. (Point 1-Point
0 5 10 15 0 500 1000 1500 2000 2500 3000 3500 F req uenc y N u m be r Point 1 Windspeed (m/s)
0 5 10 15 0 500 1000 1500 2000 2500 3000 3500 Windspeed (m/s) F req uenc y N u m be r Point 2
0 5 10 15 0 500 1000 1500 2000 2500 3000 3500 Windspeed (m/s) F req uenc y N u m be r Point 3
Figure 3. 3 consecutive points in front of the stop points wind speed frequency number distribution.
2)/Δt, (Point 2-Point 3)/Δt. Δt is sample interval. It’s shown that almost all rate of descent is larger than +1.1. Other wind turbines of the wind farm have the similar distribution characteristics. Therefore, suppose that the real-time wind speed of single wind turbine at current time t is wind speed [t], if two consecutive wind speed sampling points before t is wind speed [t-Δt] and wind-speed [t-2Δt] satisfy Equation (3), the predicted power at time t+1 is 0.
[ ] 4 /
[ ] 4 /
[ - 2 ] 4 /
( [ ] - [ ]) / 1.1
( [ 2 ] - [ ]) /
windspeed t m s
windspeed t t m s
windspeed t t m s
windspeed t t windspeed t t
windspeed t t windspeed t t t 1.1 (3)
3.2. Smooth Control Strategy
The principle for controlling the active power of wind farm with FESS is as follows: when wind energy is af-fluent, surplus energy will be converted into kinetic en-ergy and be stored in the flywheel through charging process with increasing rotate speed. When wind power decreases or active power of the system is deficient, lowing rotate speed to release stored energy to stabilize the output power of wind farm around target value. Sup-pose that actual output power of wind farm is and the target power of wind farm with FESS is , the reference power for FESS is Equation (4):
wf P
expect P
exp
ref ect wf
P P P (4)
when , flywheel is operating as electromotor; when 0 ref P 0 ref
P , flywheel is operating as generator. In
order to make the wind farm output as target power
expect, i.e. the key is the calculation method for expect
and the control of reference power of FESS. Generally, in traditional expect calculation, a relatively smooth
curve can be obtained from actual wind farm output power through low pass filter [20, 21].
P P
P
wf
A new expect smooth calculation method was pro-posed in this paper based on forenamed ultrashort-term wind power prediction algorithm. Firstly, the average wind speed is defined as Equation (5):
P P
average v
( t ( ) ) /
average t
v
v t dt (5)wherein, is current time, t is integration interval and t.
( )
v t is calculated by actual wind speed series through above mentioned prediction algorithm. Input average wind speed calculated by equation (5) into fitted power curve to obtain expect, i.e. exp ,
ref of FESS shall be controlled to output compound
power as the smoothed power . Thus, the wind ( )
f v P P ect f v( average)
ect P
exp
[image:3.595.62.288.541.710.2]power fluctuation is leveled. The prediction horizon is F and its length is not less than control horizon m. In this paper, F=m=30s. The prediction sample interval is inte-gral multiple of simulation step of the system. Figure 4 has displayed the actual wind speed curve of wind farm and corresponding predicted wind speed and average wind speed. There is an integrating process from the 0s to around 1.2s.
The smoothness of expect can be changed through adjusting integration interval P . As for wind farm with multiple sets of wind turbines, if the distribution form of wind turbines and wake effect are not be taken into ac-count, approximately Pexpect k f v( average), wherein, k represents sets of wind turbines. The essence of given reference power is the smoothing of predicted power. Combined with wind power prediction technology, FESS track the planned output power of wind farm to same degree and smooth the irregular fluctuation of wind power. The accuracy for expect to track the planned output of wind farm is decided by the precision of wind power prediction. The introduction of FESS reduces the increased system reserve capacity due to the error of wind power prediction and smoothes the wind power output simultaneously, which contributes to the operation management of power system dispatching department to wind farm.
P
3.3. Control of the FESS
PMSM, used as drive motor for FESS, is adopted the control method of maximum torque per ampere (MPTA) [22] to make the stator current vector orthogonal with rotor axis in reverse direction. i.e. and electro-magnetic torque is
0
sq
i
f sqi
1.5
e m
T P . A linear relation is
formed between electromagnetic torque and stator cur-rent on q axis component. Control sq to adjust the tor-que e, thereby, the reference power ref of FESS can be controlled. Converter at motor side is controlled by space vector pulse width modulation (SVPWM). And converter at power grid side is adopted the double closed-loop control of voltage and current.
i P
T
When calculating reference power, rotor speed limit of flywheel shall be taken into consideration. It’s set that FESS can operate normally only when the rotor speed is higher than minimum rotor speed and reference power is less than or equals to 0, or the rotor speed is lower than the maximum rotor speed and reference pow-er is largpow-er than 0 [23].
w
To avoid repeated accelerating of flywheel, new con-trol rules are set as: (1) when FESS is operating normally, reference torque of the FESS is ;
is friction coefficient and m is rated rotor speed of
the FESS; (2) When the rotor speed reaches maximum speed and , the reference torque is
/
ref ref m
T P w B w
ref m
T B w
B w
0
ref
P ;
(3) When Pref 0 and rotor speed reduces to minimum speed, the reference torque is 0 and the FESS stops gen-erating.
4. Simulation
Established the simulation platform is shown in Figure 1 in Matlab/Simulink. Refer to simulation parameters set-ting in reference [13]. The wind farm contains 12 DFIGs with a rated capacity of 1.5 MW and rated wind speed 15 m/s. Power grid is composed of 1 synchronous generator (SG). The maximum output power of FESS is 6MW and simulation time is 30 s. Refer to Table 1 for other main simulation parameters.
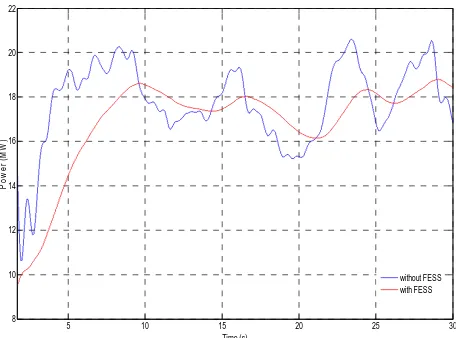
Under wind speed fluctuation shown in Figure 4, ac-tual power output curve of wind farm without FESS and compound power curve of wind farm with FESS using aforementioned control strategy are shown in Figure 5. Surge current of wind turbine will generate when starting the simulation model. After 1.7 s, the system is stable.
19
0 5 10 15 20 25 30
11 12 13 14 15 16 17 18
Time (s)
W
inds
peed (
m
/s
)
Predicted Windspeed Actual Windspeed Average Windspeed
[image:4.595.309.540.330.501.2]Integrating Process
[image:4.595.308.538.545.734.2]Figure 4. Curves of wind speed and average wind speed.
Table 1. Main parameters of the simulation system.
Simulation Parameters Devices
Parameter Value
Rotational inertia 600 2
kg m
Initial speed 4000rpm FESS
Friction coefficient 0.001 1 N m s rad
Rated voltage 575V DFIG
Maximum output power 1.75MW
Rated voltage 13.8kV
Rated power 200MVA SG
And then, two indicators are introduced to determine the smoothness of active power output.
1) Maximum fluctuation of compound output power of wind power and energy storage shall not exceed 10% of rated capacity of wind farm rated within any 20
min-utes. During the simulation time after stable operation of the system, the difference between maximum and mini-mum compound output power is 9.3MW, far less than rated capacity of wind farm 18MW. It can be concluded from Figure 5 that smooth control strategy with FESS has reduced the duration when the output power of wind farm is higher than the rated power.
P
2) Define smooth coefficient [12] as Equation (6):
0
( |t wf / | ) / rated
Smooth
dP dt dt P (6) [image:5.595.59.287.329.498.2]The smaller the gradient of smooth coefficient curve, the smoother active power output to power grid. Refer to Figure 6 for smooth coefficient curve with/without FESS.
5 10 15 20 25 30
8 10 12 14 16 18 20 22
Time (s)
Po
w
e
r (
M
W
)
without FESS with FESS
Figure 5. Curve of active power output of wind farm with/ without FESS (From 1.7s).
0 5 10 15 20 25 30
0 0.5 1 1.5 2 2.5 3
Time (s)
S
m
oot
h C
oef
fi
c
ient
[image:5.595.58.543.499.738.2]without FESS with FESS
Figure 6. Curves of smooth coefficient with/without FES
flu
ooth control strategy for active power
National Natural Science
[1] Y. Z. Sun, J. uence Research of
Power
, “Power Smoothing Control
al., “Smoothing Control
G. Infield, “Energy Storage and its
S.
It can be seen from above figure that there is larger ctuation in active power output of wind farm without FESS even though DFIG is operating under the control strategy of MPPT. After using FESS, the proposed con-trol strategy reduces wind power fluctuation significantly without affecting wind energy utilization efficiency. The smooth coefficient is only 25% of that without FESS.
5. Conclusions
In this paper, a smof wind farm with FESS was realized. Meanwhile, the demand of power grid dispatch for wind power predic-tion was also taken into considerapredic-tion. A new calculapredic-tion method for FESS reference power was proposed based on improved wind power prediction algorithm and power curve modeling. From the quantitative analysis of simu-lation results, it could be concluded that the proposed control strategy would smooth the fluctuation of wind power effectively and track short-term planned output power of wind farm favorable. Therefore, the smooth control strategy has improved schedulability of wind farm, which contributes to the stable operation of power grid. However, the effects that the precision of wind power prediction and energy storage capacity act on the control of active wind power need a further study.
6. Acknowledgements
This work is supported byFoundation (NNSF) of China under Grant 50937002 and by the Fundamental Research Funds for the Central Uni-versities under Grant SWJTU09ZT10.
REFERENCES
Wu and G. J. Li, “InflWind Power Generation on Power Systems,” Power
Sys-tem Technology, Vol. 31, No. 20, 2007, pp. 55-62.
[2] H. Holttinen and R. Hirvonen, “Wind Power in Systems,” 1st Edition, John Wiley & Sons Ltd., Chiches-ter, 2005.
[3] Q. Xiong and L. Liao
egy for Direct-driven Wind Power System with Flywheel Energy Storage System,” East China Electric Power, Vol.
40, No. 9, 2012, pp.1533-1539. [4] Y. C. Xue, N. L. Tai, K. Song, et
Strategy on Power Fluctuation of Power Filtering Based Wind Farm,” East China Electric Power, Vol. 39, No. 3,
2011, pp. 454-458. [5] J. P. Barton and D.
Use with Intermittent Renewable Energy,” IEEE
Trans-actions on Energy Conversion, Vol. 19, No. 2, 2004, pp.
441-448.doi:10.1109/TEC.2003.822305
[6] L. Changling, H. Banakar, S. Baike, et al., “Strategies to
Gen-erator,” IEEE Transactions on Energy Conversion, Vol.
22, No. 2, 2007, pp. 341-349.
doi:10.1109/TEC.2007.895401
“Power Smoothing
Con-Energy
Stor-T. Yan, “An Optimization
. Guo, “A Control Strategy for Battery
En-an, J. C. Zhang and J. H. Wang, “Improvement of
wer
ion Control of
ntrol of
eme Design for [7] Y. Liao, J. B. He, J. Yao, et al.,
trol Strategy of Direct-driven Permanent Magnet Syn-chronous Generator for Wind Turbine With Pitch Angle Control and Torque Dynamic Control,” Proceedings of
the CSEE, Vol. 29, No. 18, 2009, pp. 71-77.
[8] D. Q. Bi, B. M. Ge and W. L. Wang, “VRB
age System Based Power Control of Grid-connected Wind Farm,” Automation of Electric Power Systems, Vol.
34, No. 13, 2010, pp. 72-78. [9] H. S. Hong, Q. Y. Jiang and Y.
Control Method of Battery Energy Storage System with Wind Power Fluctuations Smoothed in Real Time,”
Au-tomation of Electric Power Systems, Vol. 37, No. 1, 2013,
pp. 103-109. [10] B. Li and J. B
ergy Storage System to Level Wind Power Output,”
Power System Technology, Vol. 36, No. 8, 2012, pp.
38-43. [11] J. P. Ru
Stability of Wind Farms Connected to Power Grid Using Flywheel Energy Storage System,” Electric Power
Sci-ence and Engineering, Vol. 24, No. 3, 2008, pp. 5-8.
[12] X. S. Hu, C. X. Sun, R. Liu, et al., “An Active Po Smoothing Strategy for Direct-driven Permanent Magnet Synchronous Generator Based Wind Turbine Using Fly-wheel Energy Storage,” Automation of Electric Power
Systems, Vol. 34, No. 13, 2010, pp. 79-83.
[13] R. Xiang, X. R. Wang and J. Tan, “Operat
Flywheel Energy Storage System Applying to Wind Farm,” Journal of Systems Science and Mathematical
Sciences, Vol. 32, No. 4, 2012, pp. 438-449.
[14] R. Takahashi and J. Tamura, "Frequency Co Iso-lated Power System with Wind Farm by Using Flywheel Energy Storage System," Proceedings of the 18th
Inter-national Conference on Electrical Machines of the ICEM,
Vilamoura, 6-9 September 2008, pp. 1-6. [15] P. Jiang and H. C. Xiong, “A Control Sch
Smoothing Wind Power Fluctuation with Hybrid Energy Storage System,” Automation of Electric Power Systems, Vol. 37, No. 1, 2013, pp. 122-127.
[16] M. Lei, L. Y. Shi, W. J. Chuan, et al., “A Review on the
Forecasting of Wind Speed and Generated Power,”
Re-newable and Sustainable Energy Reviews, Vol. 13, No. 4,
2009, pp. 915-920.doi:10.1016/j.rser.2008.02.002
[17] K. Chang, M. S. Ding, F. Xue, et al., “Ultra-short-term
Wind Power Prediction and its Application in Ear-ly-warning System of Power Systems Security and Sta-bility,” Power System Protection and Control, Vol. 40,
No. 12, 2012, pp. 19-24.
[18] J. F. Li, B. H. Zhang, G. L. Xie, et al., “Grey Predictor
Models for Wind Speed-Wind Power Prediction,” Power
System Protection and Control, Vol. 38, No. 19, 2010, pp.
151-159.
[19] W. Wangdee and R. Billinton, "Considering Load-carrying Capability and Wind Speed Correlation of WECS in Generation Adequacy Assessment,” IEEE
Transactions on Energy Conversion, vol. 21, No. 3, 2006,
pp. 734-741.doi:10.1109/TEC.2006.875475
[20] T. Tanabe, T. Sato, R. Tanikawa, I. Aoki, T. Funabashi and R. Yokoyama, "Generation Scheduling for Wind Power Generation by Storage Battery System and Mete-orological Forecast,” Proceedings of the Power and En-ergy Society General Meeting - Conversion and Delivery
of Electrical Energy in the 21st Century of the IEEE,
Pittsburgh, PA, 20-24 July 2008, pp. 1-7.
[21] J. V. Paatero and P. D. Lund, “Effect of Energy Storage on Variations in Wind Power,” Wind Energy, Vol. 8, No. 4, 2005, pp. 421-441.doi:10.1002/we.151
[22] X. Z. Tang, “Vector Control System of Permanent -Magnet Synchronous Motor,” Master Thesis, Zhejiang University, Zhejiang, 2005.
[23] C. Chapelsky, J. Salmon and A. Knight, "Control of a High-Inertia Flywheel as Part of a High Capacity Energy Storage System," Proceedings of the Canadian Confer-ence on Electrical and Computer Engineering of the
CCECE, Vancouver, BC, 22-26 April 2007, pp.