Munich Personal RePEc Archive
Linkages between Financial Development
and Openness: panel evidence from
developing countries.
Simplice Anutechia, Asongu
20 October 2010
Online at
https://mpra.ub.uni-muenchen.de/26926/
Linkages between Financial Development and Openness: panel evidence from
developing countries
.Simplice Anutechia Asongu
E-mail: [email protected]
Tel: 0032 473613172
HEC-Management School, University of Liège.
Abstract
In this paper, we contribute to existing literature on financial development and
openness by, sampling twenty-nine African countries with data spanning from 1987 to 2008.
Using panel empirical techniques, we provide evidence of bi-directional causality between
trade openness and financial openness; albeit, the former, bearing much more impact on the
later. Neither capital openness nor trade openness, significantly account for financial
development. Our results are robust to variable interaction via Principal Component Analysis.
For sampled countries, policy towards trade openness should be effective in view of inviting
private capital flows.
1. INTRODUCTION
At the advent of globalization, the issue of linkages between finance and openness
become more apparent. Beyond this truism, the success of China as an export driven
economy; following her joining the World Trade Organization (WTO) at the beginning of the
millennium, has achieved considerable trade and/or financial openness and economic growth.
Its quick recovery from the 2008 global economic downturn and financial melt-down; amid
struggling western nations, point to the great role, this emerging country will have on the
global business arena in the 21st century. Any right minded policy maker should of
consequence, be nursing the concern of knowing how, openness has led to financial
development and growth in other developing countries. This has been confirmed by many a
study, which point to the existence of a positive bearing of trade openness on growth:
Spatareanu and Manole(2010) who find out; less trade protection is associated with higher per
capita1, Welch and Romain(2008) show that, over the 1950-98 time frame, economies with
liberalized trade regimes experienced higher growth rates.
Dornbusch (1992) presented the case for trade liberalization for developing countries
in which, he spelled out the need for service-trade liberalization and regional trade
agreements; in an effort to achieve vested economic development. He asserted; trading
restrictions should be gradually lifted with progress in development. Rajan and
Zingales(2003), via a panel of twenty-four countries(industrialized for the most part) show
that, simultaneous opening of trade and capital accounts is key to financial development;
especially financial market development, when cross-border capital flows are free. This
hypothesis is partially confirmed by Baltagi et al. (2009), who investigate the premise put
forward by Rajan and Zingales. From a bank sector development perspective, their findings,
indicate; on an independent basis, both trade openness and financial openness bring about
1
financial development; thus slightly disagreeing with Rajan and Zingales (2003). However,
interactions of trade and financial openness suggest a negative marginal effect; implying
closed economies could benefit by opening both their trade and financial accounts2. This
thesis is further confirmed by Hanh(2010), whose study on twenty-nine Asian countries,
shows the existence of bi-directional causality between trade(financial) openness and
financial development. Kim et al.(2010) using Pooled Mean Group on eighty-eight
countries; spanning from 1960-2005, show a positive long run relationship between trade
openness and financial development; albeit, coexistence of negative short run coefficients.
A number of studies have been focused exclusively on Africa in the investigation of
this relationship; albeit, ‘growth’ oriented for the most part. Such are the likes of Mbabazi et
al. (2008), whom, via cross-section and panel econometric techniques, investigate the link
between growth, inequality and openness from forty-four sub-Saharan African(SSA)
countries on data spanning from 1970-95. Their results provide evidence of a positive
association between openness and growth. Kandiero and Chitiga(2003) probe into linkages
between openness and Foreign Direct Investment(FDI) in the continent and discover FDI to
GDP responds well to increased openness for the economy in general and the service sector in
particular. Suffice here to mention that, FDI: with respect to Lane and Milesi-Ferreti (2006), is
an appreciator of financial openness. Thus, in a nutshell shell, their conclusion could be revised as;
trade account openness lead to capital account openness; in other words, trade openness breeds
financial openness.
In this paper, our concern will be to investigate the effects of trade (financial)
openness on the financial intermediary sector development of selected African countries. In
plainer terms, we shall seek to discover what impact, opening-up the goods and services
markets in the continent, has had on finance. Our motivation for this line of research is
embedded on the facts that: (1) we didn’t find existing literature dwelling directly on the
2
subject matter; (2) beyond this objective perspective, investigating this link in an exclusively
African context, could be desirous of examination for policy making; amid current debates on
globalization, free trade and poverty.
2. DATA and METHODOLOGY
[image:6.595.66.536.251.524.2]2.1 Data
Table 1: Data collection summary
Definition of Proxy and( source)
Sign of Proxy
Justification of choices Usage in Literature Financial
Development (FD)
Private Credit by deposit money banks on GDP (FDSD).
PCRgdp These indicators from the FDSD have been widely acclaimed and used in recent literature. Among available
proxies, these are chosen based on data availability.
For the control
variables; GDPpcg also helps to access welfare impact. We also introduce complimentary
indicators for control3.
Baltagi et al. (2009), Hanh(2010)
Liquid Liabilities on GDP(FDSD)
LLgdp Hanh(2010),
Gries et al. (2009) Financial Openness (FO) Foreign Direct Investment on GDP(ADI)
FDIgdp Lane and
Milesi-Ferreti (2006), Baltagi et al. (2009), Hanh(2010) Gross Private
Capital Flows on GDP(ADI)
PCFgdp
Trade
Openness(TO)
Imports + Exports on GDP(ADI)
IXgdp Hanh(2010)
Control Variable(s)
GDP per capita growth(ADI)
GDPpcg
FDSB: Financial Development and Structure Database. ADI: African Development Indicators.
3
2.2 Methodology
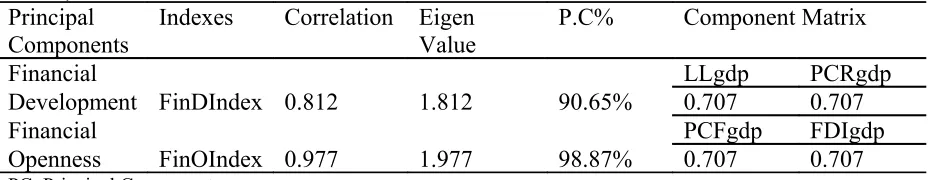
[image:7.595.67.533.153.243.2]2.2.1 Principal Component Analysis (PCA)
Table 2: Derivation of Indexes (Financial Development Index and Financial Openness Index)
Principal Components
Indexes Correlation Eigen Value
P.C% Component Matrix
Financial LLgdp PCRgdp
Development FinDIndex 0.812 1.812 90.65% 0.707 0.707
Financial PCFgdp FDIgdp
Openness FinOIndex 0.977 1.977 98.87% 0.707 0.707
PC: Principal Component
We use PCA to derive two indexes for F.D and T.O. This is done by reducing the data
set dimension while retaining as much initial information as possible. Based on Kaiser 1
criterion(Kaiser, 1960), we’re able to retain only the first Principal Components(PC) that
reflect 90.65% and 98.87% of total variation in F.D and T.O proxies, respectively. This
indexes (aka PCs) will serve for robustness tests upon empirical analysis.
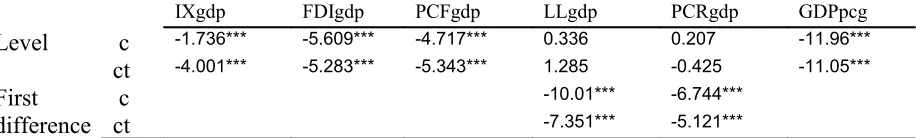
2.2.2 Unit root tests
As illustrated by tables 3 and 4, we employ Levin, Lin and Chu (LLC-2002) and Im,
Pesaran and Shin (IPS-2003) panel unit root tests, to investigate the stationary properties of
our data at both level and first difference series. In respective cases, when there’s exhibition
of unit root at level series: absence of ‘stationarity: I(0)’, we endeavor to further investigate if
the series is integrated in the first order: I(1). While the LLC test is a homogenous one that
assumes a common unit root for all cross sections (and therefore within variation), the IPS test
is based on heterogeneous unit roots (between variation). Suffice to mention here that, both
tests are first generational unit root tests that have ‘cross sectional independence’ as premise.
We assume cross sectional independence because; our proxies are macroeconomic indicators
from countries with independent economic policies. Beyond this truism, the absence of a
these tests because; they’re widely used and constitute just an exploratory side of our analysis.
From results presented on tables 3 and 4, only LLgdp and PCRgdp are stationary at first
difference. In the conflict of interest between LLC and IPS over if, PCRgdp is integrated at
level series or first difference, we base our decisions on the later test, because in the former
(LLC), the alternative hypothesis of autoregressive parameter being less than one is stronger
than the null (all autoregressive coefficients equal zero). Since unit root tests are
autoregressions processes, optimal lag selection is crucial for efficiency of results. Goodness
of fit is ensured by the Akaike Information Criterion (AIC) because, as shown by Khim and
Liew(2004), when the number of observations are below 60, AIC most optimally specifies
which number of lags produce a model that fits the data structure. However, when
observations exceed 60, the Hannan-Quin Criterion (HQC) is best. We therefore adopt AIC
[image:8.595.74.532.607.676.2]and HQC for IPS and LLC tests, respectively.
Table 3: LLC Unit Root Test
IXgdp FDIgdp PCFgdp LLgdp PCRgdp GDPpcg
Level c -2.788*** -5.517*** -4.267*** 0.696 -2.451*** -11.79***
ct -5.173*** -7.043*** -6.441*** -0.289 -1.401*** -11.95***
First difference
c -9.933***
ct -9.108***
*,**,*** denote significance at 10%, 5% and 1% respectively. Maximum lag is 2 and optimal lags are chosen via HQC. ‘c’ and ‘ct’: ‘constant’ and ‘constant and trend’ ;respectively.
Table 4: IPS Unit Root Test
IXgdp FDIgdp PCFgdp LLgdp PCRgdp GDPpcg
Level c -1.736*** -5.609*** -4.717*** 0.336 0.207 -11.96***
ct -4.001*** -5.283*** -5.343*** 1.285 -0.425 -11.05***
First difference
c -10.01*** -6.744***
ct -7.351*** -5.121***
2.2.3 Model specification tests
By virtue of Hausman(H) and Breusch Pagan(BP) tests, we’re able to determine if,
specific cross sectional effects, affect estimators or not(fixed or random effect) and whether
variance of residuals affect independent variables; respectively. While the null hypothesis of
H-test argues for a random effect model (both estimators are consistent and only the constant
is efficient), the BP equivalent, assumes homosedasticity. As indicated on table 5, we adopt
for instance ‘Generalized Least Squares with Fixed Effect(GLS with FE)’ because, cross
sectional effects play a role in the outcome of estimators and, variance of residuals is not
constant(second column for example). For ‘Ordinary Least Squares with Random Effect
(OLS with RE)’ as model, the contrary is evident: homoscedasticity and absence of
consistency in constant estimator (fourth column).
Table 5 : Panel Model Specification
Model Dependent Variables
Specification Financial Openness Trade Open. Financial Development
Tests FDIgdp PCFgdp IXgdp d_LLgdp d_PCRgdp
Hausman T. 23.85*** 20.58*** 14.29** 6.88 32.12*** Breusch P. T. 108.94*** 122.29*** 2321.4*** 0.93 15.16*** Model GLS with FE GLS with FE GLS with FE OLS with RE GLS with FE Breusch Pagan and Hausman tests all follow a chi-square distribution. *,**,*** denote significance levels at 10%, 5% and 1% respectively. GLS: Generalized Least Squares. OLS: Ordinary Least Squares. FE: Fixed Effect.
2.2.4 Model Formulation
Let’s consider the following equations :
+ +
+
= i it it
it PCR LL
FDI γ10 γ11 γ12 γ13IXit + γ14PCFit + γ15GDPpcgit +
ε1it (1)
+ +
+
= i it it
it PCR LL
PCF γ 20 γ 21 γ 22 γ 23IXit + γ 24FDIit + γ 25GDPpcgit +
ε 2it (2)
+ +
+
= i it it
it PCF FDI
LL γ30 γ 31 γ 32 γ33IXit + γ 34PCRit + γ 35GDPpcgit +
ε3it (3)
+ +
+
= i it it
it PCF FDI
PCR γ 40 γ 41 γ 42 γ 43IXit + γ 44LLit + γ 45GDPpcgit +
it
4
ε
+ +
+
= i it it
it PCF FDI
IX γ 50 γ 51 γ52 γ53PCRit + γ 54LLit + γ 55GDPpcgit +
ε5it (5)
+ +
+
= i it it
it FinOIndex IXgdp
FinDIndex γ 60 γ 61 γ 62 ε6it
(6)
+ +
+
= i it it
it FinDIndex IXgdp
FinOIndex γ 70 γ 71 γ 72 ε7it
(7)
+ +
+
= i it it
it FinOIndex FinDIndex
IXgdp γ 80 γ 81 γ 82 ε8it
(8)
With: i= 1,2,...,29 countries; over time t = 1,2,...,20 ; IX is same as IXgdp. But for
variables in equations 6, 7 and 8, and GDPpcg; all proxies are on GDP (see table 1). While the
first five 5 equations are initial/original models, the last three emanating from principal
component analysis are robustness tests: in the nutshell the last three check the first five.
3. EMPIRICAL ANALYSIS
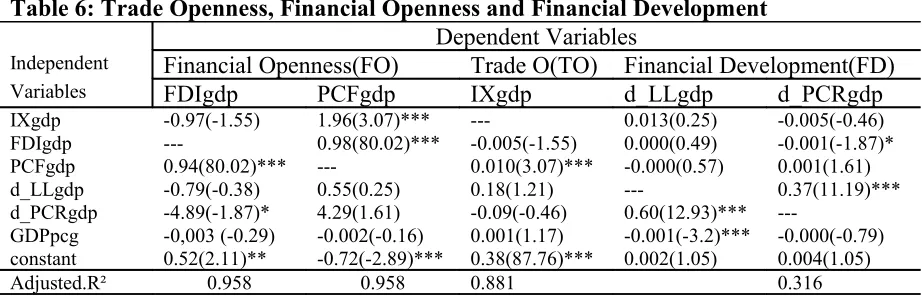
[image:10.595.66.527.449.597.2]3.1 Empirical Results
Table 6: Trade Openness, Financial Openness and Financial Development
Dependent Variables
Independent Financial Openness(FO) Trade O(TO) Financial Development(FD)
Variables FDIgdp PCFgdp IXgdp d_LLgdp d_PCRgdp
IXgdp -0.97(-1.55) 1.96(3.07)*** --- 0.013(0.25) -0.005(-0.46) FDIgdp --- 0.98(80.02)*** -0.005(-1.55) 0.000(0.49) -0.001(-1.87)* PCFgdp 0.94(80.02)*** --- 0.010(3.07)*** -0.000(0.57) 0.001(1.61) d_LLgdp -0.79(-0.38) 0.55(0.25) 0.18(1.21) --- 0.37(11.19)*** d_PCRgdp -4.89(-1.87)* 4.29(1.61) -0.09(-0.46) 0.60(12.93)***
---GDPpcg -0,003 (-0.29) -0.002(-0.16) 0.001(1.17) -0.001(-3.2)*** -0.000(-0.79) constant 0.52(2.11)** -0.72(-2.89)*** 0.38(87.76)*** 0.002(1.05) 0.004(1.05)
Adjusted.R² 0.958 0.958 0.881 0.316
*,**,*** denote significance levels at 10%, 5% and 1% respectively. R²: Coefficient of determination.
Results as presented on table 6 suggest that: (1) private domestic credit (FD) decreases
foreign domestic investment (TO) and vice-versa; (2) private capital flows (F.O) improve
trade openness and vice-versa; (3) growth in GDP per capita negatively affects liquidity
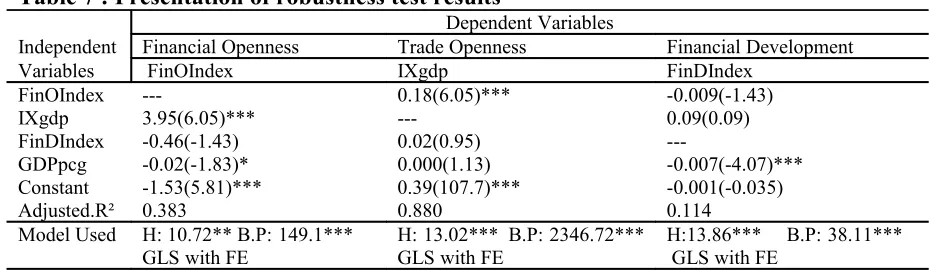
3.2 Robustness tests
Table 7 : Presentation of robustness test results
Dependent Variables
Independent Financial Openness Trade Openness Financial Development
Variables FinOIndex IXgdp FinDIndex
FinOIndex --- 0.18(6.05)*** -0.009(-1.43)
IXgdp 3.95(6.05)*** --- 0.09(0.09)
FinDIndex -0.46(-1.43) 0.02(0.95)
---GDPpcg -0.02(-1.83)* 0.000(1.13) -0.007(-4.07)*** Constant -1.53(5.81)*** 0.39(107.7)*** -0.001(-0.035)
Adjusted.R² 0.383 0.880 0.114
Model Used H: 10.72** B.P:149.1*** GLS with FE
H:13.02*** B.P:2346.72*** GLS with FE
H:13.86*** B.P:38.11*** GLS with FE
*,**,*** denote significance levels at 10%, 5% and 1% respectively. R²: Coefficient of determination, H:Hausman Test, B.P: Breusch Pagan, GLS:Generalised Least Squares.
Based on robustness tests from aggregated variables (in reduced dimension) from
PCA: (1) trade openness leads to financial openness and vice versa; (2) financial development
has no significant link with any indicator of openness and vice-versa; (3) improvement in
welfare decreases financial openness and development. The hypothesis of financial openness
(via foreign direct investment) decreasing financial development (through private credit) is
not confirmed from robustness check, probably because; its significance level is 10%. Thus,
basing our analysis entirely on 1% and 5% significance levels, we can firmly established that,
for sampled countries; opening of trade accounts will leads to increase in financial accounts
and vice-versa. These significant results confirm those of Kandiero and Chitiga (2003),
Baltagi et al. (2009) and Hanh (2010). However, detail interpretation suggest: trade openness
leads more to financial openness; in our case the trade openness elasticity of financial
openness(3.95) is about twenty times higher than the financial openness elasticity of trade
openness(0.18). Our robustness checks also confirm failure of financial development to breed
openness. What is quite puzzling is the fact that, growth per capita only decreases financial
openness and development. Some explanation to this could be: (1) unequal distribution of
corruption associated with GDP growth, where-by; a great part of siphoned funds is deposited
abroad in an attempt to evade detection.
For policy implication, sampled countries should be aware of the irresponsiveness of
financial development to openness and vice- versa. Given that, from common sense and to
some extend economic theory, we cannot completely rule-out the finance led openness nexus,
we suggest further findings on the African continent be based on: (1) distinction between
closed and open countries; (2) classification of low and middle income countries;(3)
verification if interaction of openness indicators as defined by of Baltagi et al. (2009), is the
prime and only condition for financial development: as was the basis and frame work of Rajan
and Zingales (2003).
4. CONCLUSION
Our modest contribution to existing literature on the openness-financial development
nexus has confirmed the existence of bi-directional causality between openness indicators
(financial and trade). However we fail to find any significant link between financial
development and both qualities of openness. It is our earnest hope that, more empirical studies
Appendix A: List of African Countries
Regions Countries
East Africa Burundi, Kenya, Rwanda, Tanzania, Uganda, Sudan.
West Africa Côte d’Ivoire, Ghana, Senegal, Sierra Leon, Mali, Togo, Nigeria. Central Africa Congo Republic, Gabon, Cameroon.
North Africa Egypt, Morocco, Tunisia.
Southern Africa Swaziland, South Africa, Angola, Zambia, Botswana, Mauritius, Madagascar, Mozambique, Lesotho,Malawi.
Source (author)
Appendix B: Summary Statistics (1988-2007; countries: 29)
Variables Source M.Unit Mean S.D Min. Max. Kurt. Skew. Observ.
IXgdp ADI % GDP 0.39 0.21 0.00 1.37 4.15 1.81 580 FDIgdp ADI % GDP 2.61 5.03 -8.62 42.49 23.44 4.14 552 PCFgdp ADI % GDP 2.63 5.08 -9.10 42.49 22.23 3.96 556 LLgdp FDSD % GDP 0.29 0.19 0.04 0.97 2.07 1.67 550 PCRgdp FDSD % GDP 0.17 0.16 0.011 0.75 1.84 1.62 547 GDPpcg ADI % 1.45 5.18 -46.89 37.83 19.27 -1.26 579 GDPg ADI % 3.84 5.38 -50.24 35.22 21.88 -1.84 579
IXgdp : Import plus Export on GDP, FDIgdp :Foreign Direct Investment, PCFgdp:Private Capital Flows on GDP, LLgdp: Liquid Liabilities on GDP, PCRgdp: Private Credit on GDP, GDPpcg: GDP per capita growth, M.Unit: Measurement Unit, S.D: Standard Deviation, Min:Minimun , Max:Maximum, Kurt:Kurtosis, Skew: Skewness, Observ: Observations. PCA: Principal Component Analysis, ADI : African Development Indicators, FDSD :Financial Development and Structure Database.
Appendix C: Correlation Matrix
IXgdp FDIgdp PCFgdp LLgdp PCRgdp GDPpcg
IXgdp 1.000
FDIgdp 0.469 1.000
PCFgdp 0.462 0.977 1.000
LLgdp 0.129 -0.048 -0.032 1.000
PCRgdp 0.062 -0.113 -0.077 0.812 1.000
References
Baltagi, B.H., Demetriades, P.O., & Law, S. H.,(2009), “Financial Development and
Openness: evidence from panel data”, Journal of Development Economics, 89(2), pp.285-296.
Demirguc-Kunt, A., Beck, T., & Levine, R., (1999), “A New Database on Financial Development and Structure”, International Monetary Fund, WP 2146.
Demirguc-Kunt, A., & Beck, T., May (2009), “Financial Institutions and Markets Across Countries over time: Data and Analysis”, World Bank Policy Research Working Paper No. 4943.
Dornbusch, R. (1992), “The Case for Trade Liberalization in the Developing countries”, Journal of Economic Perspectives, 6(1), pp.69-85.
Gries, T., Kraft, M., & Meierrieks, D., (2009), “Linkages between financial deepening, trade openness, and economic development: causality evidence from Sub-Saharan Africa”, World Development, 37(12), pp. 1849-1860.
Hanh, P. T. H., (2010), “Financial Development, Financial Openness and Trade Openness: New evidence”, CARE – EMR, University of Rouen, France.
Im, K.S., Pesaran, M.H., & Shin, Y., (2003), “Testing for unit roots in heterogeneous
panels”, Journal of Econometrics", 115, pp.53-74.
Kaiser, H. F., (1960), “The application of electronic computers to factor analysis”, Educational and Psychological Measurement, 20, pp. 141-151.
Khim, V., & Liew, S., (2004), “Which lag selection criteria should we employ”, Economics Bulletin, 3(33), pp.1-9.
Lane, P.R., Milesi-Ferretti, G.M., (2006), “The external wealth of nations Mark II: revised
and extended estimates of foreign assets and liabilities 1970–2004”, IMF Working Paper
06/69.
Levin, A., Lin, C.F., & Chu, C.S., (2002), “Unit root tests in panel data: asymptotic and finite-sample properties”, Journal of Econometrics, 108,pp. 1-24.
Mbabazi, J., Milner, C., & Morrissey, O., (2008), “Trade Openness, Trade Cost and Growth: Why Sub-Saharan Africa Performs Poorly”, Centre for Research in Economic Development and International Trade, University of Nottingham.
Spatarenu, M., & Manole, V., (2010), “Trade Openness and Income: a re-examination”, Economic Letters, 106, pp.1-3.
Rajan, R.G., & Zingales, L., (2003), “ The great reversals: the politics of financial development in the twentieth century”,, Journal of Financial Economics, 69,pp.5–50.
Kim, D., Lin, S., & Suen, Y., (2010), “ Dynamic effects of trade openness on financial development”, Economic Modelling, 27, pp. 254-261.